 2016, Vol. 34
Institute of Oceanology, Chinese Academy of Sciences
Article Information
- LIAO Baochao(廖宝超), LIU Qun(刘群), ZHANG Kui(张魁), Abdul BASET, Aamir Mahmood MEMON, Khadim Hussain MEMON, HAN Yanan(韩亚楠)
- A continuous time delay-difference type model (CTDDM) applied to stock assessment of the southern Atlantic albacore Thunnus alalunga
- Chinese Journal of Oceanology and Limnology, 34(5): 977-984
- http://dx.doi.org/10.1007/s00343-016-5126-x
Article History
- Received Apr. 28, 2015
- accepted in principle Jul. 7, 2015
- accepted for publication Jul. 31, 2015


2 South China Sea Fisheries Research Institute, Chinese Academy of Fishery Sciences, Guangzhou 510300, China;
3 Marine Fisheries Department, Fish Harbor, West Wharf, Karachi 74000, Pakistan
Albacore, Thunnus alalunga Bonnaterre, is a widely distributed tuna species (Yeh et al., 1990; Sun et al., 2002; Viñas et al., 2004), which constitutes a commercially important stock with recruitment, growth, and mortality rates as all varying continuously over time. T. alalunga is highly migratory, cosmopolitan, and inhabits tropical and temperate pelagic oceans waters (Yeh et al., 1990; ICCAT, 1999; Viñas et al., 2004). The International Commission for the Conservation of Atlantic Tunas (ICCAT) has delimited three groups of albacore stock in the Atlantic: the northern and southern Atlantic stocks (Separated at 5°N) and the Mediterranean stock (ICCAT, 1999). Since the early 2000s the southern Atlantic stock has been considered to a have big development potential. Its catch was stabilized at about 30 000 t from 1988 to 2001, with a peak of 40 630 t, but the average has since declined to 21 000 t for the past five years (ICCAT, 2013). International Seafood Sustainability Foundation (ISSF) and ICCAT (2012) reported that the T. alalunga stock is in a mildly over-fished state, and that measures should be taken for the sustainable utilization of this stock in future.
Many different methods have already been used to assess the albacore (T. alalunga) stock, such as the surplus production model (SPM), the age structured production model (ASPM), and the delay-difference model (D-DM) (Yeh et al., 1990; Sun et al., 2002; Viñas et al., 2004; ICCAT, 2012; Zhang et al., 2015a). In the ASPM, detailed biological information is required, and the SPM lacks biological realism (Quinn and Deriso, 1999; Haddon, 2011). The delaydifference model (D-DM) considers biological information in a simple way (Deriso, 1980; Musick and Bonfil, 2005; Collette et al., 2006), in which the fishing mortality rate is used independently of the age of the fish at recruitment age and older (Quinn and Deriso, 1999; Su and Peterman, 2012). It has already been successfully used to estimate stock size in sharklike fishes (Musick and Bonfil, 2005), fishes with long life cycles (Pallare and Restrepo, 2003; Jensen et al., 2009), lobster (Hall, 1997), and prawn (Dichmont et al., 2003). The delay-difference equation is a biomass dynamic model, but with biologically meaningful (directly measurable) parameters and also accounts for basic time delays due to growth and recruitment (Hilborn and Walters, 1992). The discrete time formulation does not work well for populations with the consideration of continuously varying time delays of biological processes (Quinn and Deriso, 1999; Walters and Martell, 2004; Musick and Bonfil, 2005). Walters and Martell (2004) modified this delaydifference model, then Walters (2011), proposed a continuous time delay-difference model (CTDDM), in which recruitment, growth and mortality rates are treated as varying continuously over time. This study provides an application of CTDDM for this stock assessment in the southern Atlantic.
CTDDM treats recruitment, growth and mortality rates as all varying continuously over time, which is considered as a theoretical bridge between simple surplus-production models and complicated agestructured models (Walters and Martell, 2004). The dynamics of CTDDM characterize some commercially important stocks, such as shrimps and smaller tunas, and treats recruitment, growth, and mortality rates all as varying continuously over time (Walters and Martell, 2004; Musick and Bonfil, 2005; Walters, 2011). Being a bridge between ASPM and SPM, CTDDM is an alternative model necessary for appropriate albacore stock assessment (Walters and Martell, 2004). CTDDM provides an extremely compact performance of the exact dynamics of total numbers and biomass for the highly migratory cosmopolitan fish populations, such as albacore (T. alalunga). The CTDDM performs better than the discrete models for stocks that reproduce continuously over time (Walters, 2011). The CTDDM has not yet been applied in this albacore (T. alalunga) stock, and it may turn out to be a useful alternative model necessary to provide further information on this important international fishery.
In this study, the Beverton-Holt stock-recruitment relationship (SRR) model is used to explain the relationship between spawning biomass and recruitment. The maximum sustainable yield (MSY) and other biological reference points (e.g., BMSY, EMSY, and FMSY) are estimated. The MSY will change through time as the mixture of fishing mortalities by class changes. CTDDM were modified from the discrete-time delay-difference model, in which recruitment, growth, and mortality rates are treated as varying continuously over time. It is the first time that CTDDM has been used to assess the Atlantic albacore (T. alalunga) fishery. By using it, we hope to provide an alternative approach to the stock assessment of albacore (T. alalunga) and fill the gaps in simple surplus production models and complex fully age-structured models. The estimated results have been analyzed to verify the proposed methodology and provide reference information for sustainable management of the southern Atlantic albacore stock.
2 MATERIALData from 1975 to 2011 on the southern Atlantic albacore (T. alalunga) stock (ICCAT, 2012) have been used in this study. According to ICCAT, the southern Atlantic albacore stock is one of the biggest tuna populations in the world; the total catches of this stock in the previous 30 years ranged from 15 000 t to 40 000 t, which was mostly attributed to longline fisheries (ICCAT, 2011). The standardized catch per unit effort (CPUE) based on the Chinese Taipei longline fishery significantly indicates the relative abundance index of the southern Atlantic albacore (T. alalunga) stock (ICCAT, 2012). The length-weight relationship is from Penney (1994); the estimates of Von Bertalanffy growth parameter K, W∞, mean body weight at age, and a recruitment age of 5 years are from Lee and Yeh (2007); an instantaneous natural mortality is assumed to be constant at 0.3 per year for all age classes for this Atlantic albacore (ICCAT, 2012).
3 METHOD 3.1 ModelsContinuous time delay-difference model (CTDDM) provides an extremely compact performance of the exact dynamics of total numbers and biomass for agestructured populations.
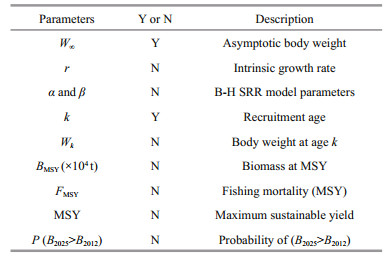
This model differs from previous such models in that the continuous-time rather than the discrete-time form of the biomass dynamics equation is considered. Summary statistics for the “known” (Y) or “estimated” (N) parameters and Biological Reference Points (BRPs) are shown in Table 1.
|
In the discrete time delay-difference model (DDM), the mean body weight of the fish follows a difference relationship for age a≥k that leads to the Ford-Brody version of the von Bertalanffy growth model (Hilborn and Walters, 1992). Schnute (1985) proposed that the point estimates of δ, ρ, and mean body weight at age k were obtained from von Bertalanffy growth model.
 (1)
(1) (2)
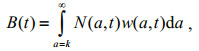
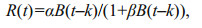
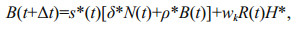
(2)where st is the overall survival for year t, a is age, wa is body weight at aged a, and δ and ρ are parameters. The Stock-Recruitment Relationship (SRR) suggested by Schnute (1985) and Fournier and Doonan (1987), has three-parameters. Hilborn and Walters (1992) suggested the Beverton-Holt SRR models to explain the relationship between spawning biomass and recruitment. The discrete time formulation of D-DM results in simple predictions of equilibrium biomass and numbers (Musick and Bonfil, 2005). CTDDM provides an extremely compact performance of the exact dynamics of total numbers and biomass for age structured populations. CTDDM is expressed as follows:
 (3)
(3) (4)
(4) (5)
(5)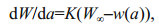 (6)
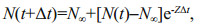
(6)where Bt is the stock biomass for year t, and Rt recruitment for the year t in the Beverton-Holt SRR model, and Na, t is stock number, Na, t=st–1 Na–1, t–1; K and W∞ are von Bertalanffy growth coefficients and asymptotic weight, respectively; biomass B∞ and the recruitment R∞ are the asymptotic values. The total instantaneous mortality rate Z(t)=F(t)+M, assumed to vary over time with changes in fishing mortality rate F(t). Any analytical solution of CTDDM was difficult to evaluate because of the integral form of the model expression. Under the constant R(t) and F(t) conditions, and taking differential Eqs.8 and 9 to equal zero, then C∞=FB∞, and N∞=R/Z, B∞=BPR×R, where BPR is biomass per recruit; α, β, and κ are the parameters of the Beverton-Holt SRR model. Under the conditions as the recruitment R(t) and fishing mortality rate F(t) are treated as piece-wise constant over short time intervals Δt, the N(t+Δt) is the exact predictions of population numbers at the end of each interval given starting values, and B(t+Δt) is the solution (analytical solution) of continuous time delay-difference population model.
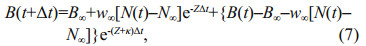 (7)
(7) (8)
(8) (9)
(9) (10)
(10) (11)
(11) (12)
(12)where B∞ and N∞ are the asymptotic values, H* and s* are transitional parameters, while ρ* and α* do not change except in case where the growth curve varies over time.
3.2 Predicted catch values from CTDDM compared with those from D-DMIn this study, the predicted results from CTDDM will be compared with those from the discrete time delay-difference model (D-DM) using three types of error (i.e., normal, log-normal and Gamma distribution). The error assumptions will be constructed in the predicted catch values from CTDDM and D-DM.
3.3 Biomasses and numbers from CTDDM compared with those from ASPMThis study constructed the Stock-Recruitment Relationships (SRR) model with very small age-time increments Δa, Δt < 0.1, and forced this model with the recruitment R(t) varying in an arbitrary pattern over time, and then the biomass and the numbers predicted from CTDDM do indeed track the age-structured production model (ASPM) predictions more and more precisely as the age-time increment becomes smaller.
3.4 Catch and effort data analysis (version 3.0.1, Hoggarth et al., 2006) (CEDA) and A surplus production model incorporating covariates (version 5.0, Prager, 2005) (ASPIC)The CEDA (Catch-effort data analysis, Hoggarth et al., 2006) and ASPIC (A surplus-production model incorporating covariates, Prager, 2005) software packages were used to compare the accuracy of the parameter estimates, notably B1/K, MSY, K, q, EMSY. The initial proportion of B1/K is assumed to be the ratio of the catch in 1975 (the initial year of data) over the catch in 1987 (the year of the largest catch) in CEDA and ASPIC, which gives a value of approximately 0.5.
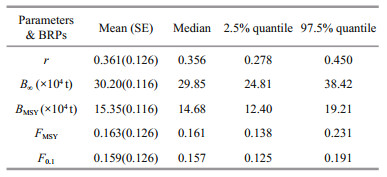
4 RESULTThe CTDDM was used to evaluate the growth parameters and Biological Reference Points (BRPs) of the southern Atlantic albacore (T. alalunga) stock, including r (the intrinsic growth rate), B∞ (the carrying capacity), BMSY (the biomass at MSY) (Table 2).
We obtained von Bertalanffy’s growth equation, which is Lt=147.5(1–e-0.126(t+1.89)), and the lengthweight relationship which is Wt=1.3718×10⁻⁵Lt3.093. The estimated growth parameters are listed as follows: W∞=71.56 kg, Wk=16.59 kg, and Wk−1=12.09 kg. The results of CEDA and ASPIC have been compared with the results from CTDDM (Table 3).
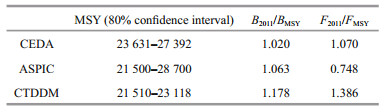
The catch in 2011 (24 100t) is higher than the values of MSY from CTDDM and the relative fishing mortality ratio in 2011 (F2011/FMSY) is higher than 1.0. The South Atlantic albacore (T. alalunga) in 1975– 2011 was assessed by discrete time delay-difference models and continuous time delay-difference models. The error assumptions of normal, lognormal, and gamma distribution were considered in the predicted catch values of the albacore (T. alalunga). Predicted catch values of CTDDM and discrete time D-DM with three types of error (i.e., normal, log-normal and Gamma distribution) are compared in Fig. 1.

|
| Figure 1 Predicted catch values of discrete and continuous models with three types of error (normal, log-normal, and Gamma distribution) a. discrete model with normal distribution; b. continuous model with normal distribution; c. discrete model with log-normal distribution; d. continuous model with log-normal distribution; e. discrete model with Gamma distribution; f. continuous model with Gamma distribution. |
Comparing the coefficient of variation (CV) between the discrete model (D-DM) and the continuous model (CTDDM) shows that the CV values from normal error distribution were higher than those in the lognormal and the Gamma distributions. The relationship between the average weight and the survival rate was obtained. This relationship can be used to explain the effect of variations in survival rate on the mean body weight and to estimate the survival rate for a particular observed mean body weight. With increasing growth parameter ρ, the average weight also increased (Fig. 2).

|
| Figure 2 Equilibrium relationships between survival rates and mean body weight for the southern Atlantic albacore (T. alalunga) stock |
The performance of CTDDM was compared to that of the age structured production model (ASPM). The total biomass and numbers predicted from CTDDM do indeed track the ASPM predictions more and more precisely as the age-time increment becomes smaller. Because we have little detailed age-structure information about the southern Atlantic albacore (T. alalunga) stock, the trajectory of the CTDDM tracks the biomass or numbers predicted from ASPM will not be considered in this study, instead of in the further study. The annual fluctuations in observed and predicted CPUE in the CTDDM are discussed here. The observed and predicted CPUEs (catch per unit effort) of CTDDM are compared in Fig. 3.

|
| Figure 3 Observed (Obs) and estimated (Est) catch per unit efforts (CPUE) of the southern Atlantic albacore (T. alalunga) stock using CTDDM |
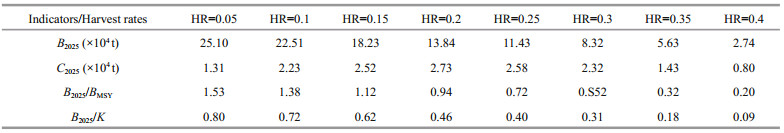
The annual fluctuations in observed and predicted CPUE in the CTDDM are very close. Harvest rates (HR) between 0.05–0.40 were set to estimate the indicators such as biomass, catch, B2025/BMSY, B2025/K, and the probability of P (B2025 < B2012). Risk assessment results of the surplus production model (SPM) and CTDDM are shown in Tables 4 and 5.
|

|
The SPM and CTDDM risk assessment outputs have a similar trend: with the increased harvest rates, biomass decreases, and the catch rises before the first half of the curve (harvest rate of 0.2) then decreasing afterwards. The results of CTDDM suggested a harvest rate of 0.15–0.20 may be the best option (Table 5).
4 DISCUSSIONThe main objective of this study is to provide an alternative method (a continuous time type model) to the southern Atlantic albacore (T. alalunga) stock assessment. Many methods have been already used to assess the albacore (T. alalunga) stock (Yeh et al., 1990; Sun et al., 2002; Viñas et al., 2004; ICCAT, 2012; Zhang et al., 2015b). The results of fish stock assessment can be different using different model approaches or using different data (Chen et al., 1992; Musick and Bonfil, 2005; Wang and Liu, 2006; Liu et al., 2012). Thus, the model and the data must be used carefully to ensure that the conclusions can be consistent with the current fisheries both management philosophy and realistic situations. The utility of a stock assessment method depends on the nature of the fisheries taking the stock. ICCAT (2011) used ASPIC that obtained B2009/BMSY at about 0.624–1.204, and F2009/FMSY at about 0.795–1.342; and used ASPM which obtained the two ratios at 1.063 and 0.748. In this study, CTDDM obtained the relative biomass ratio (B/BMSY) and the relative fishing mortality ratio (F/FMSY) of the stock in 2011 at about 1.178 and 1.386, respectively. They are higher than the values obtained by ICCAT using the traditional production models. Lee and Yeh (2008) suggested the MSY at about 28 771 t using ASPM; ICCAT (2011) used Fox non-equilibrium production model to obtain the MSY with 23 630 t to 27 390 t. CTDDM gets an 80% confidence interval of MSY of South Atlantic albacore population at about (21 510 t–23 118 t). Because the MSY will change through time as the mixture of fishing mortalities by age class changes, the risk assessment results showed that the catch initially increased until the harvest rate reached approximately 0.15 and then decreased. The equilibrium biomass decreased consistently in the whole process, the biomass decreased slower when catch declined.
ICCAT (2011) assessment report showed that the spawning stock of species in this study from 1997 to 2007 dropped by about 32%, which may result in overfishing. Reports showed that the southern Atlantic albacore stock had experienced overfishing from 1985 to 2005 (ICCAT, 2012). After that, this stock rebuilds gradually and the current situation is not critical, but it must be taken care of in the future. The International Foundation for Sustainable Seafood (ISSF) believes that this group was in a mild overfishing state in the early 2000s (ISSF, 2011). The yield of 2011 was 24 100 t, and the relative fishing mortality ratio (F2011/FMSY) of the stock was higher than 1.0 using CTDDM. Statistical properties of model parameters and other derived quantities used for setting management targets are relevant for conservation and management of fisheries resources. Most of delay-difference models that only considered one source of uncertainty had not yet been subject to extensive evaluations (Walters and Martell, 2004; Jiao et al., 2010). The uncertainties of CTDDM were considered in this study. The performance of CTDDM was in comparison with that of the age structured production model (ASPM) are discussed in this study. Annual fluctuations in the total biomass and the numbers predicted from CTDDM do indeed track the ASPM predictions more and more precisely as the age-time increment becomes smaller. We evaluated the accuracy of estimates of population parameters and biological reference points (BRPs) of the South Atlantic albacore population, and compared the results of traditional modeling method with those from CTDDM. The CTDDM has not been applied in this albacore (T. alalunga) stock, and it would be an alternative model necessary to provide some further information for this important international fishery filled the gaps in simple surplus production models and complex fully age-structured models.
Few publications about the continuous time type delay-difference model are available on the south Atlantic albacore fisheries (Su and Liu, 1998; Walters and Martell, 2004). The CTDDM provides a good performance of the dynamics of total numbers and biomass for age-structured populations. Standard D-DM has already been applied to fishes with long life cycles, shark-like fishes, and lobster. However, the discrete time formulation does not work well for populations with the consideration of continuous time delays of biological processes (Quinn and Deriso, 1999; Walters and Martell, 2004; Musick and Bonfil, 2005). The dynamics of CTDDM characterize some highly migratory cosmopolitan fish stocks, such as albacore (T. alalunga), which treat recruitment, growth, and mortality rates as all varying continuously over time (Walters and Martell, 2004, Walters, 2011). For such species, the continuous rate of recruitment, growth, and mortality rates as all varying continuously over time may be better to be treated by CTDDM. The CTDDM performs better than the discrete time models for stocks when consideration is given continuous time delays of biological processes (Walters, 2011). Thus, we apply a continuous time delay-difference type model for assessing the Atlantic albacore (T. alalunga) fishery.
In conclusion, the main objective of this study has been to provide an alternative method (a continuous time type model) to the southern Atlantic albacore (T. alalunga) stock assessment. The CTDDM was used to evaluate this albacore (T. alalunga) stock for the population parameters and biological reference points (BRPs), and provided a good fit to the catch data. The CTDDM performs better than the discrete time models for the stocks when consideration is given to continuous time delays of biological processes. Being a bridge between ASPM and SPM, it is an alternative model that is necessary for the appropriate stock assessments of the southern Atlantic albacore. A major value of this study is that it is the first time CTDDM be provided to assess the Atlantic albacore (T. alalunga) fishery. The method verified the MSY estimates used by ICCAT and diversified the models on this stock assessment. Estimated results were analyzed to verify the proposed methodology and provide reference information for the sustainable management of the southern Atlantic albacore (T. alalunga) stock, and we plan to conduct further study on the uncertainty of MSY with the perturbation histories of the data in the future.
5 ACKNOWLEDGEMENTWe thank Drs. JIAO Yan, SU Zhenming and two anonymous reviewers for comments on the manuscript. The first author would like to acknowledge the Chinese Scholarship Council (CSC) for the funding of his study in Virginia Polytechnic Institute and State University (USA).
| Chen Y, Jackson D A, Harvey H H, 1992. A comparison of von Bertalanffy and polynomial functions in modelling fish growth data. Canadian Journal of Fisheries and Aquatic Sciences, 49 (6) : 1228 –1235. Doi: 10.1139/f92-138 |
| Collette B B, McDowell J R, Graves J E, 2006. Phylogeny of recent billfishes (Xiphioidei). Bulletin of Marine Science, Fournier D A, Doonan I J. 1987. A length-based stock assessment method utilizing a generalized delaydifference model. Canadian Journal of Fisheries and Aquatic Sciences, 79 (3) : 455 –468. |
| Deriso R B, 1980. Harvesting strategies and parameter estimation for an age-structured model. Canadian Journal of Fisheries and Aquatic Sciences, 37 (2) : 268 –282. Doi: 10.1139/f80-034 |
| Dichmont C M, Punt A E, Deng A, et al, 2003. Application of a weekly delay-difference model to commercial catch and effort data for tiger prawns in Australia’s Northern Prawn Fishery. Fisheries Research, 65 (1-3) : 335 –350. Doi: 10.1016/j.fishres.2003.09.024 |
| Fournier D A, Doonan I J, 1987. A length-based stock assessment method utilizing a generalized delaydifference model. Canadian Journal of Fisheries and Aquatic Sciences, 44 (2) : 422 –437. Doi: 10.1139/f87-051 |
| Haddon M. 2011. Modelling and Quantitative Methods in Fisheries. 2nd edn. Chapman and Hall, New York. p.231-449. |
| Hall N G, 1997. Delay-difference model to estimate the catch of different categories of the western rock lobster(Panulirus cygnus) for the two stages of the annual fishing season. Marine and Freshwater Research, 48 (8) : 949 –958. Doi: 10.1071/MF97109 |
| Hilborn R, Walters C J. 1992. Quantitative fisheries stock assessment, choices, dynamics and uncertainty. Chapman and Hall, New York. 570p. |
| Hoggarth D D, Abeyasekera S, Arthur R I et al. 2006. Stock Assessment for Fishery Management:a Framework Guide to the Stock Assessment Tools of the Fisheries Management Science Programme. Food & Agriculture Org, Rome, Italy. 261p. |
| ICCAT (International Commission for the Conservation of Atlantic Tunas), 1999. Detailed report on albacore. Collective Volume of Scientific Papers, 49 (4) : 1 –92. |
| ICCAT (International Commission for the Conservation of Atlantic Tunas). 2011. Statistical Bulletin, Vol. 40.ICCAT, Madrid, Spain. 156p. |
| ICCAT (International Commission for the Conservation of Atlantic Tunas). 2012. Report of the 2011 ICCAT South Atlantic and Mediterranean albacore stock assessment sessions. Collective Volume of Scientific Papers, 68(2):387-491. |
| ICCAT (International Commission for the Conservation of Atlantic Tunas). 2013. Report of the 2013 ICCAT north and south Atlantic albacore data preparatory meeting.Madrid, Spain. 68p. |
| ISSF (International Seafood Sustainability Foundation). 2011.Stock status ratings:status of the world fisheries for tuna. 2011 Technical Report, McLean, Virginia, USA. 36p. |
| Jensen O P, Gilroy D J, Hogan Z, et al, 2009. Evaluating recreational fisheries for an endangered species:a case study of taimen, Huchotaimen, in Mongolia. Canadian Journal of Fisheries and Aquatic Sciences, 66 (11) : 1707 –1718. |
| Jiao Y, Reid K, Nudds T, 2010. Consideration of uncertainty in the design and use of harvest control rules. Scientia Marina, 74 (2) : 371 –384. Doi: 10.3989/scimar.2010.74n2 |
| Lee L K, Yeh S Y, 2007. Age and growth of south Atlantic albacore-A revision after the revelation of otolith daily ring counts. Collective Volume of Scientific Paper, 60 (2) : 443 –456. |
| Lee L K, Yeh S Y, 2008. Assessment of south Atlantic albacore resource based on 1959-2005 catch and effort statistics from ICCAT. Collective Volume of Scientific Paper, 62 (3) : 870 –883. |
| Liu Q, Xu B D, Ye Z J, Ren Y P, 2012. Growth and mortality of small yellow croaker (Larimichthys polyactis)inhabiting Haizhou bay of China. Journal of Ocean University of China, 11 (4) : 557 –561. Doi: 10.1007/s11802-012-2099-z |
| Musick J A, Bonfil R. 2005. Management techniques for elasmobranch fisheries. FAO, Rome. 474p. |
| Pallare P, Restrepo V, 2003. Use of delay-difference models to assess the India bigeye stock. IOCT Proceedings, 6 : 148 –150. |
| Penney A J, 1994. Morphometric relationships, annual catches and catch-at-size for South African caught South Atlantic albacore (Thunnus alalunga). Collective Volume of Scientific Paper, 42 (1) : 371 –382. |
| Prager M H. 2005. A stock production model incorporating covariates (Version.5) and auxiliary programs, CCFHR (NOAA) Miami laboratory document MIA-92/93-55.Beaufort Laboratory Document, BL-2004-01. |
| Quinn Ⅱ T J, Deriso R B. 1999. Quantitative Fish Dynamics.Oxford University Press, New York, USA. 542p. |
| Schnute J T, 1985. A general theory for analysis of catch and effort data. Canadian Journal of Fisheries and Aquatic Sciences, 42 (3) : 414 –429. Doi: 10.1139/f85-057 |
| Su Z M, Liu Q, 1998. A continuous Fox-form of the surplus production observation-error estimator. Fisheries Research, 34 (1) : 59 –76. Doi: 10.1016/S0165-7836(97)00066-0 |
| Su Z M, Peterman R M, 2012. Performance of a Bayesian state-space model of semelparous species for stockrecruitment data subject to measurement error. Ecological Modelling, 224 (1) : 76 –89. Doi: 10.1016/j.ecolmodel.2011.11.001 |
| Sun C L, Ehrhardt N M, Porch C E, et al, 2002. Analyses of yield and spawning stock biomass per recruit for the South Atlantic albacore (Thunnus alalunga). Fisheries Research, 56 (4) : 193 –204. |
| Viñas J, Bremer J R, Pla C, 2004. Inter-oceanic genetic differentiation among albacore (Thunnus alalunga)populations. Marine Biology, 145 (2) : 225 –232. |
| Walters C J, Martell S J D. 2004. Fisheries ecology and management. Princeton University Press, Princeton, New Jersey. 448p. |
| Walters C J. 2011. The continuous time Schnute-Deriso delaydifference model for age-structured population dynamics.http://www.fisheries.ubc.ca/biblio/author/2. Accessed on 2013-11. |
| Wang Y J, Liu Q, 2006. Comparison of Akaike information criterion (AIC) and Bayesian information criterion (BIC)in selection of stock-recruitment relationships. Fisheries Research, 77 (2) : 220 –225. Doi: 10.1016/j.fishres.2005.08.011 |
| Yeh S Y, Liu H C, Tsou T S. 1990. Assessment of the south Atlantic Albacore resource by using surplus production models, 1967-1988. ICCAT/SCRS/1989/044.Collective Volume of Scientific Paper31. p.236-240. |
| Zhang K, Chen Z Z, Huang Z R, Xu Y W, 2015a. Comparison of delay difference model and surplus production model applied to albacore (Thunnus alalunga) in the South Atlantic Ocean. South China Fisheries Science, 11 (3) : 1 –6. |
| Zhang K, Liu Q, Muhsan A K, 2015b. Application of a Delaydifference model for the stock assessment of southern Atlantic albacore (Thunnus alalunga). Journal of Ocean University of China, 14 (3) : 557 –563. Doi: 10.1007/s11802-015-2517-0 |