 2016, Vol. 34
Institute of Oceanology, Chinese Academy of Sciences
Article Information
- XU Jiajie(徐佳杰), JIANG Bo(姜波), CHAI Sanming(柴三明), HE Yuan(何渊), ZHU Jianyi(朱建一), SHEN Zonggen(沈宗根), SHEN Songdong(沈颂东)
- Complete nuclear ribosomal DNA sequence amplification and molecular analyses of Bangia (Bangiales, Rhodophyta) from China
- Chinese Journal of Oceanology and Limnology, 34(5): 1044-1053
- http://dx.doi.org/10.1007/s00343-016-5033-1
Article History
- Received Mar. 16, 2015
- accepted in principle Jun. 30, 2015
- accepted for publication Jul. 13, 2015


2 Department of Biology and Food Engineering, Changshu Institute of Technology, Changshu 215500, China;
3 Maternal and Child Health Hospital of Gansu Province, Lanzhou 730050, China
Bangia is a primitive red alga distributed throughout the world, with widespread marine populations present along northern and southern coastal areas (Sheath and Cole, 1984; Müller et al., 2003; Wang et al., 2008) and freshwater populations living in rivers, lakes, and streams in North America (Shea et al., 2014), Europe (Geesink, 1973; Gargiulo et al., 2001), China (Li et al., 2010a), and New Zealand (Broom et al., 2004). Marine Bangia populations live in the rocky intertidal zone where they are subjected to high wave action (Wang et al., 2008), while freshwater populations occur 5 to 15 cm above the waterline (Shea et al., 2014). Owing to their high nutrition and desirable flavor (Li et al., 2003), marine Bangia are harvested and traded in Putian, Fujian Province, China, and their cultivation and harvest will likely be an emerging industry in the near future (Wang et al., 2008).
Both marine and freshwater populations of Bangia are morphologically simple, having narrow gametophytic filaments about 40 μm in diameter with unbranched, uniseriate cells of the lower position, and multiseriate cells of the upper and middle position (Sutherland et al., 2011; Spitale et al., 2012). Many morphological features based on classical taxonomy have been used to separate species among the genus Bangia, including filament diameter, and length and pigmentation (Müller et al., 1998). However, it is difficult to distinguish species of Bangia owing to their similar cylindrical filaments; accordingly, their life history, reproductive system, and chromosome numbers have been used for differentiation. For example, Notoya and Iijima (2003) found that Bangia atropurpurea from Enoshima and Fukaura have different life histories, with the plants from Fukaura being completely dioecious with an apogamic reproductive subcycle. It has also been reported that monosporic plants contain three karyotypes with n=3, n=4, and 2n=6, while sexual plants have two karyotypes with n=3/2n=6 or n=4/2n=8 (Gargiulo et al., 1991; Müller et al., 2003). Nevertheless, karyotypes and reproductive systems are related to the range of distribution and seasonality. For instance, Cole et al. (1983) reported that the three-chromosome sexual population occurs from approximately 50°N northward, while the four-chromosome sexual population is found from approximately 54°N to the southernmost areas of British Columbia, with monosporagenesis strongly correlated to temperature, and gametogenesis closely correlated with photoperiod (Sheath et al., 1985).
Molecular tools have helped distinguish species of algae more accurately than morphological characteristics and karyotypes, while also explaining genetic relationships among algae (Coleman and Goff, 1991; Müller et al., 1998). Genetic markers commonly used in alga taxonomy include the small subunit ribosomal RNA gene (nrSSU) (Oliveira et al., 1995; Müller et al., 1998, 2001; Broom et al., 1999, 2004; Milstein and de Oliveira, 2005), large subunit ribosomal RNA gene (nrLSU) (Harper and Saunders, 2001a), internal transcribed spacer (ITS) region (Connell, 2000; Lin et al., 2013), intergenic spacer (IGS) region (Ki and Han, 2007; Li et al., 2010b; Parvaresh et al., 2014), chloroplast rbcL, rbcS, and Rubisco spacer (Müller et al., 1998, 2001; Farr et al., 2003; Ki and Han, 2007; Lin et al., 2013; Deng et al., 2015), and the cox2–3 gene spacer (Shea et al., 2014).
In eukaryotes, complete nuclear ribosomal DNA (nrDNA), also known as repeated ribosomal cistrons, is composed of the nrSSU, ITS region (ITS1, 5.8S rDNA, and ITS2), nrLSU, and IGS region (Fig. 1). The IGS region consists of nontranscribed spacer and external transcribed spacer regions that may be involved in transcriptional regulation (Ambrose and Crease, 2011; Pravaresh et al., 2013), and separate the contiguous transcription units, including nrSSU, 5.8S rDNA, and nrLSU. ITS1 is located between nrSSU and 5.8S rDNA, and ITS2 is located between 5.8S rDNA and nrLSU (Bianciardi et al., 2012). Because of the multicopy nature and diverse evolutionary rates of the different nrDNA regions, ribosomal DNA is often used as a molecular marker for phylogenetic studies (Yu et al., 2010). The IGS and two ITS regions evolve much more rapidly and possess greater variability than the conserved functional genes, nrSSU, 5.8S rDNA, and nrLSU, (Harper and Saunders, 2001b). Therefore, the ribosomal cistron coding regions are more valuable for phylogenetic comparisons at the family and order levels (Stiller and Waaland, 1993; Patwary et al., 1998; Harper and Saunders, 2001b), whereas the non-coding regions of the cistrons are valuable at the genus, species, and subspecies levels (Li et al., 2009, 2010b; Pravaresh et al., 2013).

|
| Figure 1 Elementary structure of the repeated ribosomal cistrons The coding regions (small-subunit (SSU), 5.8S, and large-subunit (LSU)) are indicated by the shaded frames and separated by ITS1 and ITS2. The contiguous transcription units are separated by the intergenic spacer (IGS). |
In this study, we acquired and analyzed the complete nrDNA sequences from a marine population of Bangia from Putian, Fujian Province, for the first time. We also used the nrSSU gene and the ITS region sequence data to assess Bangia diversity with 11 marine and freshwater populations from China.
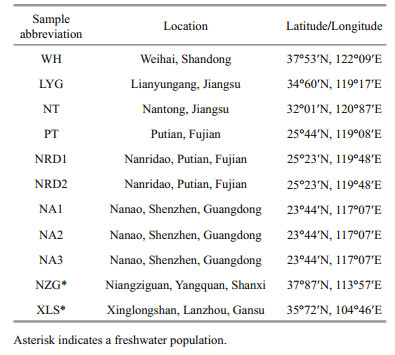
2 MATERIAL AND METHOD 2.1 Plant materialSamples of marine Bangia were collected from coastal areas in Shandong, Jiangsu, Fujian, and Guangdong Provinces, and freshwater samples were collected from Shanxi and Gansu Provinces. Information describing the marine and freshwater Bangia samples is provided in Table 1. The abbreviations indicate the sample codes according to the names of the location where they were collected, and the numbers are based on the longitude from north to south. The samples were cleaned of visible epiphytes with dd H2O, then air-dried under sterile conditions and stored at -20℃ for DNA analysis.
Stored samples were revived in dd H2O for several hours prior to total genomic DNA extraction, which was accomplished according to the hexadecyl trimethyl ammonium bromide (CTAB) method (Yang et al., 1999) with slight modification. The one modification was that the 60℃ mixed liquor incubation time was extended to 3 hours. The extracted genomic DNA was then stored at -20℃ until polymerase chain reaction (PCR) amplification.
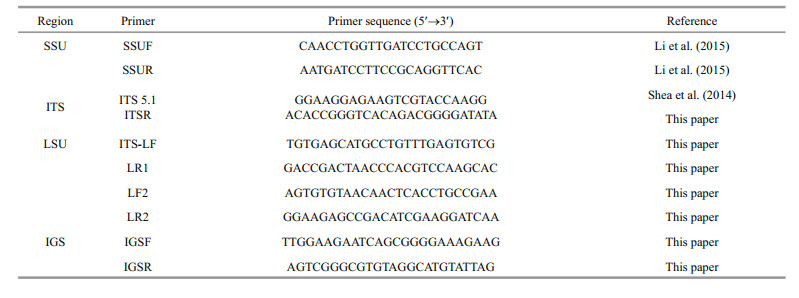
2.3 PCR amplificationOne of the repeated ribosomal cistrons was amplified using the primers listed in Table 2 and diagrammed in Fig. 2. The nrSSU gene was amplified using the primers SSUF and SSUR (Li et al., 2014, unpublished) (Fig. 2a). The ITS region (ITS1, 5.8S, and ITS2) was amplified using the previously described primers ITS 5.1 and ITSR (Fig. 2b) (Shea et al., 2014). We designed two pairs of primers by the software Primer Premier5 to amplify the nrLSU gene based on the sequences of the 5.8S rDNA of Bangia atropurpurea (KF733768) and the nrSSU gene of Pyropia yezoensis (KJ578748 (Fig. 2c, d). The primers of the IGS region were designed based on the sequences of the 3’end of the nrLSU gene and the 5’end of the nrSSU gene of Bangia from Putian, Fujian province (Fig. 2d). All primers were synthesized by Jinweizhi Biological Technology Co., Ltd. (Suzhou, China).

|
| Figure 2 Schematic diagrams of the primers used in this study The approximate position of the primers used for PCR amplification and the corresponding fragments are shown. a. fragment A is the region of the nrSSU gene amplified by primers SSUF and SSUR; b. fragment B represents the ITS region (ITS1, 5.8S, and ITS2) amplified by primers ITS 5.1 and ITSR; c. two overlapping fragments were amplified for the nrLSU gene: C (ITS-LF and LR1), D (LF2 and LR2); d. the IGS region (fragment E) amplified by primers IGSF and IGSR. |
The reaction volume for all amplifications was 50 μL, and the mixture consisted of 5 μL 10×LA Taq Buffer II (Mg2+ plus) (TAKARA Bio Inc., Otsu, Japan), 5 μL dNTP mixture (2.5 mmol/L each), 5 μL total genomic DNA (around 10 ng/μL), 1 μL of each primer (20 μmol/L), 0.5 μL LA Taq DNA polymerase (5 U/μL, TaKaRa, Dalian) and 32.5 μL dd H2O. The amplification protocol for fragment A (SSUF and SSUR) follows: 95℃ for 3 min, 30 cycles of 94℃ for 30 sec, 55℃ for 30 sec, and 72℃ for 3 min, with a final extension step at 72℃ for 7 min. The amplification protocol for fragment B (ITS 5.1 and ITSR), C (ITS-LF and LR1), and D (LF2 and LR2) follows: 95℃ for 3 min, 30 cycles of 94℃ for 30 sec, 55℃ for 30 sec, and 72℃ for 2 min, with a final extension step at 72℃ for 7 min. The amplification protocol for fragment E (IGSF and IGSR) follows: 95℃ for 3 min, 35 cycles of 94℃ for 30 sec, 55℃ for 30 sec, and 72℃ for 6 min, with a final extension step at 72℃ for 7 min.
The PCR products were electrophoresed on 1% agarose gels in 1× TAE buffer with ethidium bromide, after which they were subject to UV visualization and photographed using the Bio Imaging System (Pharmacia Biotech, Sweden). The target fragments were extracted from gel slices using a TaKaRa Minibest Agarose Gel DNA Extraction Kit (Japan, Ver.2.0), after which the purified fragments (Fragment A, B, C, and D) were ligated into the pEASY-T3 Cloning Vectors (TransGen Biotech Co. Ltd., Beijing, China). The ligation reaction volume was 1 μL pEASY-T3 Cloning Vectors and 3–5 μL purified DNA fragments. The purified Fragment E was ligated into the pGEM-T Easy Cloning Vectors (Promega Biotech Co. Ltd., Beijing, China) according to the manufacturer’s protocol. After the ligation reactions, Trans1-T1 Phage Resistant Chemically Competent Cell (Beijing TransGen Biotech Co. Ltd.) transformation was performed according to the manufacturer’s protocol. The transformed cells were spread on the Luria-Bertani agar plate containing ampicillin (50 mmol/L), X-gal (20 mmol/L), and isopropyl β-D-1-thiogalactopyranoside (IPTG) (12 mmol/L), and then cultured at 37℃ overnight. Finally, white bacterial colonies were chosen to identify those recombinants successfully ligated and transformed, according to the pEASY-T3 Cloning Kit (TransGen Biotech Co. Ltd., Beijing, China) instructions.
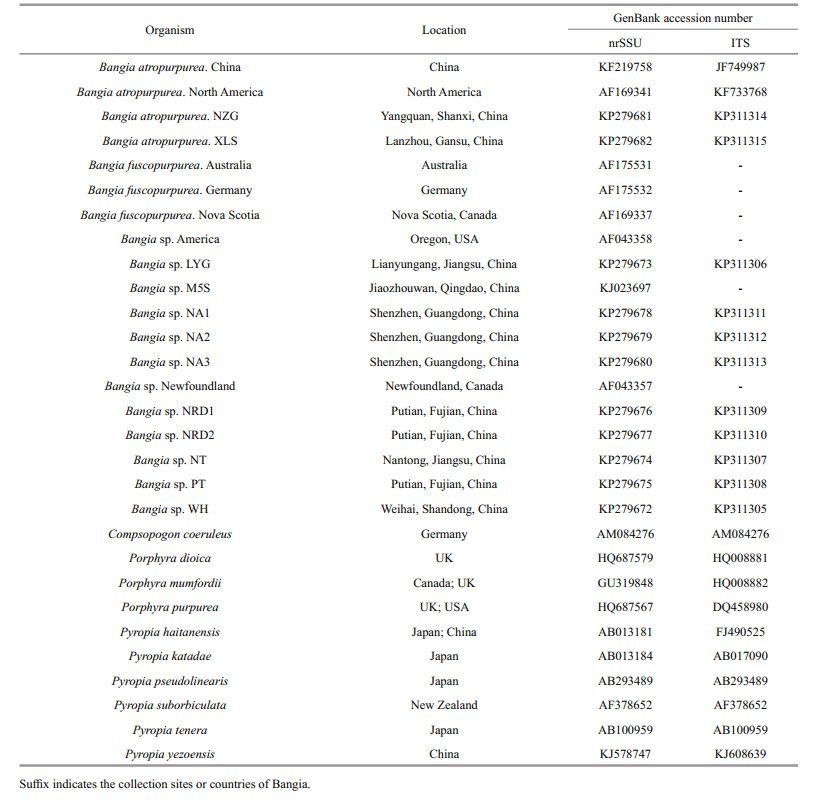
2.4 Sequencing and analysisPositive recombinant colonies were sequenced by Suzhou Jinweizhi Biological Technology Co. Ltd. (China). The sequences obtained were confirmed by comparison with those available at the National Center for Biotechnology Information (NCBI) GenBank database (http://www.ncbi.nlm.nih.gov/ GenBank), and then aligned using ClustalX v. 2.0 (Larkin et al., 2007), with some minor manual adjustmens (Deng et al., 2015). The nrSSU gene and 5.8S rDNA sequence pairwise distances for all samples were calculated using MEGA v. 6.06 (Tamura et al., 2013), with default parameters. The nrSSU gene and the ITS region of all samples were concatenated, aligned with ClustalX, then used to infer a phylogenetic tree containing 20 taxa from GenBank, specifying Compsopogon coeruleus (Balbis ex C. Agardh) as the outgroup (Hu et al., 2007). The maximum likelihood tree was generated with the default parameters (Statistical method is maximum likelihood, test of phylogeny is bootstrap method, substitutions type is nucleotide, model is jukes-cantor model, rates among sites are uniform rates, Gaps/Missing Data treatment is complete deletion.) in MEGA v. 6.06 (Tamura et al., 2013).
3 RESULT 3.1 Length of nrDNAThe nrSSU gene was 1 839 bp without introns; with introns the nrSSU gene of the marine populations ranged from 2 812 to 2 947 bp in length, and those of the freshwater populations were all 2 365 bp in length. The ITS regions of the marine populations ranged in length from 812 to 1 260 bp, while those of the freshwater populations were 1 035–1 036 bp in length. The nrLSU gene was 3 751 bp long, and the IGS region was 4 613 bp long, from the one marine sample in which we sequenced those regions; therefore, the total nrDNA length is approximately 13 kb. The GenBank accession numbers for our newly sequenced nrSSU genes are KP279672–KP279682, while those for the ITS regions are KP311305–KP311315.
3.2 nrSSUWe successfully sequenced the nrSSU genes from 11 Bangia samples from Chinese coastal areas and freshwater environments. Additionally, the nrSSU gene boundary was confirmed by comparison with P. yezoensis (KJ578747). The nrSSU gene exons were 1 839 bp in the marine samples, except for the marine population Weihai (WH) collected from Weihai, Shandong Provinces, which was 1 821 bp long. The exons of the freshwater samples were all 1 834 bp. The nrSSU genes of the marine samples contained two introns, an upstream intron of 498 bp, and a downstream intron ranging in size from 605 to 610 bp. However, the upstream and downstream introns of the WH marine sample were 467 bp and 524 bp, respectively. The nrSSU genes of the freshwater samples contained only one upstream intron of 531 bp. Detailed information is provided in Table 3, and Fig. 3 displays the exons and introns of the nrSSU genes for all samples. The schematic diagrams indicate that the exon sequences of the locations where the introns are inserted were the same in different samples, but the sequence of the two terminals of the introns differed among the three types.


|
| Figure 3 Schematic diagrams of the exons and introns of the nrSSU genes for all samples a. marine sample WH; b. marine samples LYG, NT, PT, NRD1, NRD2, NA1, NA2 and NA3; c. freshwater samples NZG and XLS. |
Marine samples Lianyungang (LYG), Nantong (NT), Putian (PT), Nanridao1 (NRD1), Nanridao2 (NRD2), Nanao1 (NA1), Nanao2 (NA2), and Nanao3 (NA3) had close pairwise distances for the nrSSU gene without introns (0.001 to 0.003), with PT and NA1 having identical sequences. Marine sample WH showed 0.063–0.065 sequence divergence from the other marine samples investigated in this study. The freshwater samples grouped together with short distances between them (0.001 sequence divergence), and were 0.097 to 0.126 diverged from the marine samples studied (Table 4).

|
The ITS region was successfully sequenced in the 11 samples, and the boundaries of the region were confirmed by comparison with the nrSSU and nrLSU gene region of P. yezoensis (KJ608639 and KJ578748, respectively). The ITS region in sample WH was 812-bp long, those of the other marine samples ranged from 1 252 to 1 260 bp, and those of the freshwater samples ranged from 1 035 bp to 1 036 bp. The ITS region of all samples contained 5.8S rDNA 158-bp long. Sample WH was 0.129 divergent from the other marine samples, based on pairwise 5.8S rDNA sequence distances, and 0.120 divergent from the freshwater samples. The other marine samples showed 0.198 sequence divergence from the freshwater samples. However, marine samples other than WH showed low divergence (0–0.006) from each other, with LYG, PT, NRD (1, 2), NA (1, 2, 3) and other freshwater samples having identical sequences (Table 4).
3.4 Phylogenetic tree analysisA maximum likelihood phylogenetic tree based on a concatenated nrSSU gene and ITS region sequence dataset is presented in Fig. 4; collection information and GenBank accession numbers are listed in Table 6. We were only able to select 18 other taxa (including six without ITS regions) to compare with our samples, because research of the ITS region in Bangiales is quite limited. Compsopogon coeruleus (Balbis ex C. Agardh) was designated as the outgroup for the analysis. The marine and freshwater Bangia samples diverged into three main clades. Specifically, marine samples LYG, NT, PT, NRD1, NRD2, NA1, NA2. and NA3 grouped together with populations from the United States, as well as those of Newfoundland and Nova Scotia, Canada, with 99% bootstrap support. The freshwater samples NZG and XLS clustered with one North American freshwater sample and one Chinese freshwater sample (100% bootstrap support). The marine WH sample joined a clade containing populations from China, Germany, and Australia, with a bootstrap value of 85%.

|
| Figure 4 Maximum likelihood phylogenetic tree of Bangiales taxa based on the concatenated nrSSU gene and ITS region sequence datasets The numbers around the branches indicate bootstrap support. Asterisks indicate samples from this study. |
Our Bangia nrDNA samples are approximately 13 kb in length, similar to previous studies (Appels and Honeycutt, 1986; Li et al., 2009; Yu et al., 2010).
The nrSSU gene is widely used in the analysis of Bangia and Porphyra phylogeny. Broom et al. (1999) reported that the Porphyra/Bangia clade is divided into three distinct groups, and a few years later they separated 123 samples of the red algal genus Bangia into five clades based on nrSSU gene sequence data (Broom et al., 2004). The nrSSU genes of Bangia spp. sequenced in the present study range from 1 821 bp to 1 839 bp in length (without introns). The sequences assort into three distinct clusters, both by distance and maximum likelihood analyses, with quite small intraclade sequence divergences and medium levels of divergence between the three clades.
The nrSSU gene of the Porphyra/Bangia complex usually contains two introns. For example, Milstein and de Oliveira (2005) found that Porphyra capensis and Porphyra sp. Baleia has two introns (intron 516 and intron 1506); however, Porphyra drewiana only contains intron 1506. The exonic SSU rDNA region sequences containing introns 516 and 1506 are the same as those observed in our study, but the insertion sites differ. Our marine samples all contain two introns, but the freshwater samples only contain the one upstream intron. The downstream intron is typical of group I structure (Cech, 1988), but the upstream is not. Many studies have shown that the ITS1 region has high divergence, even within species (Kunimoto et al., 1999; Broom et al., 2002). The ITS region contains non-transcribed spacers (ITS1 and ITS2) that have redundant variation sites, making it an appropriate tool for the identification of intraspecies genetic diversity and classification (Li et al., 2009, 2010b). The ITS1 and ITS2 sequences of all samples investigated in the present study differ greatly among marine and freshwater samples, as well as between sample WH and the other marine samples (data not shown). However, ITS1 and ITS2 show high similarity among the marine samples (except WH), as well as among the freshwater samples. Shea et al. (2014) reported that all of their B. atropurpurea collections from the Great Lakes had identical partial ITS region sequences.
The nrSSU gene and 5.8S rDNA sequence distance data, the quantity of introns in the nrSSU gene between the various samples, and the large differences between the ITS1 and ITS2 sequences all demonstrate that the marine species are quite different than the freshwater species in China. However, the marine WH sample differs greatly from the other marine samples in China, based on pairwise nrSSU gene and 5.8S rDNA sequence distance data, as well as its ITS1 and ITS2 sequences.
|
Molecular phylogenies have been combined with morphological and cytological data to analyze Bangiales (Rhodophyta) taxonomy. This has resulted in the identification of three new genera: Pseudobangia, Dione, and Minerva (Sutherland et al., 2011). These phylogenies have been primarily based on combined nrSSU and rbcL gene datasets; for example, Deng et al. (2015) researched Bangia spp. collected in China based on a combined nrSSU and rbcL gene dataset. Because the data of the nrLSU and IGS are lacking in GenBank, we reconstructed a phylogeny based on the combined nrSSU and ITS regions. In our phylogenetic tree, 11 samples divide into three clades. Specifically, marine samples LYG, NT, PT, NRD (1, 2) and NA (1, 2, 3) group together with populations from the United States and Canada to form our “Bangia” 2 clade, while sample WH clusters away from the other marine samples collected in our study, and instead clusters with freshwater populations from China, Germany, and Australia in our “Bangia” 1 clade. Moreover, freshwater samples NZG and XLS cluster with two freshwater Bangia spp. from North America and China into Bangia proper. Therefore, based on our nrSSU and 5.8S rDNA gene pairwise distances, and on our phylogenetic tree, two marine Bangia species, and one freshwater Bangia species may exist in China.
5 CONCLUSIONThere are at least three species of Bangia in China, according to our sequence and the phylogenetic analyses. We do note that our representation of Bangia spp. only based on the nrSSU gene and the ITS regions of 11 samples is quite limited. Nevertheless, the results of this study provide useful information describing the relationships among partial Bangia populations in China. Future studies should be conducted to resolve the relationships among Bangiaceae in China, with wider sampling of freshwater Bangia.
| Ambrose C D, Crease T J, 2011. Evolution of the nuclear ribosomal DNA intergenic spacer in four species of the Daphnia pulex complex. BMC Genet., 12 : 13 . |
| Appels R, Honeycutt R L. 1986. Evolution over a billion years.In:Dutta S K ed. DNA Systematics, vol Ⅲ:Plants. CRC Press, Boca Raton, Florida. p.81-135. |
| Bianciardi A, Boschi M, Swanson E E, Belloni M, Robbins L G, 2012. Ribosomal DNA organization before and after magnification in Drosophila melanogaster. Genetics, 191 (3) : 703 –723. Doi: 10.1534/genetics.112.140335 |
| Broom J E, Jones W A, Hill D F, Knight G A, Nelson W A, 1999. Species recognition in New Zealand Porphyra using 18S rDNA sequencing. Journal of Applied Phycology, 11 (5) : 421 –428. Doi: 10.1023/A:1008162825908 |
| Broom J E S, Farr T J, Nelson W A, 2004. Phylogeny of the Bangia flora of New Zealand suggests a southern origin for Porphyra and Bangia (Bangiales, Rhodophyta). Mol.Phylogenet. Evol., 3 (1197) : 1207 . |
| Broom J E S, Nelson W A, Yarish C, Jones W A, Aguilar Rosas R, Aguilar Rosas L E, 2002. A reassessment of the taxonomic status of Porphyra suborbiculata, Porphyra carolinensis and Porphyra liliiputiana (Bangiales, Rholophyta) based on molecular and morphological data. European Journal of Phycology, 37 (2) : 227 –235. Doi: 10.1017/S0967026202003566 |
| Cech T R, 1988. Conserved sequences and structures of group I introns:building an active site for RNA catalysis-a review. Gene, 73 (2) : 259 –271. Doi: 10.1016/0378-1119(88)90492-1 |
| Cole K M, Hymes B J, Sheath R G, 1983. Karyotypes and reproductive seasonality of the genus Bangia(Rhodophyta) in British Columbia, Canada. Journal of Phycology, 19 (2) : 136 –145. Doi: 10.1111/jpy.1983.19.issue-2 |
| Coleman A W, Goff L J, 1991. DNA analysis of eukaryotic algal species. Journal of Phycology, 27 (4) : 463 –473. Doi: 10.1111/j.0022-3646.1991.00463.x |
| Connell L B, 2000. Nuclear ITS region of the alga Heterosigma akashiwo (Chromophyta:Raphidophyceae) is identical in isolates from Atlantic and Pacific basins. Marine Biology, 136 (6) : 953 –960. Doi: 10.1007/s002270000314 |
| Deng Y Y, Lu Q Q, Shen S D, Shen Z G, Tian C C, Zhu J Y, 2015. Cytological observations and rbcL, nrSSU gene sequence analyses of filamentous Bangiales (Rhodophyta)from China. Journal of Applied Phycology, 27 (3) : 1355 –1363. Doi: 10.1007/s10811-014-0419-y |
| Farr T J, Nelson W A, Broom J E S, 2003. A challenge to the taxonomy of Porphyra in Australia:the New Zealand red alga Porphyra rakiura (Bangiales, Rhodophyta) occurs in southern Australia, and is distinct from P. lucasii.Australian Systematic Botany, 16 (5) : 569 –575. Doi: 10.1071/SB02025 |
| Gargiulo G M, De Masi F, Tripodi G, 1991. Karyology of Bangia atropurpurea (Rhodophyta, Bangiales) from Mediterranean and Northeastern Atlantic populations. Journal of Phycology, 27 (2) : 306 –309. Doi: 10.1111/j.0022-3646.1991.00306.x |
| Gargiulo G M, Genovese G, Morabrro M, Culoso F, De Masi F, 2001. Sexual and asexual reproduction in a freshwater population of Bangia atropurpurea (Bangiales, Rhodophyta) from eastern Sicily (Italy). Phycologia, 40 (1) : 88 –96. Doi: 10.2216/i0031-8884-40-1-88.1 |
| Geesink R, 1973. Experimental investigations on marine and freshwater Bangia (Rhodophyta) from the Netherlands. J.Exp. Mar. Biol. Ecol., 11 (3) : 239 –247. Doi: 10.1016/0022-0981(73)90024-5 |
| Harper J T, Saunders G W, 2001a. Molecular systematics of the Florideophyceae (Rhodophyta) using nuclear large and small subunit rDNA sequence data. Journal of Phycology, 37 (6) : 1073 –1082. Doi: 10.1111/jpy.2001.37.issue-6 |
| Harper J T, Saunders G W, 2001b. The application of sequences of the ribosomal cistron to the systematics and classification of the florideophyte red algae(Florideophyceae, Rhodophyta). Cah. Biol. Mar., 42 (1-2) : 25 –38. |
| Hu Z M, He Y J, Xia P, Duan D L, 2007. Molecular identification of Chinese cultivated Porphyra (Bangiaceae, Rhodophyta)based on the rDNA internal transcribed spacer-1 sequence and random amplified polymorphic DNA markers. Marine Biology Research, 3 (1) : 20 –28. Doi: 10.1080/17451000601070863 |
| Ki J S, Han M S, 2007. Nuclear rDNA and chloroplast rbcL, rbcS and IGS sequence data, and their implications from the Japanese, Korean, and North American harmful algae, Heterosigma akashiwo (Raphidophyceae). Environmental Research, 103 (3) : 299 –304. Doi: 10.1016/j.envres.2006.08.014 |
| Kunimoto M, Kito H, Kaminishi Y, Mizukami Y, Murase N, 1999. Molecular divergence of the SSU rRNA gene and internal transcribed spacer 1 in Porphyra yezoensis(Rhodophyta). Journal of Applied Phycology, 11 (2) : 211 –216. Doi: 10.1023/A:1008023525847 |
| Larkin M A, Blackshields G, Brown N P, Chenna R, McGettigan P A, McWilliam H, Valentin F, Wallace I M, Wilm A, Lopez R, Thompson J D, Gibson T J, Higgins D G, 2007. Clustal W and Clustal X version 2. 0.Bioinformatics, 23 (21) : 2947 –2948. Doi: 10.1093/bioinformatics/btm404 |
| Li F, Feng J, Xie S L, 2010a. Sequencing and analysis of ITS sequences of Bangia atropurpurea. Agricultural science & Technology, 11 (9-10) : 45 –46. |
| Li S J, Ma J H, Ji H D, Xie E Y, 2003. Evaluation of nutrient components of Bangia sp. Acta Oceanologica Sinica, 22 (1) : 89 –95. |
| Li X C, Xu J J, He Y, Shen S D, Zhu J Y, Shen Z G, 2015. The complete nuclear ribosomal DNA (nrDNA) cistron sequence of Pyropia yezoensis (Bangiales, Rhodophyta). Journal of Applied Phycology, 28 (1) : 663 –669. |
| Li Y Y, Shen S D, He L H, Xu P, Lu S, 2010b. Sequence analysis of rDNA intergenic spacer (IGS) of Porphyra haitanensis. Journal of Applied Phycology, 22 (2) : 187 –193. Doi: 10.1007/s10811-009-9441-x |
| Li Y Y, Shen S D, He L H, Xu P, Wang G C, 2009. Sequence analysis of the ITS region and 5. 8S rDNA of Porphyra haitanensis. Chinese Journal of Oceanology and Limnology, 27 (3) : 493 –501. Doi: 10.1007/s00343-009-9168-1 |
| Lin Z H, Shen S D, Chen W Z, Li H H, 2013. Phylogenetic analyses of four species of Ulva and Monostroma grevillei using ITS, rbcL and 18S rDNA sequence data. Chinese Journal of Oceanology and Limnology, 31 (1) : 97 –105. Doi: 10.1007/s00343-013-2069-3 |
| Milstein D, de Oliveira M C, 2005. Molecular phylogeny of Bangiales (Rhodophyta) based on small subunit rDNA sequencing:emphasis on Brazilian Porphyra species. Phycologia, 44 (2) : 212 –221. Doi: 10.2216/0031-8884(2005)44[212:MPOBRB]2.0.CO;2 |
| Müller K M, Cole K M, Sheath R G, 2003. Systematics of Bangia (Bangiales, Rhodophyta) in North America. Ⅱ.Biogeographical trends in karyology:chromosome numbers and linkage with gene sequence phylogenetic trees. Phycologia, 42 (3) : 209 –219. Doi: 10.2216/i0031-8884-42-3-209.1 |
| Müller K M, Olivera M C, Sheath R G, Bhattacharya D, 2001. Ribosomal DNA phylogeny of the Bangiophycidae(Rhodophyta) and the origin of secondary plastids. American Journal of Botany, 88 (8) : 1390 –1400. Doi: 10.2307/3558445 |
| Müller K M, Sheath R G, Vis M L, Crease T J, Cole K M, 1998. Biogeography and systematics of Bangia(Bangiales, Rhodophyta) based on the Rubisco spacer, rbcL gene and 18S rRNA gene sequences and morphometric analyses. I. North America. Phycologia, 37 (3) : 195 –207. Doi: 10.2216/i0031-8884-37-3-195.1 |
| Notoya M, Iijima N, 2003. Life history and sexuality of archeospore and apogamy of Bangia atropurpurea (Roth)Lyngbye (Bangiales, Rhodophyta) from Fukaura and Enoshima, Japan. Fisheries Science, 69 (4) : 799 –805. Doi: 10.1046/j.1444-2906.2003.00689.x |
| Oliveira M C, Kurniawan J, Bird C J, Rice E L, Murphy C A, Singh R K, Gutell R R, Ragan M A, 1995. A preliminary investigation of the order Bangiales (Bangiophycidae, Rhodophyta) based on sequences of nuclear small-subunit ribosomal RNA genes. Phycological Research, 43 (2) : 71 –79. Doi: 10.1111/pre.1995.43.issue-2 |
| Parvaresh M, Talebi M, Sayed-Tabatabaei B E, 2014. Molecular characterization of ribosomal DNA intergenic spacer (IGS) region in pomegranate (Punica granatum L. ). Plant Syst. Evol., 330 (5) : 899 –908. |
| Patwary M U, Sensen C W, Mackay R M, van der Meer J P, 1998. Nucleotide sequences of small-subunit and internal transcribed spacer regions of nuclear rRNA genes support the autonomy of some genera of the gelidiales(Rhodophyta). Journal of Phycology, 34 (2) : 299 –305. Doi: 10.1046/j.1529-8817.1998.340299.x |
| Shea T B, Sheath R G, Chhun A, Vis M L, Chiasson W B, Müller K M, 2014. Distribution, seasonality and putative origin of the non-native red alga Bangia atropurpurea(Bangiales, Rhodophyta) in the Laurentian Great Lakes. J. Great Lakes Res., 40 (1) : 27 –34. Doi: 10.1016/j.jglr.2014.01.004 |
| Sheath R G, Cole K M, 1984. Systematics of Bangia(Rhodophyta) in North America I. Biogeographic trends in morphology. Phycologia, 23 (3) : 383 –396. |
| Sheath R G, VanAlstyne K L, Cole K M, 1985. Distribution, seasonality and reproductive phenology of Bangia atropurpurea (Rhodophyta) in Rhode Island, U. S. A.Journal of Phycology, 21 (2) : 297 –303. |
| Spitale D, Scalfi A, Angeli N, Cantonati M, 2012. Fine-scale spatial patterns of mature and immature filaments and bioorganic compounds of the Rhodophyte Bangia atropurpurea in the supra-and eulittoral zones of a large lake. Journal of Phycology, 48 (6) : 1530 –1534. Doi: 10.1111/j.1529-8817.2012.01180.x |
| Stiller J M, Waaland J R, 1993. Molecular analysis reveals cryptic diversity in Porphyra (Rhodophyta). Journal of Phycology, 29 (4) : 506 –517. Doi: 10.1111/jpy.1993.29.issue-4 |
| Sutherland J E, Lindatrom S C, Nelson W A, Brodie J, Lynch M D J, Hwang M S, Choi H G, Miyata M, Kikuchi N, Oliveira M C, Farr T, Neefus C, Mols-Mortensen A, Milstein D, Müller K M, 2011. A new look at an ancient order:generic revision of the Bangiales (Rhodophyta). Journal of Phycology, 47 (5) : 1131 –1151. Doi: 10.1111/j.1529-8817.2011.01052.x |
| Tamura K, Stecher G, Peterson D, Filipski A, Kumar S, 2013. MEGA 6:molecular evolutionary genetics analysis version 6.0. Mol. Biol. Evol., 30 (12) : 2725 –2729. Doi: 10.1093/molbev/mst197 |
| Wang W J, Zhu J Y, Xu P, Xu J R, Lin X Z, Huang C K, Song W L, Peng G, Wang G C, 2008. Characterization of the life history of Bangia fuscopurpurea (Bangiaceae, Rhodophyta) in connection with its cultivation in China. Aquaculture, 278 (1-4) : 101 –109. Doi: 10.1016/j.aquaculture.2008.01.008 |
| Yang J, Wang Q, Liu M H, An L J, 1999. A simple method for extracting total DNA of seaweeds. Biotechnol, 9 (4) : 39 –42. |
| Yu J H, Li H X, Ge X P, Li J L, Tang Y K, 2010. Characteristics analysis of complete ribosomal DNA sequence in Chinese mitten crab (Eriocheir sinensis). Journal of Fisheries of China, 34 (5) : 696 –703. Doi: 10.3724/SP.J.1231.2010.06659 |