Institute of Oceanology, Chinese Academy of Sciences
Article Information
- ZHANG Yanwei(张艳伟), XU Huiping(许惠平), QIN Rufu(覃如府), XU Changwei(徐昌伟), FAN Daidu(范代读)
- Characteristics of turbulent kinetic energy dissipation rate and turbidity near the coast of East China Sea
- Chinese Journal of Oceanology and Limnology, 34(5): 1134-1142
- http://dx.doi.org/10.1007/s00343-016-4270-7
Article History
- Received Nov. 13, 2014
- accepted in principle Apr. 27, 2015
- accepted for publication Jul. 12, 2015
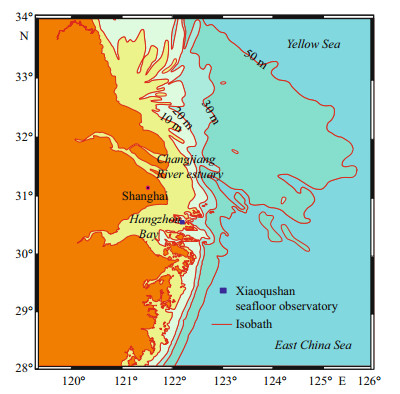
The coastal region of the East China Sea (ECS) is shallow with a large number of islands and variable topography (Fig. 1). This results in complex nearbottom hydrodynamic processes (Shi, 2010; Ma et al., 2013). Besides the topography, tides and wind are important in driving changes in the near-bottom hydrodynamic environment (Wang, 2002; Werner et al., 2003), which is the key mechanism controlling the distribution and transport of sediment near the bottom (Ulker et al., 2009). Wang et al. (2000) summarized the methods for computing the length of the bottom boundary layer and sediment transport under different conditions, and argued that the ocean mixing in the bottom boundary layer is the key to clarifying the sediment transport processes. It has been suggested that turbulent mixing plays an important role in controlling the resuspension and flocculation of sediment and particles in the water column (Wei et al., 2006). According to the results from three-dimensional sediment transport modeling, the combined result of wind and tidal influence is enhanced shear stress and turbulent mixing in the bottom boundary layer, which strengthens sediment resuspension (Ma and Madsen, 2012). Therefore, the parameters of ocean turbulent mixing are essential in exploring the sediment distribution in the bottom boundary layer.
|
| Figure 1 Topography of the study area (after Zhang et al., 2011) The blue square shows the location of the seafloor observatory near Xiaoqushan Island. |
How the influence of the suspended sediment concentration affects the bottom boundary layer is also an open question (Dyer et al., 2004). Gust (1976) suggested that the turbulence structure in the bottom boundary layer would change under high suspended sediment concentrations, which was also accompanied by weaker current shear stress. Considering the large amount of sand input by the Changjiang (Yangtze) River, the suspended sediment concentration in the ECS coast is very high (Gao and Wang, 2008). Based on long-term continuous measurements on the ECS shelf, it was found that the high turbidity decreased the shear stress near the bottom (Wang and Gao, 2010). However, because of the sparse measurements on turbulent mixing near the bottom boundary layer, the relation between the dissipation rate of turbulent kinetic energy (TKE) and turbidity in the ECS has not been investigated.
With the development of the technology in ocean mixing observation, several methods can be used to measure the long-term continuous TKE dissipation rate. One such method is based on the high-resolution current velocity fluctuations observed by acoustic Doppler velocimeter (ADV) (Liu et al., 2009; Lozovatsky et al., 2012). Fast temperature sensors with a 120-Hz recording resolution can also provide an estimate of the TKE dissipation rate (Moum and Nash, 2009; Zhang and Moum, 2010). However, both of these instruments only sample the TKE dissipation rate for one depth once. To obtain temporal and spatial profiles of the TKE dissipation rate, the structure function method is used in this study. The technique, which is based on the structure function method, was first used to estimate the mixing parameters in radar meteorology (Lhermitte, 1968). Wiles et al. (2006) adopted this technique for the estimation of TKE dissipation rate profiles in the marine environment using a standard acoustic Doppler current profiler (ADCP) in Red Wharf Bay in the Irish Sea. They found a good agreement between the result based on the structure function method and the estimate based on a freefall microstructure profiler. Here we use this technique to estimate the dissipation rate of TKE based on year-long ADCP data obtained from a seafloor observatory in the ECS.
We focus on the relationship between the dissipation rate of TKE and the near-bottom turbidity, especially under conditions with strong wind and different tidal periods. The observations and data are introduced in Section 2. We briefly describe the structure function method in Section 3. The characteristics of the current velocity and turbidity are presented in Section 4, with the correlation analysis between the dissipation rate of TKE and turbidity; and the conclusions are in Section 5.
2 SEAFLOOR OBSERVATORY AND HYDROLOGY MEASUREMENTSThe experimental station of seafloor observatory, located near Xiaoqushan Island (30°31′37″N, 122°14′41″E) off the coast of the ECS, is the first long-term seafloor observatory built by China (Fig. 1) (Zhang et al., 2011). The average water depth of this location is approximately 13.5 m. This seafloor observatory came into operation on 20 April, 2009. The real-time data are sent directly to the platform through a cable and transmitted via wireless CDMA (Code Division Multiple Access) to the receiver at the State Key Laboratory of Marine Geology of Tongji University (Zhang et al., 2011). Here, we use two of the instruments deployed on the observatory to investigate the relations between turbulent mixing and turbidity: 1) an upward-looking 1 200 kHz ADCP, recording current velocities every 2 seconds at a 0.25-m-bin vertical resolution, enabling a measurement ranging from 1 m above the bottom boundary to the sea surface; and 2) a conductivitytemperature-depth (CTD) detector equipped with a turbidity probe recording temperature, salinity, depth, and turbidity every 1 minute at a depth of 0.8 m above the bottom boundary. Furthermore, wind speed with a 1-minute time resolution was provided by the local weather station approximately 60 m away from the seafloor observatory. The data used in this paper ranges from November 2009 to August 2010.
The unit used for the turbidity of seawater in this study is NTU (nephelometric turbidity units), which represents the optical intensity of the light reflected 90 degrees to the incident beam. Typically, the greater the turbidity data, the higher the suspended sediment concentration of the seawater (Gao et al., 2011). However, because of the limit of the water sample, the turbidity data were not calibrated into the real suspended sediment concentration in this study.
3 METHOD FOR ESTIMATING DISSIPATION RATE OF TKEThe structure function S(z, r) is defined as the mean-square of the current velocity fluctuation difference between two positions separated by a distance r, that is,
 (1)
(1)where z is the depth, and v’ is the current velocity with the temporal mean removed. Based on the Taylor cascade theory, the characteristic length-and velocityscales of turbulent fluid in the inertial subrange can be related by the following equation (Gargett, 1999),
 (2)
(2)where Cν2 is a constant, which is 2.1 for the marine environment (Wiles et al., 2006).
According to Gargett (1999) and Wiles et al. (2006), Eq.2 is valid given lk < r < lo, where lk is the Kolmogorov dissipation scale and lo is the Ozmidov vertical scale of the largest energy-containing eddies. Similar to the dynamic environment in Red Wharf Bay, the region near Xiaoqushan Island has weak stratification (Wang and Gao, 2010) and a high dissipation rate greater than 10-6 W/kg, which is much higher than the mean values in the open region in the East China Sea (Zhou et al., 2005). The low limit dissipation rate of 10-6 W/kg leads to the Kolmogorov dissipation scale of 5×10⁻³ m. The upper end limitation on r within the inertial subrange is determined by the typical Ozmidov scale in a weakly stratified tidal channel with a value of 5 m (Stansfield, 2001). By comparing with the results documented in Wiles et al. (2006), we set r=4 m in our study.
To ensure that the averaging period is long enough to provide statistical reliability and short enough to present the stationary feature of the turbulent fluid, a 10-minute averaging period is used to calculate the velocity difference for each given depth. For a given depth z, the velocity differences between the two locations at z and z+r can be calculated; and then squared and averaged over 10 minutes to obtain S(z, r) from Eq.1. Moreover, different current velocity components obtained from different ADCP beams are used to calculate S(z, r). The mean squared velocity difference S(z, r) calculated from the measurements is then fitted to the theoretical values, which can be calculated from Eq.2. The optimal value for ɛ can be obtained by the least square fitting over inertial subrange, i.e., 5×10⁻³ m < r < 4 m.
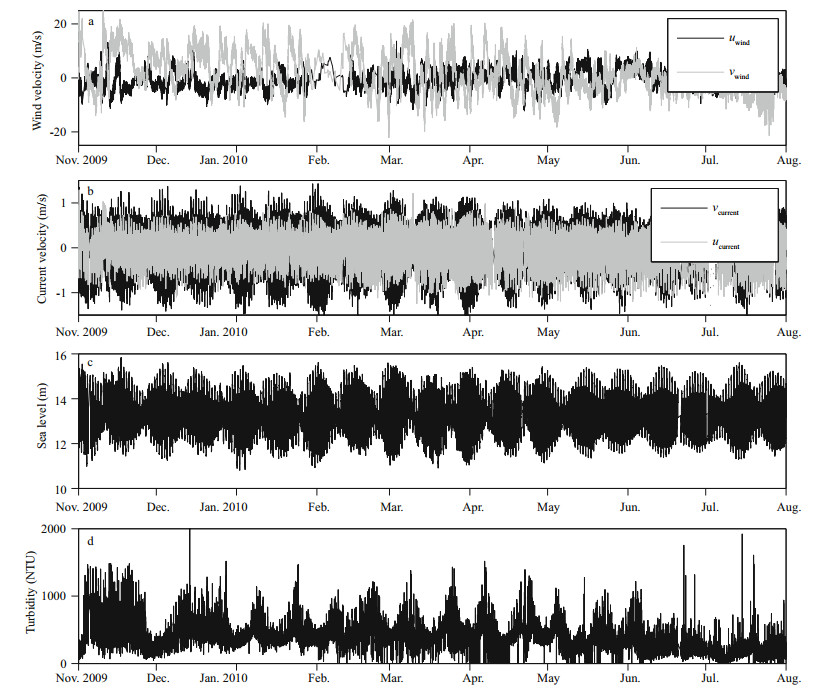
4 RESULT 4.1 Characteristics of the hydrology measurementsFrom November 2009 to August 2010, the wind velocity (Fig. 2a) was dominated by the meridional component (north-south). Combined with the influence of the islands near the seafloor observatory, the meridional wind has a dominant influence on the variations of local current velocity and sea surface level (Zhang et al., 2011). The average meridional wind speed (5.9 m/s) was twice the average zonal wind speed (2.6 m/s). The wind speed in winter and spring (with a mean value of 7.1 m/s) was stronger than that in summer (with a mean value of 3.9 m/s). Several strong wind bursts occurred and lasted for an extended time. For example, one strong northward wind burst with a speed greater than 10 m/s (sometimes as high as 20 m/s) began on 13 November and ended on 19 November.
|
| Figure 2 Time series of the observed data a. wind velocity, the black line shows the zonal wind velocity and the gray line the meridional wind velocity; b. current velocity, the black line shows the zonal current velocity component and the gray line the meridional current velocity component; c. sea level; d. turbidity near the bottom. |
The current velocity (Fig. 2b) near Xiaoqushan Island was also dominated by the meridional component. The average meridional velocity was 2.5 times greater than the average zonal velocity with a maximal velocity of the order of 1 m/s. Both mixed semi-diurnal and spring-neap tidal cycles are distinguishable from the current velocity and sea level (Fig. 2c). The water depth ranged from 12 m at low water to 15 m at high water. The current flowed northward during the flood tide periods with a mean velocity of 0.5 m/s. The changes in direction and velocity during the ebb tide were much more complex. Moreover, the current velocity during the spring tide was approximately 1.5 times greater than that during the neap tide.
The trend of the time-series turbidity reveals a distinctive tidal signal. In general, the turbidity was low during the spring tide with a mean value of 376.2 NTU, and high during the neap tide with a mean value of 536.5 NTU. However, this was not the always case. For example, the turbidity remained high during the whole month in November, 2009.
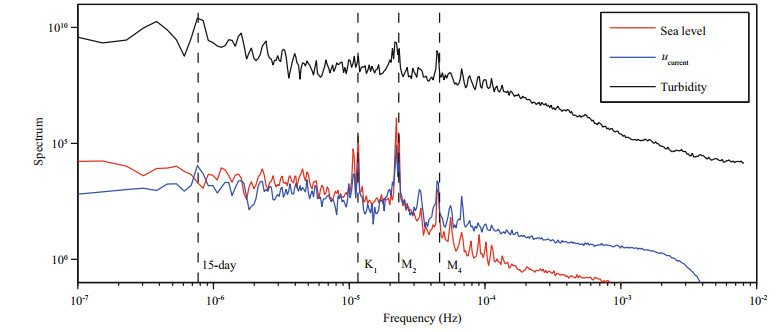
The spectra of the current velocity, sea level, and turbidity in the frequency domain, which were calculated with the fast Fourier transform method, suggest the dominant tidal periods (Fig. 3). All three variables have peaks at the semi-diurnal (M2) tide period. The current velocity and sea level also had peaks at the diurnal (K1) tide period. However, we found a significant peak at the quarter diurnal (M4) tide period for turbidity. This is similar to dissolved organic particles and other chemical elements on the ECS coast (Gao et al., 2011).
|
| Figure 3 Spectrum of sea level (red line), zonal current velocity (blue line), and turbidity (black line) The data used for the spectrum calculation are from Fig. 2. |
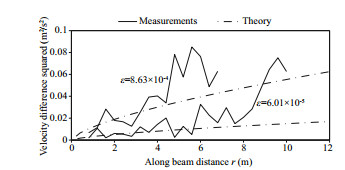
ADCP data were ensemble averaged over 2 seconds (i.e., 10 pings). Beam 1 of the ADCP (the velocity in this direction is v) was oriented to the east and perpendicular to the main component of tidal flow. Beam 2 of the ADCP (the velocity in this direction is u) was oriented to the north and aligned parallel to the main component of tidal flow. The ADCP pitch angle (beams 1 and 2) was around 2° without significant variations during the observations. Both measurements from beams 1 and 2 were used to calculate ε. The TKE dissipation rate ε was obtained by fitting the observed S(z, r) values calculated from ADCP measurements to the theoretical values based on Eq.2. Specifically, the ratio of the observed S(z, r) and the theoretical S(z, r) was minimized by adjusting ε. The results in Fig. 4 show two examples for the fitting, suggesting that larger S(z, r) results in a larger ε.
|
| Figure 4 Fits of the velocity difference squared calculated from ADCP measurements (black lines) and the theoretical values (dotted gray lines) with the optimal dissipation rate of TKE Two examples for different current velocity amplitudes are shown. The values for current speed and corresponding estimated dissipation rate are labeled. |
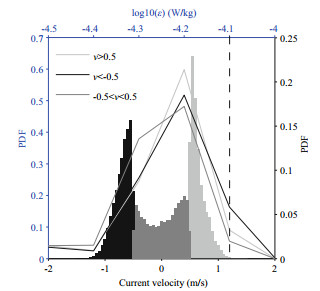
Estimates of ε from two beams of ADCP velocity measurements are shown in Fig. 5. The estimates of ε from the two beams are quite similar both in time and space (Fig. 5b, d). This suggests that the estimates are reliable. Larger dissipation rates occurred in the upper layer, especially during the neap tide periods. Sea surface wave breaking may have induced this strong mixing in the upper layer. Because the surface dissipation rate was approximately 10 times greater than that near the bottom, we focus on the variations of the mean dissipation rate near the bottom to relate the turbidity that was also obtained near the bottom (Fig. 5e). The data at 5 m above the bottom were chosen to calculate the mean velocity and dissipation rate in the bottom boundary layer (Fig. 6). The mean dissipation rate during the spring tide (with a mean value of 6.3×10⁻⁵ W/kg) was only approximately 1.2 times greater than that during the neap tide (with a mean value of 5.3×10⁻⁵ W/kg). During the flood tide, the dissipation rate was at a maximum when the velocity components reached their maxima. The dissipation rate was at a maximum with a higher value when the velocities reached their maxima during the ebb tide. According to the statistics of the dissipation rate and velocities with different value ranges (Fig. 7), more ε with values greater than 7.95×10⁻⁵ W/kg occurred during the ebb tide (green and pink lines in Fig. 7, when current velocities were greater than 0.5 m/s). When the current velocity was modest (purple line in Fig. 7), fewer ε were greater than 7.95×10⁻⁵ W/kg. This implies that the stronger current velocity results in strong ocean mixing on the coast of the ECS. However, the differences between the distributions of ε in different tidal velocity ranges are limited.

|
| Figure 5 Distributions of the current velocity, dissipation rate, and turbidity a. current velocity computed from ADCP beam 1; b. the dissipation rate ε calculated from current velocity shown in (a); c. current velocity computed from ADCP beam 2; d. the dissipation rate ε calculated from current velocity shown in (c); e. turbidity near the bottom. The y-axis in panels (a)–(d) shows the meter above the bottom (mab). |

|
| Figure 6 Distributions of the wind, current velocity, dissipation, and turbidity in November and December, 2009, during the strong wind period a. zonal wind velocity (black line) and meridional wind velocity (gray line); b. sea level; c. zonal current velocity (black line) and meridional current velocity (gray line); d. the depth mean dissipation rate near the bottom boundary layer; e. turbidity near the bottom boundary layer. |
|
| Figure 7 Statistical comparison of dissipation rate and current velocity in three different velocity ranges PDF: probability density function. Zonal current velocity v>0.5 m/s indicates the strong phase of the flood tide (light gray line and bars); v < -0.5 m/s indicates the strong phase of the ebb tide (black line and bars); -0.5 < v < 0.5 indicates the moderate phase of the current velocity (dark gray line and bars). The lines denote the possible density of current velocity. The bars indicate the potential density of the dissipation rate. The dashed line denotes a dissipation rate of 7.95×10⁻⁵ W/kg. |
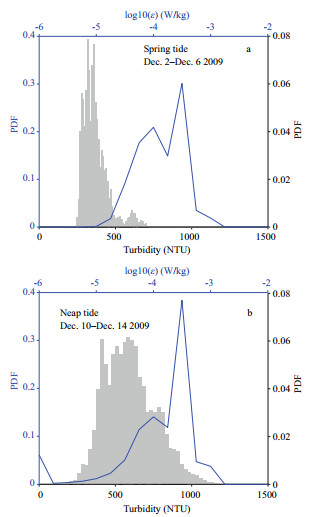
A summary of the turbidity statistics are shown in Fig. 8. Only 8.9% of the turbidity had values greater than 500 NTU during the spring tide, and 40% of the corresponding dissipation rate was greater than 10-4 W/kg (Fig. 8a). For the neap tide, high turbidity with values greater than 500 NTU occurred up to 70% of the time, and 62% of the dissipation rate was greater than 10-4 W/kg (Fig. 8b). If only the current velocity is taken into account as discussed in Section 4.1, more ε values were expected to be greater than 10-4 W/kg during the spring tide and less during the neap tide. However, the statistics in Fig. 8 indicate a different result. This finding clarifies that high turbidity corresponds to a large dissipation rate. According to a comprehensive laboratory experiment to investigate the boundary layer dynamics with different cohesive sediment suspension (Li and Gust, 2000), flocculation of sediment is considered to contribute partially to the turbulence damping. The most likely aggregation of sediments with larger floc sizes results in sediment deposition, which leads to a decrease in the turbidity during spring tide. Density gradients, which may decrease vertical momentum exchange, are expected because of sediment deposition processes. As a result, deposition stratification potentially contributes to the turbulence dissipation reduction observed in our study.
|
| Figure 8 Statistical comparison of the dissipation rate and turbidity during different tidal periods a. spring tide; b. neap tide. The gray bars show the potential density of turbidity; the blue dashed and solid lines show the probable density of the dissipation rate for spring and neap tide, respectively. |
This paper discussed the characteristics of the dissipation rate of TKE and turbidity based on yearlong measurements obtained by the Xiaoqushan seafloor observatory on the ECS coast. Using the method proposed by Wiles et al. (2006) for estimating the dissipation rate from ADCP measurements, the long-term time series of dissipation rate of TKE in the ECS coast region were first estimated. The results indicate a strong ocean mixing process (with a mean ε value of 5.7×10⁻⁵ W/kg) and distinct tidal variations in the dissipation rate. In general, strong current velocity leads to a greater dissipation rate (Fig. 7). However, this influence is not strong, as shown by the larger dissipation rate that occurred during the ebb tide (with weaker current velocity than that in flood tide). This leads to another important finding, which is that the high turbidity can also change the fluid structure, resulting in stronger ocean mixing (Fig. 8).
The variations in the turbulence were also considered with different temporal scales caused by external forcing. Because of the shallow depth of the study area, wind was one of the most likely forces that result in enhanced dissipation rate at depth (Zhang and Tian, 2014). In our study, we had difficulties in decomposing the influence of the dissipation rate from wind and turbidity. However, the reasonable correlation between the high (low) turbidity and large (small) dissipation rate leads us to conclude that the turbidity does influence ocean mixing near the bottom boundary layer.
We did not have direct measurements of the dissipation rate of TKE to evaluate the estimates based on the structure function method. However, fortunately, the dynamic characteristics of the study area in Wiles et al. (2006) are similar to ours, and therefore the estimates of the dissipation rate in the ECS coast region were comparable with the results from Wiles et al. (2006). Both of the estimated dissipation rates show similar features in the temporal and spatial variations. It is important to obtain direct measurements to confirm this structure function method in estimating the dissipation rate in the ECS area in the future. We believe that future studies focusing on the relation between the dissipation rate and the turbidity will provide us with new insight into the sediment dynamic processes.
6 ACKNOWLEDGEMENTWe appreciate the help provided by colleagues involved in the engineering and data collection at the Xiaoqushan seafloor observatory.
| Dyer K R, Christie M C, Manning A J, 2004. The effects of suspended sediment on turbulence within an estuarineturbidity maximum. Estuar. Coast. Shelf. Sci., 59 (2) : 237 –248. Doi: 10.1016/j.ecss.2003.09.002 |
| Gao L, Fan D D, Zhang Y W, Li D J, Cai J G. 2011. Tracing the quarter-diurnal signatures of nutrients and dissolved organic matter to evaluate their non-conservative behaviors in coastal seawaters. J. Geophys. Res., 116(G3):G03015, http://dx.doi.org/10.1029/2010JG001627. |
| Gao S, Wang Y P. 2008. Changes in material fluxes from the Changjiang River and their implications on the adjoining continental shelf ecosystem. Cont. Shelf Res., 28(12):1 490-1 500, http://dx.doi.org/10.1016/j.csr.2007.02.010. |
| Gargett A E, 1999. Velcro measurement of turbulence kinetic energy dissipation rate epsilon. J. Atmos. Oceanic Tech., 16 (12) : 1973 –1993. Doi: 10.1175/1520-0426(1999)016<1973:VMOTKE>2.0.CO;2 |
| Gust G, 1976. Observations on turbulent-drag reduction in a dilute suspension of clay in sea-water. J. Fluid Mech., 75 (1) : 29 –47. Doi: 10.1017/S0022112076000116 |
| Lhermitte R M. 1968. Turbulent air motion as observed by Doppler radar, paper presented at 13th Radar Meteorological Conference. Am. Meteor. Soc. Montreal, Que., Canada. |
| Li M Z, Gu st, 2000. Boundary layer dynamics and drag reduction in flows of high cohesive sediment suspensions. Sedimentology, 47 : 71 –86. Doi: 10.1046/j.1365-3091.2000.00277.x |
| Liu Z Y, Wei H, Lozovatsky I D, Fernando H J S, 2009. Late summer stratification, internal waves, and turbulence in the Yellow Sea. J. Mar. Sys., 77 (4) : 459 –472. Doi: 10.1016/j.jmarsys.2008.11.001 |
| Lozovatsky I D, Liu Z Y, Fernando H, Armengol J, Roget E, 2012. Shallow water tidal currents in close proximity to the seafloor and boundary-induced turbulence. Ocean Dynam., 62 (2) : 177 –191. Doi: 10.1007/s10236-011-0495-3 |
| Ma G F, Shi F Y, Liu S G, Qi D M, 2013. Migration of sediment deposition due to the construction of large-scale structures in Changjiang estuary. App. Ocean. Res., 43 : 148 –156. Doi: 10.1016/j.apor.2013.09.002 |
| Ma P F, Madsen O S. 2012. A 3D sediment transport model for combined wave-current flows. Coast. Eng., (33), http://dx.doi.org/10.9753/icce.v33.sediment.21. |
| Moum J N, Nash J D, 2009. Mixing measurements on an equatorial ocean mooring. J. Atmos. Ocean. Tech., 26 : 317 –336. Doi: 10.1175/2008JTECHO617.1 |
| Shi Z J, 2010. Tidal resuspension and transport processes of fine sediment within the river plume in the partially-mixed Changjiang River estuary, China:a personal perspective. Geomorphology, 121 (3-4) : 133 –151. Doi: 10.1016/j.geomorph.2010.04.021 |
| Stansfield K, 2001. The probability distribution of the Thorpe displacement within overturns in Juan de Fuca Strait. J.Phys. Oceanogr., 31 (12) : 3421 –3434. Doi: 10.1175/1520-0485(2001)031<3421:TPDOTT>2.0.CO;2 |
| Ulker M B C, Rahman M S, Jeng D-S, 2009. Wave-induced response of seabed:various formulations and their applicability. Appl. Ocean. Res., 31 (1) : 12 –24. Doi: 10.1016/j.apor.2009.03.003 |
| Wang X H, 2002. Tide-induced sediment resuspension and the bottom boundary layer in an idealized estuary with a muddy bed. J. Phys. Oceanogr., 32 (11) : 3113 –3130. Doi: 10.1175/1520-0485(2002)032<3113:TISRAT>2.0.CO;2 |
| Wang Y P, Gao S, 2010. The effect of sediment resuspension on benthic boundary layer in macro-tidal environments. Mar. Sci., 34 (1) : 52 –57. |
| Wang Y P, Gao S, Jia J J, 2000. Flow structure in the marine boundary layer and bedload transport:a review. Mar.Geol. Quaternary. Geol., 20 (3) : 101 –106. |
| Wei H, Zhao L, Liu G S, Jiang W S, 2006. Study on bottom boundary layer processes and water-sediment exchange. Adv. Earth Sci., 21 (11) : 1180 –1184. |
| Werner S R, Beardsley R C, Lentz S J, Hebert D L, Oakey N S. 2003. Observations and modeling of the tidal bottom boundary layer on the southern flank of Georges Bank. J.Geophys. Res., 108(C11):8 005, http://dx.doi.org/10.1029/2001JC001271. |
| Wiles P J, Rippeth T P, Simpson J H. Hendricks P J. 2006. A novel technique for measuring the rate of turbulent dissipation in the marine environment. Geophys. Res. Lett., 33(21):L21608, http://dx.doi.org/10.1029/2006GL027050. |
| Zhang Y W, Fan D D, Xu H P, 2011. Records of the tsunami induced by the 2010 Chilean earthquake from Xiaoqushan Seafloor observatory in the East China Sea. Chinese Sci.Bull., 56 (27) : 2957 –2965. Doi: 10.1007/s11434-011-4624-7 |
| Zhang Y W, Moum J N, 2010. Inertial-convective subrange estimates of thermal variance dissipation rate from moored temperature measurements. J. Atmos. Ocean.Tech., 27 (11) : 1950 –1959. Doi: 10.1175/2010JTECHO746.1 |
| Zhang Y W, Tian J W, 2014. Enhanced turbulent mixing induced by strong wind on the South China Sea shelf. Ocean Dynam., 64 (6) : 781 –796. Doi: 10.1007/s10236-014-0710-0 |
| Zhou L, Tian J W, Zhang X Q, 2005. Observation of smallscale processes over shelf break in the East China Sea. Chinese Sci. Bull., 50 (24) : 2885 –2890. |
 2016, Vol. 34


