 2016, Vol. 34
Institute of Oceanology, Chinese Academy of Sciences
Article Information
- YANG Dazuo(杨大佐), CHEN Fudi(陈福迪), ZHOU Yibing(周一兵), XIU Zhilong(修志龙)
- Diel variation in metabolism and ammonia excretion of Marphysa sanguinea (Polychaeta: Eunicidae)
- Chinese Journal of Oceanology and Limnology, 34(6): 1209-1217
- http://dx.doi.org/10.1007/s00343-016-4340-x
Article History
- Received Nov. 28, 2014
- accepted for publication Mar. 27, 2015
- accepted in principle Aug. 20, 2015


2 Key Laboratory of Marine Bio-Resources Restoration and Habitat Reparation in Liaoning Province, Dalian Ocean University, Dalian 116023, China;
3 Key Laboratory of North Mariculture, Ministry of Agriculture, Dalian Ocean University, Dalian 116023, China
The polychaete Marphysa sanguinea is a cosmopolitan species globally distributed in temperate to tropical latitudes (Hutchings and Karageorgopoulos, 2003 ; Prevedelli et al., 2007) and in coastal areas of China. M. sanguinea can be found in a variety of marine benthic environments, including soft muddy sediments around oyster reefs, sandy or muddy tidal flats, among other fouling organisms on dock pilings and buoys, and inside the holes of calcareous rocks, the basis of their common name ‘rockworms'(Ruppert and Fox, 1988). When inhabiting sediments, these worms use their muscular bodies to create burrows in the sand or mud. The worms are often found in the low intertidal zones of coastal China. M. sanguinea is a gonochoric species, with individuals being either male or female (Glasby and Hutchings, 2010). They reproduce sexually and are iteroparous, i.e., they are capable of producing multiple egg clutches throughout their lifetime. Aspects of their fertilization and reproduction are unclear but scientists speculate that copulation between the male and female occurs within the burrow, where their eggs remain until they reach the free-swimming larval stage (Prevedelli et al., 2007). M. sanguinea is an omnivore within the zoobenthos. Its food consists of sedimentary organic matter and seaweed. In particular, in sea cucumber aquaculture ponds in Shandong and Liaoning Provinces, these worms consume sediment and harmful algae (Cladophora sp.). Their burrowing and feeding activities also improve the oxygen flux through the sediment, avoiding excessive deposition of inorganic nitrogen and the occurrence of eutrophication. Thus, M. sanguinea is a component of the material circulation and energy flow in marine ecosystems and plays significant ecological roles in degrading submarine pollutants and improving the sediment environment (Yu et al., 2005 ; Yang et al., 2011).
Polychaete worms are widely used as bait in the sport of sea angling. They also represent an excellent living diet for the aquaculture of finfish, shrimps and crustaceans (Olive, 1994 ; Wu et al., 1985). M. sanguinea is a large polychaete, growing up to 400 mm in length. Because of its bright red color and fleshy hypertrophy, it is also a valuable commercial bait in the international ocean fishing market. Furthermore, bioactive materials in the body of M. sanguinea have been used in the development of cancer drugs (Pan et al., 2004). With rapid development of marine amusement angling spots and fish aquaculture, the demand for M. sanguinea is increasing. However, because of excessive excavation in China and other states (Yu et al., 2005 ; Garcês and Pereira, 2011 ; Yang et al., 2011), the natural resources of this species have significantly declined. In order to increase the size of the resource by artificial means, we need to understand the lifestyle and physiology of M. sanguinea including its respiration and excretion.
The rate of respiration, measured in terms of oxygen (O2) consumption, is commonly used as a proxy for metabolic rate in aquatic and terrestrial animals (Kleiber, 1975). Rates of O2 consumption (R) by aquatic animals have been classified into different levels according to the intensity of activity occurring during the measurements. These levels include standard (RS), routine (RR), specific dynamic action (RSDA), and active (RA) respiration rates, which correspond to the costs of resting metabolism (e.g., in unfed quiescent conditions), routine movements, digestion and assimilation of food, and active swimming, respectively (Fry, 1957 ; Brett and Groves, 1979). Separate determination of RA and RSDA is difficult to perform in an aquatic environment, so they are often lumped together and referred to as routine metabolism (RR). There have been many studies of the respiratory metabolism of polychaetes (Sander, 1973 ; Shumway, 1979 ; Beis et al., 1980 ; Wells et al., 1980 ; Dangott and Terwilliger, 1986 ; Shumway et al., 1988 ; Wang et al., 2004). Most have concentrated on small polychaetes and there are few reports on the metabolism of Eunicidae. The current study aimed to measure diurnal variation in the metabolism M. sanguinea, a polychaete with a rather different lifestyle to those studied previously.
2 MATERIAL AND METHOD 2.1 Worm selection and groupingM. sanguinea individuals were obtained from a farmer and were collected by digging with a spade in an estuarine intertidal zone in Dalian, China. Worms of healthy appearance were selected, allocated to three groups based on body width under undisturbed conditions, and their body weights recorded. The width ranges of the three groups were: small (S, 2-5 mm), medium (M, 5-8 mm) and large (L, >8 mm). The mean (±SD) body weights of the three groups were: S: 1.24±0.06 g, M: 4.00±0.30 g, and L: 8.54±1.08 g. When the experiment was completed, the wet and dry weights (65℃, 48 h) of all worms were measured using an analytical balance (model AL104-IC, Mettler Toledo, Greifensee, Switzerland) and their linear regression relationship was calculated.
2.2 Temporary cultureAfter allocating to groups, each worm was housed in a U-shaped plastic tube to simulate its natural burrow environment; the tubes were 1.5 times the average worm body length and of internal diameter, 0.8-0.9 times the average worm's body width (Kristensen, 1983 ; Shumway et al., 1988). They were placed into a fiberglass aquaria filled with filtered seawater (salinity 30-32; temperature 14.0±0.5℃; dissolved oxygen >5.0 mg/L). The worms were fed with Ulva pertusa at night and cultured for 1 week. The temperature was then increased at a rate of 1℃ per day using an aquarium heater (model JRB-250, Shenshen Company, GuangZhou, China) to 16±0.5℃ and held at this temperature for 1 week. The seawater in each aquarium was continuously aerated using airstones and replaced daily with isothermal seawater.
2.3 ApparatusThe experimental system consisted of a flowing water system (1 000 mL) with an upper reservoir, a respirometry chamber, and a sample mixing bottle (Fig. 1). The worms in their U-shaped tubes were placed at the bottom of the respirometer with minimal disturbance. Water flowed from the reservoir into the respirometer, and into to the sample mixing bottle. The respirometer and sample mixing bottle were immersed in a thermostatically-controlled water bath that maintained the experimental temperature. A tubing clamp was used to control the water flow rate over a timed experimental interval and collected via the drainage tube. There were three replicate aquaria in each group. Three worms were placed in the respirometer chamber in group S, and two worms in each of groups M and L. Two identical respirometry chambers without test animals were used as control groups.

|
| Figure 1 Diagram of the respirometry apparatus based on a flow-through system a. thermostatic water bath (657 mm×479 mm×299 mm); b. respirometer chamber (1 L); c. inlet tube; d. tubing clamp; e. upper water bath (720 mm×540 mm×375 mm); f. outlet tube; g. sample mixing bottle (500 mL); h. drainage tube; i. thermostatic water bath (657 mm×479 mm×299 mm). |
The habit of M. sanguinea is to hide during the daytime and emerge from their holes to feed at night. Therefore, the worms were fed throughout the night and feeding was confirmed by observation of their full guts. We then monitored the worms' metabolism from the beginning of the next morning for 36 h to establish the diurnal rhythm of their ‘active metabolism'. On completion of the active metabolism test, the food was removed and the worms were starved for 36 h to determine diurnal changes in their ‘standard metabolism'. Routine and standard metabolic rates were measured every 3 h. Rates of respiration and excretion were calculated from the differences in concentration of dissolved oxygen (DO) and of ammonia-N, respectively, between the inlet and outlet water.
Dissolved oxygen concentration was determined by the Winkler method (Strickland and Parsons, 1968). The following formula was used to calculate the oxygen consumption rate:
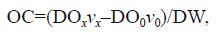
where OC is the oxygen consumption rate (mg/(g·h)), DOx is the difference in DO between the inlet and outlet in the experimental groups, DO0 is the difference in DO between the inlet and outlet in the control group (mg/L), DW is the dry mass of the worms (g), vx is the flow rate in the experiment (L/h), and v0 is the flow rate in the control group (L/h).
Ammonia-N was determined using the Sodium hypobromite oxidation method (SEPAC, 1997). The following formula was used to calculate the ammonia-N excretion rate:

where AE is the ammonia-N excretion rate (μg/(g·h)), Nx is the difference in ammonia-N between the inlet and outlet in the experimental groups, N0 is the difference in ammonia-N between the inlet and the outlet in the control group (μg/L), vx is the flow rate in the experiment (L/h), and v0 is the flow rate in the control group (L/h).
2.5 Data analysis and SDA computationStatistical analyses were performed using SPSS (version 13.0). One-way ANOVA was applied to determine the effect of body weight on oxygen consumption rate. The relationship between oxygen consumption rate and dry weight was calculated by regression.
According to Secor (2009), specific dynamic action (SDA) is defined as the postprandial energy metabolism. In aquatic invertebrates, SDA is measured as the metabolism of animals following feeding during inactive conditions. Calculating SDA consists of measuring the respiration rate during the postprandial period and yields the total metabolism associated with digestion. As shown in Fig. 2, SDA metabolism is the sum of postprandial metabolic rate from time t0 to t, as well as the area of the baseline metabolic rate curve from time t0 to t. Figure 2 is the theoretical condition: the actual curve of an animal's postprandial metabolic rate is similar but more variable. Therefore, we can fit a curve of metabolic rate from t0 to t, and a general polynomial, such as y = ax n + bx n - 1 +...+? x +?, can be derived. By calculating the definite integral of the equation during time t0 to t, the area of the curve can be calculated. Definite integrals of the equation were estimated using Matlab software (version 7.0).

|
| Figure 2 Schematic of specific dynamic action (SDA) under theoretical conditions (after Secor, 2009) |
The mean rate of oxygen consumption of M. sanguinea at 16℃ varied with body weight, as shown in Table 1. The relationship between weightspecific oxygen consumption (mg/(g·h)) and dry body weight (g) of M. sanguinea was expressed by a negative power function R = aW b). For routine metabolism (RR), the coefficients a and b were estimated as 0.813 8 and -0.400 9, respectively. For standard metabolism (RS), they were 0.487 2 and -0.532 0, respectively. Both RR and RS decreased with body weight and their regression relationship were statistically significant (P<0.01). The correlation coefficients (R2) were 0.886 8 and 0.975 0(n =21), respectively.
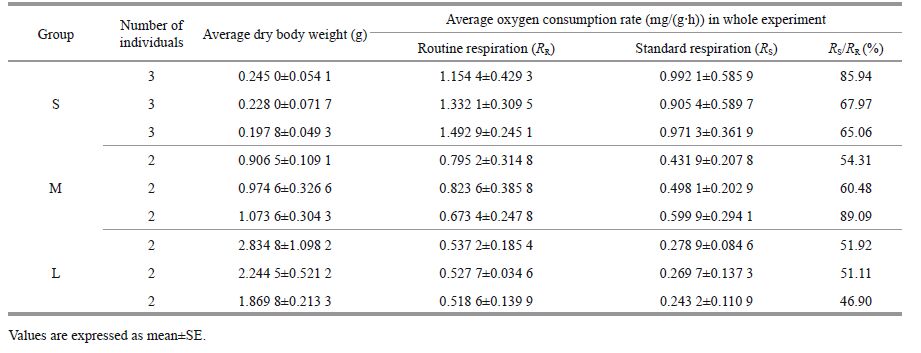
Diurnal changes in the rates of oxygen consumption (mg/(g·h)) of M. sanguinea with different body sizes are shown in Fig. 3. In both starved and fed states, the oxygen consumption declined with increasing body weight. The metabolic rates at night were significantly greater than those during the daytime. In the routine condition, the average oxygen consumption rates (RR) at night (1700 h to 0800 h) for the S, M and L bodyweight groups were 0.215 1, 0.615 2, and 0.266 6 mg/(g·h), respectively. During daytime (1100 h to 1400 h), they were 1.506 1, 0.114 1, and 0.179 9 mg/(g·h), respectively. Groups M and L showed typical habits of hiding by day and emerging at night. Figure 3 shows that the standard metabolic rates (RS) of the three groups were relatively stable. By variance analysis, the differences among the RS values of the three body-weight groups (S, M, and L) were found to be statistically significant (F =14.494 and P<0.01). The routine oxygen consumption rates (RR) were clearly higher than the standard values (RS). Group S peaked 24 h after the start of the experiment and groups M and L peaked after 12 h to 25 h. The peak values were 4.22, 1.6, and 1.23 times higher than their respective RS rates. The differences among the RR values of the three groups were found to be statistically significant (F =18.264; P<0.01).

|
| Figure 3 Diurnal variations of oxygen consumption rates in standard and routine conditions |
The changes in ammonia-N excretion rates (μg/(g·h)) at 16℃ of M. sanguinea of different sizes are shown in Fig. 4. The standard rates of ammonia-N excretion (AES) of M. sanguinea were relatively stable over the diurnal cycle. The average ammonia-N excretion values for the S, M, and L groups of worms were 13.826 9, 5.462 0, and 12.094 9 μg/(g·h), respectively. The effect of body weight on the standard ammonia-N excretion rate was statistically significant (F =4.036 1 and P =0.026). Compared with AES, the curves of the ammonia-N excretion rates in the routine condition (AER) were strikingly different. The ammonia-N excretion rate of each size group was lower than the corresponding standard rate at the beginning of the experiment, and reached peak values 25 h after feeding. The peak values of AER were 3.13, 16.77, and 6.08 times higher, respectively, than the AES values at the corresponding time. At the end of the experiment, the AER value was again lower than the AES. Statistical analysis showed that differences among routine ammonia-N excretion rates (AER) of the three groups were significant (F =5.485 0; P =0.012).

|
| Figure 4 Diurnal variations in ammonia-N excretion rates of M. sanguinea in standard and routine conditions |
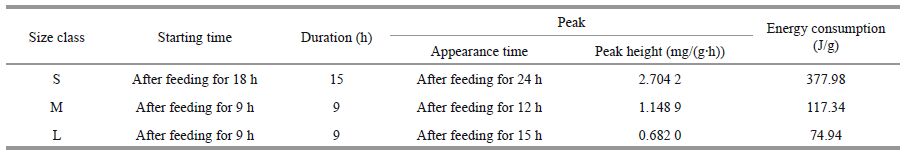
To estimate the energy consumption associated with SDA, we fitted the routine oxygen (RR) consumption data against time (t) to polynomial curves, as illustrated in Fig. 2 :

where RSDA (mg/(g·h)) is the rate of oxygen consumption during the period of SDA, and t (h) is the duration of the SDA. The total oxygen consumed during the SDA period was computed from the definite integral against time t and converted to energy units using the oxygen heat equivalent coefficient of 13.78 J/mg (Brafield and Llewellyn, 1982). These values were: 377.98, 117.34, and 74.94 J/g (Table 2) for the S, M and L worms, respectively.
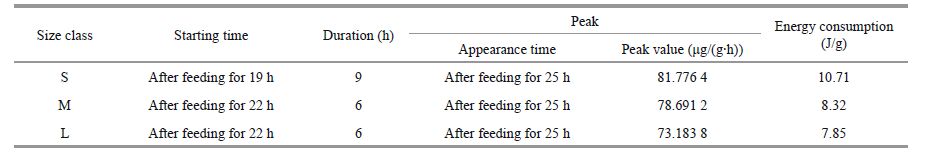
Using the same method, the relationships between AER and time were expressed by the following equations:


where AEP is the ammonia-N excretion rate (μg/(g·h)) and t (h) is the time. By calculating the definite integral against time t using these equations, the total scope of ammonia-N excretion was calculated. To determine the caloric content of excreted ammonia, an ammonia heat equivalent coefficient of 20.5 J/mg was used (Solomon and Brafield, 1972). Thus, the total energy consumption associated with the ammonia-N excretion values were obtained: 10.71, 8.32 and 7.85 J/g, S, M and L groups, respectively (Table 3).
In bioenergetics, routine metabolic energy is the mean metabolic energy observed in an organism performing a normal range of activities (Fry, 1971). In contrast, standard metabolic energy is that required to maintain basic biological functions independent of activity, digestion, or the costs of physiological stressors. The active metabolic energy is the energy required to perform specified levels of activity. Unlike free-swimming fish, M. sanguinea burrows in sediments and usually maintains low activity. Hence, routine metabolism (after feeding and before excretion) of respiration under normal physiological conditions is often used in research on shellfish physiological energetics. Animals were starved for 2 to 6 days to allow for gastric evacuation and to eliminate any confounding effect of SDA on metabolic rate measurements. Gastric evacuation in this species was complete after 70 to 92 h, and was associated with a low level of energy consumption with occasional spontaneous activity, and was defined as standard metabolism (Medved, 1985). In the current study, M. sanguinea were starved for 72 h to measure their standard metabolism.
The relationship between the metabolic rate and the weight of numerous aquatic organisms can be expressed as Y = aW b, where ‘ a ' and ‘ b ' are coefficients. The coefficient ‘ a ' represents the oxygen consumption rate per unit weight. Its value is affected by many factors, including environmental variables, such as temperature, salinity, and internal factors, such as the size of individual organisms, activities, and gonad development, which generally induces large changes. ‘ b ' is the respiration coefficient, which expresses the relationship between weight-specific oxygen consumption and total body weight, and generally changes little among similar biological animals. Shumway (1979) studied the relationship between the metabolic rate and body weights of 18 species of polychaetes, and found that their ‘ b ' values ranged between -0.21 and -0.59. Beis et al.(1980) studied Ophelia bicornis and obtained a ‘ b ' value of -0.24. Riisgård (1989) found a ‘ b ' value of -0.41 for Chaetopterus variopedatus. In the current experiment, the ‘ b ' value of the RR of M. sanguinea was -0.400 9 at 16℃, and the value for R s was -0.5320. These findings are consistent with those of Shumway (1979) but are larger than the reported ‘ b ' values of for other aquatic animals, e.g., -1.3 for seed Chinese shrimp (Zhou et al., 2002), -0.57 for juvenile Macrobrachium rosenbergii (Clifford and Brick, 1983), -0.3 to -0.1 for fishes (Cui, 1989), and -0.9 to -0.56 for bivalves (Bayne and Newell, 1983).
Our experimental results showed that the ranges of RR and RS of group S were significantly greater than those of groups M and L. The oxygen consumption rate of individuals was found to be related to their body weight. A small light individual has a vigorous growth stage, high metabolic rate, and high rate of oxygen consumption. With weight gain, the growth rate, metabolism and oxygen consumption rate gradually decrease. Small animals consume oxygen at a faster rate per weight unit than large animals (Sander, 1973 ; Beis et al., 1980). In addition, the metabolism of the worms is affected by other factors, such as temperature, salinity, concentration, and the type of organic matter. The factors affecting the metabolic characteristics of M. sanguinea need further research.
4.2 Diurnal fluctuations of the standard metabolism of M. sanguineaChildress (1978) proposed that in the ocean, many environmental conditions are more stable than in other habitats, and that diurnal metabolism is dependent on the DO concentration as well as on the survival strategies by which animals compete for oxygen. In the current experiment, the standard metabolism of each group at 16℃ was obviously rhythmic, i.e., always high at night (1700 h to 2300 h), low at0200 h (the second day), and then continued to increase until 0800 h. The average metabolic rate at night was higher than in the daytime. This finding may be relevant for understanding the living habits of worms, which hide in the daytime and emerge at night (Prevedelli et al., 2007). Last (2003) found that although worm activities were influenced by light, the activity of Nereis virens that were out of their burrows continued even in darkness in an artificially controlled environment. In another nereid (Perinereis aibuhitensis), the diurnal metabolism rhythm was similar and the active time of this species was between 1800 h to 0600 h (of the second day)(Wang et al., 2005). Other marine creatures, such as Hemifusus tuba (Luo et al., 2008) and Haliotis discus (Chang and Wang, 1998), also display similar activity rhythms.
In the starved state, the ammonia-N excretion rate of all three size groups decreased slowly initially and then increased toward the end of the experiment. This may have been caused by starvation stress, with the worms beginning to use protein as a metabolic substrate, and leading to an increased rate of ammonia-N excretion. These results are consistent with those reported for P. aibuhitensis (Wang et al., 2005), N. diversicolor and N. virens (Nielsen et al., 1995).
4.3 Specific dynamic action of M. sanguineaThe increase in oxygen consumption rate of the animals after feeding is called “special dynamic action” which reflects the energy demand of the animal to food digestion and absorption, protein synthesis and translocation and the metabolic processes of nitrogen containing waste. The change of oxygen consumption rate in SDA process reflected the energy source in degradation of amino acids. Usually, the peak value of oxygen consumption rate, oxygen consumption rate of peak time, the duration time of oxygen consumption rate increased and oxygen consumption rate increment as the SDA calculated indicators (Jobling, 1981 ; Xie and Sun, 1991 ; Secor and Faulkner, 2002). In addition to these parameters, a baseline metabolic rate of animal need to be measured and the calculated SDA method of aquatic animals had been stated in Secor (2009). In the current experiment, worms were placed in U-shaped plastic tubes, in which their condition was similarly non-active. From the calculated height and duration of the peak in routine respiration after feeding, the total scope of the peak (Fig. 3) of RR and the SDA of M. sanguinea under diurnal condition were estimated. This method has also been applied in fish research (Xie and Sun, 1991).
The current study shows that at 16℃, the peak of RSDA generally appeared after 12 to 24 h of feeding and lasted for 9 to 15 h. A similar result was also obtained in other marine invertebrates at 20℃. The SDA of the triploid and diploid Crassostrea gigas appears 8 and 12 h after ingestion and lasts for 12 and 16 h, respectively (Zhou et al., 2002). At 20℃, the SDA of H. tuba peaks after 18 h of feeding and lasts for 15 h (Luo et al., 2008). Wang et al.(2005) found that the SDA of P. aibuhitensis appeared 15 h after ingestion with a duration of 12 h. Differences between our findings and previous reports may be attributed to the different metabolic actions and digestive organs in different organisms. The present experiment showed that the diurnal pattern in the rate of ammonia-N excretion was similar to that of the oxygen consumption. That is, the peak in ammonia-N excretion occurred after 25 h of feeding with a duration of 6 to 9 h (Figs. 3 and 4). Thus, the peak in of ammonia excretion appeared after the peak in oxygen consumption. This result is consistent with previous reports on triploid and diploid H. tuba and C. gigas.
From the viewpoint of energy balance, more of the assimilated energy is used for metabolism than for growth (Cui, 1989). However, Jobling (1981) has proposed that the increased energy assimilation associated with SDA in animals is triggered by an increase in the rates of protein synthesis and food transformation, and that SDA is a sign of the growth rate. Hence, the relationship between SDA and growth is not competitive but linked, i.e., if SDA is enhanced, growth speeds up. Cho et al.(1982) proposed that at similar levels of food intake, higher energy consumption indicated by longer durations and higher peak values of SDA, are associated with higher efficiency of transformation of nutrients, stronger ability to gain energy, and faster development. This phenomenon has also been observed in other Polychaeta. Consistent with an earlier report by Shumway (1979), Nielsen et al.(1995) found that within a 14-d experimental period under a range of food availability, the SDA of N. diversicolor and N. virens displayed a positive correlation with the specific growth rate, with R2 values ranging from 0.73 to 0.99. Such positive correlation has also been confirmed in studies on fish metabolism (Brill, 1996 ; Sainsbury et al., 1997 ; Houlihan et al., 1988 ; Glencross et al., 2002). In the current study, the energy consumption of SDA of the different size groups followed the trend S>M>L, the energy consumption of ammonia-N excretion also exhibited the same trend. The O:N atomic ratio was greater than 30 in all three groups, in both routine and standard conditions, except for the large worms in standard metabolism. This trend in the average O:N ratio was similar during the period of SDA. This observation indicates that metabolism in small individuals is more active, which offers them a significant growth advantage.
| Bayne B L, Newell R C. 1983. Physiological energetics of marine molluscs. In:Wilbur K M, Saleuddin A S M eds.The Mollusca. Academic Press, New York, Vol. 4.Physiology, Part 1. p.407-515. |
| Beis I, Manousis A, Barrett J, 1980. Studies on the respiration of the polychaete Ophelia bicornis. Comparative Biochemistry and Physiology Part A:Physiology, 67 (2) : 303 –305. Doi: 10.1016/0300-9629(80)90283-2 |
| Brafield A E, Llewellyn M J, 1982. Animal Energetics. Animal Energetics.Glasgow, UK. |
| Brett J R, Groves T D D. 1979. Physiological energetics. In:Hoar W S, Randall D J, Brett J R eds. Fish Physiology.Academic Press, New York. Vol.8, p.279-352. |
| Brill R W, 1996. Selective advantages conferred by the high performance physiology of tunas, billfishes, and dolphin fish. Comparative Biochemistry and Physiology Part A:Physiology, 113 (1) : 3 –15. |
| Chang Y Q, Wang Z C, 1998. An energy budget for individual pacific abalone (Haliotis discus hannai Lm). Journal of Applied Ecology, 9 (5) : 511 –516. |
| Childress J J, Barnes A T, Quetin L B, Robinson B H, 1978. Thermally protecting cod ends for the recovery of living deep-sea animals. Deep-Sea Res., 25 (4) : 419 –422. Doi: 10.1016/0146-6291(78)90568-4 |
| Cho C Y, Slinger S J, Bayley H S, 1982. Bioenergetics of salmonid fishes:energy intake, expenditure and productivity. Comparative Biochemistry and Physiology Part B:Comparative Biochemistry, 73 (1) : 25 –41. Doi: 10.1016/0305-0491(82)90198-5 |
| Clifford H C, Brick R W, 1983. Nutritional physiology of the freshwater shrimp Macrobrachium rosenbergii (de Man)-I. Substrate metabolism in fasting juvenile shrimp.Comparative Biochemistry and Physiology Part A:Physiology, 74 (3) : 561 –568. Doi: 10.1016/0300-9629(83)90548-0 |
| Cui Y B, 1989. Bioenergetics of fishers:theory and methods. Acta Hydrobiologica Sinica, 13 (4) : 369 –383. |
| Dangott L J, Terwilliger R C, 1986. The role of extracellular hemoglobins in the oxygen consumption of the burrowing polychaete, Euzonus mucronata (Treadwell). Journal and Experimental Marine Biology and Ecology, 97 (2) : 193 –204. Doi: 10.1016/0022-0981(86)90118-8 |
| Fry F E J. 1957. The aquatic respiration of fish. In:Brown M E ed. The Physiology of Fishes. Academic Press, New York.p.1-63. |
| Fry F E J. 1971. The effect of environmental factors on the physiology of fish. In:Hoar W S, Randall D J eds. Fish Physiology. Academic Press, New York. p.1-87. |
| Garcês J P, Pereira J, 2011. Effect of salinity on survival and growth of Marphysa sanguinea Montagu (1813) juveniles. Aquaculture International, 19 (3) : 523 –530. Doi: 10.1007/s10499-010-9368-x |
| Glasby C J, Hutchings P A, 2010. A new species of Marphysa Quatrefages, 1865 (Polychaeta:Eunicida:Eunicidae) from northern Australia and a review of similar taxa from the Indo-west Pacific, including the genus Nauphanta Kinberg, 1865. Zootaxa, 2352 : 29 –45. |
| Glencross B D, Clarke S, Buchanan J G, Carter C G, van Barneveld R J, 2002. Temporal growth patterns of farmed juvenile southern bluefin tuna, Thunnus maccoyii(Castelnau) fed moist pellets. Journal of the World Aquaculture Society, 33 (2) : 138 –145. Doi: 10.1111/jwas.2002.33.issue-2 |
| Houlihan D F, Hall S J, Gray C, Noble B S, 1988. Growth rates and protein turn over in Atlantic cod, Gadus morhua. Canadian Journal of Fisheries and Aquatic Sciences, 45 (6) : 951 –964. Doi: 10.1139/f88-117 |
| Hutchings P A, Karageorgopoulos P, 2003. Designation of a neotype of Marphysa sanguinea (Montagu, 1813) and a description of a new species of Marphysa from eastern Australia. Hydrobiologia, 496 (1-3) : 87 –94. Doi: 10.1023/A:1026124310552 |
| Jobling M, 1981. The influences of feeding on the metabolic rate of fishes:a short review. Journal of Fish Biology, 18 (5) : 385 –400. |
| Kleiber M. 1975. The Fire of Life:an Introduction to Animal Energetics. 2nd edn. R. E. Krieger Publishing Co., Huntington, NY. |
| Kristensen E. 1983. Comparison of polychaete (Nereis spp.) ventilation in plastic tubes and natural sediment. Mar.Ecol. Prog. Ser., 12:307-309. |
| Last K S, 2003. An actograph and its use in the study of foraging behaviour in the benthic polychaete, Nereis virens Sars. Journal of Experimental Marine Biology and Ecology, 287 (2) : 237 –248. Doi: 10.1016/S0022-0981(02)00576-2 |
| Luo J, Liu C W, Li F, Tang H C, 2008. Suffocation point and diurnal metabolism pattern of Hemifusus tuba (Gmelin). Chinese Journal of Applied Ecology, 19 (9) : 2 092 –2 096. |
| Medved R J, 1985. Gastric evacuation in the sandbar shark, Carcharhinus plumbeus. Journal of Fish Biology, 26 (3) : 239 –253. Doi: 10.1111/jfb.1985.26.issue-3 |
| Nielsen A M, Eriksen N T, Iversen J J L, Riisgård H U, 1995. Feeding, growth and respiration in the polychaetes Nereis diversicolor (facultative filter-feeder) and N. virens(omnivorous)-a comparative study. Mar. Ecol. Prog.Ser., 125 : 149 –158. Doi: 10.3354/meps125149 |
| Olive P J W, 1994. Polychaeta as a world resource:a review of patterns of exploitation as sea angling baits and the potential for aquaculture based production. Mémoires du Muséum National d'Histoire Naturelle, 162 : 603 –610. |
| Pan W D, Liu X H, Ge F, 2004. Screening of antimicrobial peptide from marine clamworm Marphysa sanguinea and preliminary research on its antitumor effect. Chinese Journal of Marine Drugs, 23 (3) : 1 –6. |
| Prevedelli D, N'Siala M G, Ansaloni I, Simonini R, 2007. Life cycle of Marphysa sanguinea (Polychaeta:Eunicidae) in the Venice Lagoon (Italy). Marine Ecology, 28 (3) : 384 –393. Doi: 10.1111/mae.2007.28.issue-3 |
| Riisgård H U, 1989. Properties and energy cost of the muscular piston pump in the suspension feeding polychaete Chaetopterus variopedatus. Marine Ecology-progress Series, 56 : 157 –168. Doi: 10.3354/meps056157 |
| Ruppert E E, Fox R S. 1988. Seashore Animals of the Southeast:a Guide to Common Shallow-Water Invertebrates of the Southeastern Atlantic Coast.University of South Carolina Press, Columbia, SC. 429p. |
| Sainsbury K J, Polacheck T, Klaer N L, Gunn J S, Campbell R A, Hearn W S, Davis T L O, Betlehem A W, Preece A, Cowling A, 1997. Recent developments and methods in southern Bluefin Tuna Fishery assessments. CSIRO Division of Marine Report, Hobart. |
| Sander F, 1973. A comparative study of respiration in two tropical marine polychaetes. Comparative Biochemistry and Physiology Part A:Physiology, 46 (2) : 311 –323. Doi: 10.1016/0300-9629(73)90421-0 |
| Secor S M, Faulkner A C, 2002. Effects of meal size, meal type, body temperature, and body size on the specific dynamic action of the marine toad, Bufo marinus. Physiol.Biochem. Zool., 75 (6) : 557 –571. Doi: 10.1086/344493 |
| Secor S M, 2009. Specific dynamic action:a review of the postprandial metabolic response. Journal of Comparative Physiology B, 179 (1) : 1 –56. Doi: 10.1007/s00360-008-0283-7 |
| SEPAC. (1997). Sea Water Quality Standard (GB 3097-1997).(in Chinese) |
| Shumway S E, Bogdanowicz C, Dean D, 1988. Oxygen consumption and feeding rates of the sabellid polychaete, Myxicola infundibulum (Renier). Comparative Biochemistry and Physiology Part A:Physiology, 90 (3) : 425 –428. Doi: 10.1016/0300-9629(88)90213-7 |
| Shumway S E, 1979. The effects of body size, oxygen tension and mode of life on the oxygen uptake rates of polychaetes. Comparative Biochemistry and Physiology Part A:Physiology, 64 (2) : 273 –278. Doi: 10.1016/0300-9629(79)90660-1 |
| Solomon D J, Brafield A E, 1972. The energetics of feeding, metabolism and growth of perch (Perca fluviatilis L. ).Journal of Animal Ecology, 41 (3) : 699 –718. Doi: 10.2307/3204 |
| Solorzano L, 1969. Determination of ammonia in natural waters by the phenolhypochlorite method. Limnology and Oceanography, 14 (5) : 799 –801. Doi: 10.4319/lo.1969.14.5.0799 |
| Strickland J D H, Parsons T R. 1968. A manual for sea water analysis. Bulletin Fisheries Research Board of Canada, Canada. p.201-203. |
| Wang L, Chen A H, Yang D Z, et al, 2005. Preliminary studies on the diurnal variation of metabolism of Perinereis aibuhitensis. Journal of Fisheries of China, 29 (1) : 48 –54. |
| Wang L, Chen A H, Zhao X, Wang L, Zhang J C, Zhou Y B, 2004. Effect of temperature and body weight on respiration and excretion in Perinereis aibuhitensis Grube. Journal of Dalian Fisheries University, 19 (3) : 176 –181. |
| Wells R M G, Jarvis P J, Shumway S E, 1980. Oxygen uptake, the circulatory system, and haemoglobin function in the intertidal polychaete Terebella haplochaeta (Ehelers). Journal of Experimental Marine Biology and Ecology, 46 (2) : 255 –277. Doi: 10.1016/0022-0981(80)90035-0 |
| Wu B L, Sun R P, Yang D J. 1985. The Nereidae (Polychaetous annelids) of the Chinese coast. China Ocean Press, Beijing, Spinger Verlag, Berlin, Heidelberg, New York Tokyo. 234p. |
| Xie X J, Sun R Y, 1991. Advances of The Studies on the specific dynamic action in fish. Acta Hydrobiologica Sinica, 15 (1) : 82 –90. |
| Yang D Z, Zhou Y B, Chen A H, Cao X B, Liu Y Z, 2011. The Artificial Breeding in Marphysa sanguinea (MONTAGU) in a Laboratory. Fisheries Science, 30 (9) : 572 –574. |
| Yu H Z, Zhu L Y, Zheng J H, 2005. Development of sex gonad and reproduction cycle of Marphysa sanguinea. Journal of Fishery Sciences of China, 12 (6) : 669 –674. |
| Zhou Y B, Li X Y, Qu Y, Song J, Zhang G F, 2002. The comparison of specific dynamic metabolism of triploid, Crassostrea gigas, with diploid. Oceanologia et Limnologia Sinica, 33 (6) : 663 –672. |