 2016, Vol. 34
Institute of Oceanology, Chinese Academy of Sciences
Article Information
- WANG Xiaoxia(王晓夏), XU Wenteng(徐文腾), LIU Yang(刘洋), WANG Lei(王磊), SUN Hejun(孙何军), WANG Lei(王磊), CHEN Songlin(陈松林)
- Quantitative trait loci detection of Edwardsiella tarda resistance in Japanese flounder Paralichthys olivaceus using bulked segregant analysis
- Chinese Journal of Oceanology and Limnology, 34(6): 1297-1308
- http://dx.doi.org/10.1007/s00343-016-5080-7
Article History
- Received Apr. 2, 2015
- accepted for publication Jul. 13, 2015
- accepted in principle Sep. 28, 2015


2 College of Marine Life Science, Shanghai Ocean University, Shanghai 200120, China;
3 Nanjing Agricultural University, Nanjing 210095, China;
4 College of Fisheries, Henan Normal University, Xinxiang 453007, China
As an important commercial marine species, Japanese flounder (Paralichthys olivaceus) is widely cultured in China, Japan and Korea. However, due to accumulating stress from biological, physical and chemical factors during the aquaculture process, it regularly suffers from a disease that inflicts heavy, annual financial losses on producers. Edwardsiellosis, one of the most deadly diseases of Japanese flounder, is caused by a Gram-negative bacterium, Edwardsiella tarda, which was first recorded from Japanese eel by Hoshina (1962). Infected fish eventually develop ascitesosis (Zhang et al., 2003), leading to death. Despite its devastating effect on aquaculture, possible defense mechanisms and variations in disease resistance are, as yet, unknown, which has restricted the breeding of a disease-resistant strain.
Intensive efforts have been devoted to the rapid identification of markers linked with specific regions of the genome. Bulked segregant analysis (BSA) is emerging as a powerful tool to fulfill this role. The method is based on populations showing segregation in particular alleles, separating them into different gene pools according to phenotypes. Compared with traditional association analysis, its efficiency and simplicity has made it very popular in QTL mapping and association analysis (Mackay and Caligari, 2000).
In recent years, BSA-QTL has been widely used to detect various economic traits in farmed fish species, with significant progress being made on discovering markers related to phenotypic characteristics such as sex, heat tolerance, disease resistance and growth. In the northern snakehead (Channa argus), Liu et al.(2011) found a sex-related simple sequence repeat (SSR) marker that only appeared in females and hoped to culture pure female hybrids using femalespecific DNA fragments. Lu et al.(2007), combining BSA, screened nine heat-related molecular markers in P. olivaceus, three loci of which were significantly negatively correlated with upper thermal tolerance and six loci were positively correlated. Another heatrelated molecular marker was detected in turbot, Scophthalmus maximus (Ma et al., 2011), which may facilitate the selective breeding of high temperatureresistant strains. In the yellow croaker (Larimichthys crocea), Liu et al.(2013) found two molecular markers closely related to growth traits, and showed that both markers were located in LG11, which is a candidate linkage group with important genes related to growth traits. Xu et al.(2009) uncovered a microsatellite marker positively related to growth in S. maximus, which could use to select stocks for growth performance at a molecular level. With reference to disease resistance, Fuji et al.(2006) and Fan et al.(2014) identified several markers for resistance to lymphocystis virus disease (LD) in Japanese flounder. Fuji et al.(2006) considered a marker on LG15 as a candidate locus for markerassisted selective breeding to improve LD resistance. Wang et al.(2014) observed two markers located on LG7 associated with resistance to the fish pathogen, Vibrio anguillarum, in P. olivaceus ; a QTL candidate region was also identified but specific genes were not scanned. However, to date, there have been no studies on SSR markers or QTL related to E. tarda resistance in Japanese flounder, which is hampering the development of a disease-resistant strain.
The present study was designed by combining QTL mapping with BSA to screen disease-resistant markers and loci in a family challenged with E. tarda in 2013. The selection of families of Japanese flounder resistant to V. anguillarum was initiated in 2007 and 2009, but families specifically resistant to E. tarda were not selected until 2013(Zhang et al., 2003) and were based on families resistant to V. anguillarum (Wang et al., 2014). In that year, 32 of 56 Japanese flounder families were infected with E. tarda by intraperitoneal injection and those with different resistant capability revealed (Fig. 1). It was hoped that the application of these markers would improve Japanese flounder culture and facilitate the selection of an edwardsiellosis-resistant strain.

|
| Figure 1 E. tarda challenge and disease classification for QTL JS: Japanese stock; RS: Resistant stock; YS: Yellow Sea wild stock; KS: Korean stock; F07: families established in 2007. |
Four populations of Japanese flounder, e.g. Japanese stock, Korean stock, Chinese stock (resistant of V. anguillarum) and Yellow Sea wild stock, were used to established different families. Families established in 2007 were challenged with V. anguillarum and, of these families, F0768 had the highest survival rate (60%). In 2009, families with maximum survival abilities were considered a fifth population, i.e., after V. anguillarum infection, F0915 was selected as having the highest survival rate (72.82%). F1333, which was selected for screening markers for resistance to both E. tarda and V. anguillarum, was a cross of F0768(♀) and F0915(♂), and was expected. A total of 106 juveniles from F1333 were challenged with E. tarda and a further 31 families were established and challenged in the same year as controls.
Six-month-old juveniles, ~10 cm in length, were cultured in a 0.28-m3 tank under flow-through conditions with a constant supply of fresh water at 19±1℃. E. tarda was injected intraperitoneally at a concentration of 3.69×10⁵ CFU/mL, and the number and total length of dead fry recorded every 2 h after infection until no further mortalities were observed.
Two models were adopted for QTL mapping (Table 1). In model 1, the 47 dead juveniles were designated as 1 and survivors as 0(Houston et al., 2008 ; Ozaki et al., 2010). In model 2, the 10 dead individuals recorded within 48 h were designated as 4, the 25 dead juveniles observed at 48-96 h were designated as 3, the eight dead juveniles observed at 96-144 h were designated 2, the four dead individuals observed at 144-192 h were classified as 1, and all survivors were classified as 0(Shoba et al., 2012 ; Wang et al., 2014).

According to the genetic linkage map of Song et al.(2012), 180 SSR markers with an average interval of 10 cM were used in this study; the corresponding microsatellite primers were synthesized by Beijing Genomics Institute. Genomic DNA from flounders was extracted by the classical phenol-chloroform method (Liu et al., 2005). Resistant bulks (RB) were generated by combining equal volumes of DNA from 15 survivors at a concentration of 50 ng/mL. Likewise, susceptible bulks (SB) were generated from the 15 individuals that died first.
2.3 PCR amplification and PAGEPolymerase chain reaction (PCR) amplification was performed in a 96-well plate at a 16-μL reaction volume containing 0.8 μL dNTP, 1.6 μL 10× buffer, 11.65 μL dd H2 O, 0.15 μL Taq, 0.4 μL of each primer and 1 μL DNA at a concentration of 50 ng/μL. The program was 95℃ for 10 min for initial denaturation, followed by 30 amplification cycles at 95℃ for 30 s, 59.5℃ for 30 s and 72℃ for 30 s, then 5 min at 72℃ for the final extension. PCR products were stored at 4℃ for further use. For polyacrylamide gel electrophoresis (PAGE), 4.0 μL of each denatured sample was loaded on 6% denaturing PAGE gels and electrophoresed under a 1 500-V constant voltage for 1.5 h (Wang et al., 2014). After electrophoresis, silver staining was performed and the band patterns analyzed.
2.4 VerificationWhen a band appeared in a specific pool, it was regard as a disease-related band pattern. The markers yielding disease-related band patterns were re-tested on all individuals in the same pool and those failing to reproduce the pattern were excluded: positive markers were confirmed in 106 individuals. Fisher's exact chisquare tests for the different alleles between RB and SB were performed with cross tabulation using SPSS 17.0 software (chi-square test 95% confidence interval of 0.05)(SPSS Inc., Chicago, IL).
2.5 QTL mapping and data analysisA genome scan was performed using the abovementioned 180 SSR markers in 30 animals in RB and SB, as well as their parents. Markers that displayed significant differences (via chi-square test) were genotyped in 106 challenged juveniles from F1333 and their parents - a total of 108 individuals. QTL analyses were performed using the two models described above. The logarithm of odds (LOD) threshold was fixed at 3.0, and the significant between marker and trait was set at P<0.05. Genotyped markers were mapped by JoinMap 4.0(Van Ooijen, 2006), and WinQTLCart 2.5 software (Wang et al., 2012) was used to analyze the QTLs associated with disease resistance.
3 RESULT 3.1 SSR and BSA analysisA total of 180 SSR markers (Supplementary Table) covering 24 linkage groups in Japanese flounder (Song et al., 2012) were used to identify polymorphic bands between the RBs and SBs. After scanning, six SSR markers, i.e., Scaffold 270-13812, Scaffold 404- 21594 and Scaffold v404-21589 in LG1, Scaffold 410-1885 in LG15, Scaffold 826-5003 and Scaffold 364-18000 in LG8, were detected (Fig. 2). This result suggests that these six markers may be associated with disease resistance.

|
| Figure 2 Six SSR markers (Scaffold 404-21589, Scaffold 404-21594, Scaffold 270-13812, Scaffold 410-1885, Scaffold 826-5003, Scaffold 364-18000) exhibited significant differences between the DNA pooled from the resistant and susceptible groups ( P<0.001) From left column to right column represents the resistant and susceptible group, respectively. |
To verify differences in microsatellite loci between the RBs and SBs, 30 individuals from the two bulks were genotyped (Fig. 3). The SSR alleles were named A, B, C and D, according to their decreasing length. For example, the longest allele of Scaffold 404-21594 was named Scaffold 404-21594-A, while the shortest was designated Scaffold 410-1885-D. Different alleles were tested via chi-square tests in SPSS 17.0; SSR markers showing differences between the two bulks are listed in Table 2. From the chi-square test results, Scaffold 410-1885-D (P =0.067 9), Scaffold 826-5003(P =0.067 9) and Scaffold 364-18000(P =0.067 9) displayed no clear differences (P>0.05) between the two bulks, while Scaffold 404-21594(P =0.028 1), Scaffold 404-21589(P =0.009 9) and Scaffold 270-13812(P =0.028 1) showed significant differences (P<0.05). The frequency of Scaffold 404- 21589-B in the RB was 80% compared to 33.3% in the SB. Scaffold 404-21594-C and Scaffold 270- 13812-B had the same frequency (RB at 73.3% versus SB at 33.3%): their frequency in RB was significantly higher than in SB (P =0.028 1, <0.05) which means the alleles were more associated with resistant character than susceptible one. In contrast, Scaffold 404-21594-D and Scaffold 270-13812-A displayed the opposite pattern (RB at 26.7% versus SB at 66.7%), where the frequency in RB was significantly lower (P =0.028 1, <0.05). As further identification was required for all individuals, 106 challenged juveniles were genotyped. With the exception of Scaffold 410-1885-B, the other three markers were still significantly different (Fig. 4). For example, of 59 resistant juveniles, Scaffold 404-21594-C was found to have different bands in 42 individuals at a frequency of 71.2%; whereas 15 of 47 susceptible juveniles had different bands at a frequency of 32%. All three markers showed significant differences between the two bulks (P<0.001)(Table 3). Therefore, it was concluded that these three markers in LG1 may be closely associated with resistance to E. tarda infection but had no relationship with V. anguillarum in LG7(Wang et al., 2014)


|
| Figure 3 Amplification of Scaffold 404-21594, Scaffold 404-21589, Scaffold 270-13812 and Scaffold 410-1885 in 30 individuals from the RBs and SBs M: marker; R: resistant individuals; S: susceptible individuals; ♀ and ♂ are the parents. |

|
| Figure 4 Amplification of Scaffold 404-21594, Scaffold 404-21589 and Scaffold 270-13812 in 59 survivors and 47 dead individuals M: marker; R: resistant individuals; S: susceptible individuals; ♀ and ♂ are the parents. |

All 43 SSR markers in LG1 were genotyped in the 106 challenged juveniles because the three candidate markers (Scaffold 404-21594, Scaffold 404-21589 and Scaffold 270-13812) were located in LG1, and 24 of them were used to construct a new, small linkage map (Fig. 5). The length of the new linkage map was 92.4 cM. There was only one significant marker at the 5% and 0.01% levels, while there were seven and nine significant markers at the 1% and 0.1% levels, respectively, in model 1. These 18 markers were responsible for 0-15.75% of the phenotypic variance (R2) and the additive effect ranged from -0.379 26 to 0.413 398. In model 2, there were eight and nine markers at the 5% and 1% levels, respectively, accounting for 0.01%-10.35% of the phenotypic variance (R2) and from -1.224 71 to 1.252 39 of the additive effect. By comparing the two models, the highest R2 value and additive effect were found at Scaffold 790-4911(Table 4).

|
| Figure 5 Small linkage1(LG1) map and QTLs locations |
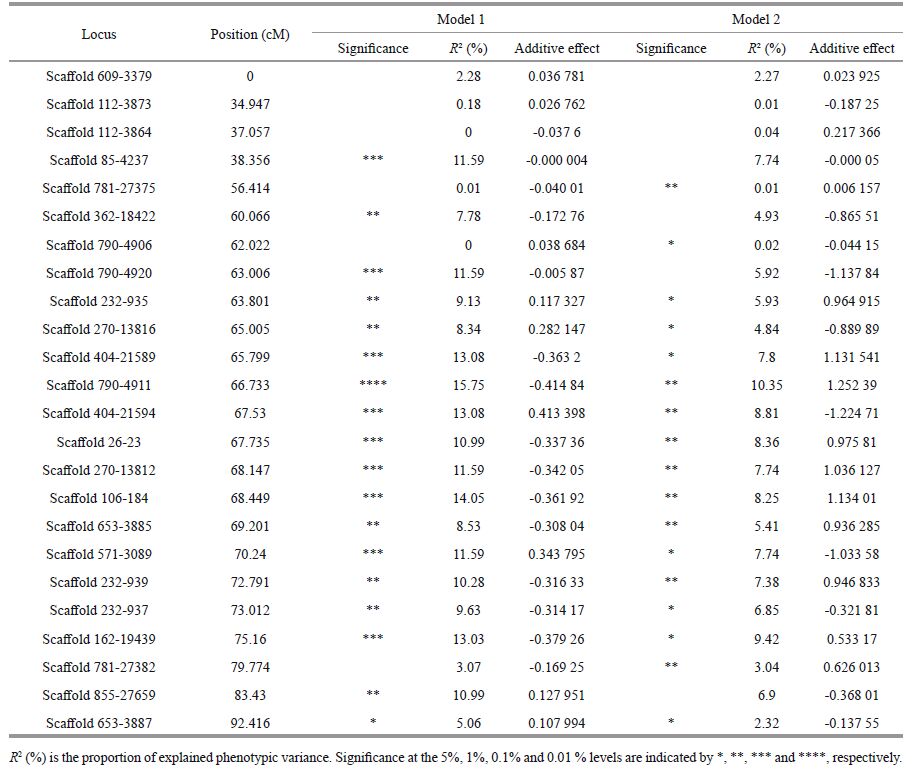
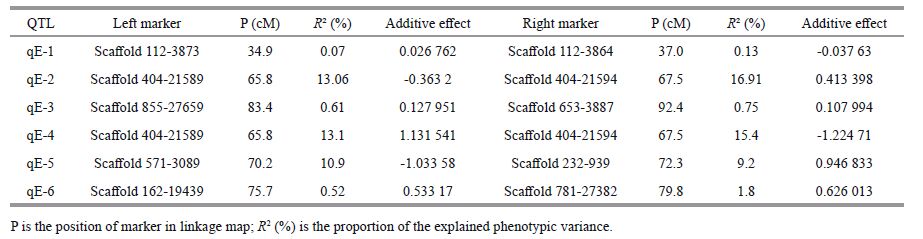
Composite interval mapping (CIM) was adopted to re-analyze the association between the genotyped markers and disease resistance. A QTL with a LOD ≥3 was considered a promising candidate. Altogether, six QTLs were identified on LG1. Of these six QTLs, qE-1, qE-2 and qE-3 constructed in model 1, explained 74.3%, 17.0% and 77.1% of R2, respectively, with additive effects of -0.997 43, -0.414 84 and 0.997 465, respectively, and peaked at 36.1, 66.7 and 86.5 cM with LOD scores of 58.4, 3.5 and 55.7, respectively. The QTLs - qE-4, qE-5 and qE-6 - constructed in model 2 explained 16.0%, 89.5% and 77.4% of R2, respectively, with additive effects of 1.252 4, -2.968 and 2.894, respectively, and peaked at 66.7, 71.3 and 77.3 cM with LOD scores of 3.4, 21.5 and 13.7, respectively (Table 5 and Fig. 6). The phenotypic variance (R2) of the SSR markers located adjacent to the QTLs ranged from 0.07% to 16.91%. Scaffold 404-21594 explained the highest level of R2(16.91%)(Table 6). Coincidentally, it was found that qE-2 in model 1 and qE-4 in model 2 were both located at the same position of 66.7 cM, close to Scaffold 790-4911. After gene scanning of the Japanese flounder genome, two immune genes, Gvin1(interferon-induced very large GTPase 1) inside qE-2 and qE-4, and IL-8(interleukin-8) inside qE-5 were identified.


|
| Figure 6 LOD curves of six QTLs (qE-1, qE-2, qE-3 in model 1 and qE-4, qE-5, qE-6 in model 2) Abscissa indicates the relative position on the linkage groups; vertical coordinates indicate the LOD values. The red line, with an LOD value of 3.0, represents the significant threshold of QTLs. Figures in parentheses represents group, position and LOD value, respectively. |
A thorough understanding of the genetic basis of pathogenic disease mechanisms is essential to improve production of aquaculture fish species, such as Japanese flounder (Paralichthys olivaceus). The detection of candidate genes by QTL mapping could provide some clues on the pathogenicity of disease organisms. To reduce extraneous factors, in this study, 6-month-old juvenile fish fry were selected and cultured in the same pond. Bulks of phenotypic extremes were made by obtaining samples from surviving and dead individuals (Wang et al., 2014).
Currently, a large number of markers linked to quantitative traits have been found in fish species using BSA (Lee et al., 2004 ; Keyvanshokooh et al., 2007 ; Wang et al., 2009a, b ; Liu et al., 2011). The technique is cost-efficient, simple to use and timesaving, which will greatly advance research in this field. In our study, three markers - Scaffold 404- 21594, Scaffold 404-21589 and Scaffold 270-13812 in LG1 - potentially linked to a disease-resistance gene in Japanese flounder were identified using BSA combined to SSR and single-marker analysis. However, none of the markers was able of fully demonstrating disease-resistance, because disease traits are quantitative and always controlled by several rather than a single gene. The F1333 was established based on familial resistance to V. anguillarum, but the three screened markers were located on LG1, and not on LG7, where the markers associated with resistance of V. anguillarum are located (Wang et al., 2014). This indicated that these markers were only associated with resistance to E. tarda rather than E. tarda and V. anguillarum ; in other words, the identified markers had nothing to do with V. anguillarum. Despite some deviation, the overall trend indicated that individuals may have the resistance gene but are not phenotypically resistant to the disease, which is in agreement with the studies of Xu et al.(2009) and Fan et al.(2014). The most economically important quantitative traits are continuously changing because they were usually controlled by multiple genes and easily influenced by environmental factors, and there is no clear association between phenotype and genotype (Xu et al., 2009 ; Yue, 2014). Unfortunately, in this study, only one family displayed significant differences between RB and SB. Thus, further evidence is required to verify the accuracy and feasibility of the process in other populations (Geldermann, 1975 ; Wang et al., 2008 ; Moen et al., 2009). Once the presence of resistance gene markers is confirmed, they can be used in marker-assisted selective (MAS) breeding.
Two different models were used for phenotypic analysis in this study, as described by Wang et al.(2014). Model 1 is normally used to analyze quantitative traits controlled by a few major genes, while model 2 is always used to analyze traits controlled by multiple minor genes. Each model identified three QTLs. Both qE-2 and qE-4 were located at position 66.7 cM, suggesting that this area may be more highly linked to E. tarda disease resistance than other QTLs. Thus, this region should be the primary focus for screening disease-resistant candidate genes. However, the possibilities of immune genes being located in other QTLs should not ignore; nevertheless, this study failed to located genes in qE- 1, qE-3 or qE-6.
Gvin1, the prototype member of the newest family of very large IFN-inducible GTPases (VLIG)(Joyce et al., 2009), is a member of the GTPase family. It is regulated by IFN-γ-induced genes, and is involved in the survival of pathogens residing in phagosomes vacuoles (Singh et al., 2007). However, in Japanese flounder, the relationship between Gvin1 and E. tarda is unclear. In our study, this gene was located inside qE-2 and qE-4, which provides solid evidence to further uncover its novel role in E. tarda resistance. IL-8 is also a promising candidate gene because it is located in the qE-5 region in LG1 and was shown to be expressed in specific tissues, such as head kidney and spleen, after stimulation in Japanese flounder (Lee et al., 2001). Produced by peripheral blood mononuclear cells (Matsushima et al., 1988), macrophages (Goodman et al., 1991), lymphocytes (Gregory et al., 1988) and epithelial cells (Nakamura et al., 1991), the targets of IL-8 are also located in multiple cells. Similar to Gvin1, further detailed analysis of the relationship between IL-8 and E. tarda resistance in Japanese flounder is necessary.
In this study, the highest R2 value was 15.75%, which fails to meet the requirements for MAS breeding. In addition, the number of microsatellite markers is insufficient and improved high-density, integrated genetic maps are urgently required, which should include more families or populations (Yue, 2014), more accurate phenotype collation data and better positioning methods. As emerging markers, single nucleotide polymorphisms (SNPs) are more widely distributed and are more tightly linked to genes compared with SSRs. Using next-generation sequencing (NGS) techniques, it is now possible to develop a large number of SNPs for linkage mapping (Miller et al., 2007, 2012 ; Davey et al., 2011). Genome-wide association studies (GWAS)(Hirschhorn et al., 2005) are currently being applied to analyze individual SNP variations within the whole genome. The process can detect minute effects of marker-trait associations, including the specific genes associated with disease; however, the high financial cost is limiting its application (Mccarthy et al., 2008). As an alternative, the method of combining QTL with GWAS research is relatively cost-effective and efficient, so may play a more significant in MAS breeding in the future.
5 CONCLUSIONIn conclusion, three SSR markers associated with disease resistance to E. tarda in Japanese flounder were detected and reported for the first time. Future studies should focus on screening for disease-resistant genes located between the flanks of QTLs. Moreover, a high-density genetic linkage map (e.g. an SNP map) is required to identify more markers highly linked with E. tarda resistant QTLs. These development and advances would greatly facilitate the breeding of an edwardsiellosis-resistant cultivar of Japanese flounder.
| Davey J W, Hohenlohe P A, Etter P D, Boone J Q, Catchen J M, Blaxter M L, 2011. Genome-wide genetic marker discovery and genotyping using next-generation sequencing. Nat. Rev. Genet., 12 (7) : 499 –510. Doi: 10.1038/nrg3012 |
| Fan C X, Chen S L, Wang L, Liu Y, Zhang Y P, 2014. Screening and identification of SSR markers associated with lymphocystis disease resistance in Japanese flounder(Paralichthys olivaceus). Journal of Fisheries of China, 38 (4) : 586 –593. |
| Fuji K, Kobayashi K, Hasegawa O, Coimbra M R M, Sakamoto T, Okamoto N, 2006. Identification of a single major genetic locus controlling the resistance to lymphocystis disease in Japanese flounder (Paralichthys olivaceus). Aquaculture, 254 (1-4) : 203 –210. Doi: 10.1016/j.aquaculture.2005.11.024 |
| Geldermann H, 1975. Investigations on inheritance of quantitative characters in animals by gene markers I. Methods. Theoretical and Applied Genetics, 46 (7) : 319 –330. Doi: 10.1007/BF00281673 |
| Goodman R B, Forstrom J W, Osborn S G, Chi E Y, Martin T R, 1991. Identification of two neutrophil chemotactic peptides produced by porcine alveolar macrophages. J.Biol. Chem., 266 (13) : 8 455 –8 463. |
| Gregory H, Young J, Schröder J M, Mrowietz U, Christophers E, 1988. Structure determination of a human lymphocyte derived neutrophil activating peptide (LYNAP). Biochem.Biophys. Res. Commun., 151 (2) : 883 –890. Doi: 10.1016/S0006-291X(88)80364-4 |
| Hirschhorn J N, Daly M J, 2005. Genome-wide association studies for common diseases and complex traits. Nat. Rev.Genet., 6 (2) : 95 –108. |
| Hoshina T, 1962. On a new bacterium, Paracolobatrum anguillimartiferum n. sp.. Bull. Japan. Soc. Sci. Fish., 28 (2) : 162 –164. Doi: 10.2331/suisan.28.162 |
| Houston R D, Haley C S, Hamilton A, Guy D R, Tinch A E, Taggart J B, McAndrew B J, Bishop S C, 2008. Major quantitative trait loci affect resistance to infectious pancreatic necrosis in Atlantic salmon (Salmo salar). Genetics, 178 (2) : 1 109 –1 115. Doi: 10.1534/genetics.107.082974 |
| Joyce E A, Popper S J, Falkow S, 2009. Streptococcus pneumoniae nasopharyngeal colonization induces type I interferons and interferon-induced gene expression. BMC Genomics, 10 (1) : 404 . Doi: 10.1186/1471-2164-10-404 |
| Keyvanshokooh S, Pourkazemi M, Kalbassi M R, 2007. The RAPD technique failed to identify sex-specific sequences in beluga (Huso huso). J. Appl. Ichthyol., 23 (1) : 1 –2. Doi: 10.1111/jai.2007.23.issue-1 |
| Lee B Y, Hulata G, Kocher T D, 2004. Two unlinked loci controlling the sex of blue tilapia (Oreochromis aureus). Heredity, 92 (6) : 543 –549. Doi: 10.1038/sj.hdy.6800453 |
| Lee E Y, Park H H, Kim Y T, Chung J K, Choi T J, 2001. Cloning and sequence analysis of the interleukin-8 gene from flounder (Paralichthys olivaceous). Gene, 274 (1-2) : 237 –243. Doi: 10.1016/S0378-1119(01)00600-X |
| Liu G Y, Chen K C, Zheng G M, Zhu X P, Zhao J, Xu P, Sun X W, 2011. Screening and identification of female-specific DNA fragments in Channa argus using SSR-BSA. Journal of Fisheries of China, 35 (2) : 170 –175. |
| Liu X D, Sui B L, Wang Z Y, Cai M Y, 2013. Screening and verification of microsatellite markers closely related with rapid growth traits in Large Yellow Croaker Larimichthys crocea. Acta Hydrobiologica Sinica, 37 (6) : 1 036 –1 043. |
| Liu Y G, Chen S L, Li B F, 2005. Genetic structure analysis for the cultured stock of Japanese flounder (Paralichthys olivaceus) by microsatellite marker. Marine Fisheries Research, 26 (5) : 27 –33. |
| Lu Z L, Chi X Y, Wang Y Q, Shen Y B, Zheng Z H, Song S Y, 2007. The screening of microsatellites molecular markers with correlationship to heat-resistance of Paralichthys olivaceus. Journal of Xiamen University (Natural Science), 46 (3) : 396 –402. |
| Ma A J, Xu K, Huang Z H, Wang X A, 2011. Screening of microsatellite molecular marker associated with heatresistance of Turbot (Scophthalmus maximus L. ).Advances in Marine Science, 29 (3) : 370 –378. |
| Mackay I J, Caligari P D S, 2000. Efficiencies of F2 and backcross generations for bulked segregant analysis using dominant markers. Crop Science, 40 (3) : 626 –630. Doi: 10.2135/cropsci2000.403626x |
| Matsushima K, Morishita K, Yoshimura T, Lavu S, Kobayashi Y, Lew W, Appella E, Kung H F, Leonard E J, Oppenheim J J, 1988. Molecular cloning of a human monocytederived neutrophil chemotactic factor (MDNCF) and the induction of MDNCF mRNA by interleukin 1 and tumor necrosis factor. J. Exp. Med., 167 (6) : 1 883 –1 893. Doi: 10.1084/jem.167.6.1883 |
| Mccarthy M I, Abecasis G R, Cardon L R, Goldstein D B, Little J, Ioannidis J A, Hirschhorn J N, 2008. Genomewide association studies for complex traits:consensus, uncertainty and challenges. Nat. Rev. Genet., 9 (5) : 356 –369. Doi: 10.1038/nrg2344 |
| Miller M R, Brunelli J P, Wheeler P A, Liu S X, Rexroad III C E, Palti Y, Doe C Q, Thorgaard G H, 2012. A conserved haplotype controls parallel adaptation in geographically distant salmonid populations. Mol. Ecol., 21 (2) : 237 –249. Doi: 10.1111/j.1365-294X.2011.05305.x |
| Miller M R, Dunham J P, Amores A, Cresko W A, Johnson E A, 2007. Rapid and cost-effective polymorphism identification and genotyping using restriction site associated DNA (RAD) markers. Genome Research, 17 (2) : 240 –248. Doi: 10.1101/gr.5681207 |
| Moen T, Baranski M, Sonesson A K, Kjøglum S, 2009. Confirmation and fine-mapping of a major QTL for resistance to infectious pancreatic necrosis in Atlantic salmon (Salmo salar):population-level associations between markers and trait. BMC Genomics, 10 (1) : 368 . Doi: 10.1186/1471-2164-10-368 |
| Nakamura H, Yoshimura K, Jaffe H A, Crystal R G, 1991. Interleukin-8 gene expression in human bronchial epithelial cells. J. Biol. Chem., 266 (29) : 19 611 –19 617. |
| Ozaki A, Okamoto H, Yamada T, Matuyama T, Sakai T, Fuji K, Sakamoto T, Okamoto N, Yoshida K, Hatori K, Araki K, Okauchi M, 2010. Linkage analysis of resistance to Streptococcus iniae infection in Japanese flounder(Paralichthys olivaceus). Aquaculture, 30 (S1) : S62 –S67. |
| Shoba D, Manivannan N, Vindhiyavarman P, Nigam S N, 2012. SSR markers associated for late leaf spot disease resistance by bulked segregant analysis in groundnut(Arachis hypogaea L. ). Euphytica, 188 (2) : 265 –272. Doi: 10.1007/s10681-012-0718-9 |
| Singh S R, Liu W, Hou S X, 2007. The adult Drosophila malpighian tubules are maintained by multipotent stem cells. Cell Stem Cell, 1 (2) : 191 –203. Doi: 10.1016/j.stem.2007.07.003 |
| Song W T, Pang R Y, Niu Y Z, Gao F T, Zhao Y W, Zhang J, Sun J, Shao C W, Liao X L, Wang L, Tian Y S, Chen S L, 2012. Construction of high-density genetic linkage maps and mapping of growth-related quantitative trail loci in the Japanese flounder (Paralichthys olivaceus). PLoS One, 7 (11) : e50404 . Doi: 10.1371/journal.pone.0050404 |
| Van Ooijen J W. 2006. JoinMap 4.0:software for the calculation of genetic linkage maps in experimental populations.Kyazma BV, Wageningen, Netherlands. 56p. |
| Wang C M, Lo L C, Feng F, Zhu Z Y, Yue G H, 2008. Identification and verification of QTL associated with growth traits in two genetic backgrounds of Barramundi(Lates calcarifer). Anim Genet., 39 (1) : 34 –39. Doi: 10.1111/age.2008.39.issue-1 |
| Wang D, Mao H L, Chen H X, Liu H Q, Gui J F, 2009a. Isolation of Y-and X-linked SCAR markers in yellow catfish and application in the production of all-male populations. Anim. Genet., 40 (6) : 978 –981. Doi: 10.1111/age.2009.40.issue-6 |
| Wang D, Mao H L, Peng J X, Li X Y, Zhou L, Gui J F, 2009b. Discovery of a male-biased mutant family and identification of a male-specific SCAR marker in gynogenetic gibel carp Carassius auratus gibelio. Progress in Natural Science, 19 (11) : 1 537 –1 544. Doi: 10.1016/j.pnsc.2009.04.008 |
| Wang L, Fan C X, Liu Y, et al, 2014. A genome scan for quantitative trait loci associated with Vibrio anguillarum infection resistance in Japanese flounder (Paralichthys olivaceus) by bulked segregant analysis. Mar. Biotechnol., 16 (5) : 513 –521. Doi: 10.1007/s10126-014-9569-9 |
| Wang S, Baston C J, Zeng Z B. 2012. Windows QTL cartographer V2.5011. Department of Statistics, North Carolina State University, Raleigh, NC. 88p. |
| Xu K, Ma A J, Wang X A, Lei J L, Chen S L, Hou S Y, Huang Z H, 2009. Microsatellites molecular markers and the correlation to growth trait of Scophthalmus maximus. Oceanologia et Limnologia Sinica, 40 (5) : 577 –583. |
| Yue G H, 2014. Recent advances of genome mapping and marker-assisted selection in aquaculture. Fish and Fisheries, 15 (3) : 376 –396. Doi: 10.1111/faf.2014.15.issue-3 |
| Zhang Y P, Chen S L, Sun H J, Wang L, Fan C X, Yu Y, Zhang W T, Yang Y M, Zhang Y Z, 2014. Establishment and analysis of Japanese flounder (Paralichthys olivaceus) families with enhanced disease resistance to Edwardsiella tarda. Journal of Fisheries of China, 38 (11) : 1 917 –1 925. |
| Zhang Y Y, Wang W N, Wang J X, Wang A L, 2003. Research on Edwardsiellosis in Japanese flounder. Fisheries Science, 22 (1) : 34 –36. |