 2016, Vol. 34
Institute of Oceanology, Chinese Academy of Sciences
Article Information
- BAI Peng(白鹏), GU Yanzhen(顾艳镇), LI Peiliang(李培良), WU Kejian(吴克俭)
- Modelling the upwelling off the east Hainan Island coast in summer 2010
- Chinese Journal of Oceanology and Limnology, 34(6): 1358-1373
- http://dx.doi.org/10.1007/s00343-016-5147-5
Article History
- Received Jun. 17, 2015
- accepted for publication Aug. 15, 2015
- accepted in principle Sep. 18, 2015


2 College of Information Science and Engineering, Ocean University of China, Qingdao 266100, China
The South China Sea (SCS), which is located in the northwest Pacific Ocean, is a tropical semi-closed marginal sea and has an area of 3.3 million km2(Morton and Blackmore, 2001). During the Northern Hemisphere summer, the southwest East Asia monsoon dominates the SCS (Su, 2004). The prevailing monsoon drives a strong coastal boundary current flowing from the Vietnam coast northward to the southeast Hainan Island coast and northeastward to the Guangdong coast (Su, 2004). Accompanying the southwest monsoon and coastal boundary current, upwelling is one of the most significant phenomena in the western SCS continental shelf areas. As early as the 1960s, Wyrtki (1961) investigated the Vietnam coastal seasonal upwelling by analyzing the decreased sea surface temperature (SST) in June and July. For wind-induced upwelling, wind-driven Ekman transport is well known to trigger the upwelling. Meanwhile, theoretical studies on the upwelling reveal the importance of topography on wind-induced coastal upwelling. It is believed that the alongshore-varying topography leads to the formation of upwelling centers along the coast by increasing upwelling on the downslope sides of topographic highs and decreasing upwelling on the upslope sides of topographic highs. However, the topographic variation redistributes it unevenly along the coast without changing the total amount of upwelled water. Besides, cross-shore slope plays a significant role in maintaining the meandering structure of the alongshore currents, and in turn, the upwelling is modulated (Song et al., 2001 ; Song and Chao, 2004). Chen et al.(2013) found that steeper shelf slope led to narrower cross-shore width of surface Ekman divergence and larger vertical velocity. The interaction between particular topography and current could also generate upwelling. Lee et al.(1999) captured the phenomenon that upwelling occurred within the eddies generated by the spring tides in a semi-enclosed basin. Matano and Palma (2008) found that the shelfbreak upwelling generated by the downstream divergence of the slope currents had a magnitude proportional to the volume transport of that current. When flow enters the submarine canyon, upwelling occurs, and the intensity of the upwelling is determined by the strength of the flow, stratification, Coriolis parameter and topographic shape (Allen and Hickey, 2010 ; Howatt and Allen, 2013). By forcing the ocean with different resolution upwelling-favorable wind, Song et al.(2011) found that the upwelling cell and the upwelling source water depended significantly on the wind stress curl. When coastal upwelling is generated, air-sea interaction occurs: Sea-breeze circulation could be intensified by the enhancement of the land-sea temperature gradient due to cold water upwelling near the coast; coastal upwelling, in turn, could also be modulated by the seabreeze (Franchito et al., 2008). Coastal upwelling is not a long lasting but an intermittent phenomenon, and the intensity is influenced by the upwelling-favorable winds, the characteristics of the background current and the local topography (Rossi et al., 2013). In brief, the dominant factors for a coastal upwelling should be within the wind, topography, background currents and the stratification.
For the western SCS continental shelf areas, there exist three typical strong summer upwelling regions: the upwelling offthe South Vietnam coast (Xie et al., 2003 ; Kuo et al., 2004 ; Dippner et al., 2007 ; Xie et al., 2007 ; Chen et al., 2012), the upwelling offthe east Guangdong coast (Gan et al., 2009a, b ; Wang et al., 2012) and the upwelling offthe east (including southeast and northeast) Hainan Island (noted as EHIU). Su and Pohlmann (2009) employed HAMburg Shelf Ocean Model (Backhaus, 1985 ; Pohlmann, 1996a, b) to investigate the EHIU. They found that southwest and south winds were the main driving force for the EHIU and the intensity of EHIU was determined by the strength of the upwelling-favoring wind. Further, topographic variation caused upwelling centers at the downstream side of topographic highs and a downwelling center at the upstream side which in turn lead to density variation (Su and Pohlmann, 2009). Finally, additional pressure gradients generated by this density variation helped to advect the upwelling toward northeast. Study by Jing et al.(2009) indicates that not only the offshore Ekman transport driven by the alongshore wind stress, but also the Ekman pumping induced by wind stress curl has a crucial effect on the EHIU. The EHIU was also closely related with large-scale air-sea interaction, the anticyclonic atmosphere circulation anomaly over the SCS intensified the EHIU but suppressed the upwelling offthe South Vietnam coast in 1998 summer following the EI Niño (Jing et al., 2011). Li et al.(2012) used the Princeton Ocean Model to investigate the spatial structure and variation of EHIU, their results suggest that the annual variation of the EHIU was dominated not only by the local alongshore wind stress but also by the large-scale circulation.
For the EHIU, previous investigations have clarified its main characters, but mainly focus on its seasonal or annual features. There is almost no study focusing on a synoptic-scale EHIU events and the short-term characteristics of the EHIU remain unclear. Besides, previous investigations on the EHIU always ignored the locally strong tidal process (Su and Pohlmann, 2009 ; Li et al., 2012). This might be acceptable when discussing long-term EHIU features but not be appropriate when investigating short-term EHIU events. In this paper, we employed the high-resolution Regional Ocean Modeling System (ROMS) to investigate a synoptic-scale EHIU event captured by the Moderate Resolution Imaging Spectroradiometer (MODIS) sea surface temperature (SST) images in summer 2010. The remarkable cooler-water core (CWC) formed in the east Qiongzhou Strait areas with large SST gradient on its boundary draws our interest. Our results imply that tides play a critical role in the formation of CWC. This paper is organized as follows: Section 2 describes the data and methodology employed in this paper, Section 3 investigates the EHIU based on the MODIS observation, Section 4 displays the numerical modeling results, while section 5 and 6 present the discussions and conclusions, respectively.
2 DATA AND METHODLOGY 2.1 Satellite remote sensing dataMany years of Moderate Resolution Imaging Spectroradiometer (MODIS) SST data were processed in order to identify upwelling events. An EHIU event was well captured during 1 Jul. to 5 Jul. 2010. The 4 km×4 km and 9 km×9 km horizontal resolution daily SST data are available on the OceanColor webpage (http://oceancolor.gsfc.nasa.gov/) and the former is chosen to recognize more detailed sea surface structure of upwelling events. The Terra and the Aqua satellites are equipped with MODIS. Thus, the SST data provided by both MODIS-Terra and MODIS-Aqua are processed and the one with higher data quality and less missing data in each case is used in this paper.
The Advanced Scatterometer (ASCAT) wind data (Figa-Saldaña et al., 2002) provided by the Remote Sensing System was used in this study. ASCAT is a C-band scatterometer and there are two antennae on opposite sides of this instrument. Thus, two 500-km wide swaths of observations separated by a 360-km gap are available (http://www.remss.com/missions/ascat). The wide observing coverage is of advantage for revealing the wind patterns corresponding to an upwelling event. Moreover, it could also be used to check the accuracy of the European Centre for Medium-range Weather Forecasts (ECMWF) wind product.
2.2 Ocean model descriptions and configurationsThe MODIS SST images are insufficient to illustrate the 3-D structure and the dynamical process of the EHIU since they present only the surface features of the EHIU. The Regional Ocean Modeling System (ROMS)(Shchepetkin and McWilliams, 2005) for 3-D, time-dependent oceanographic flows governed by hydrostatic primitive equations is employed to make a more comprehensive study of the EHIU. The MY-2.5 turbulent closure scheme by Mellor and Yamada (1982) is adapted for parameterizing the vertical mixing. With a 218×440-point horizontal grid and 20 levels in the stretched terrain-following coordinate (s-coordinate)(Song and Haidvogel, 1994), the model domain has a 3 km horizontal resolution and covers the entire region that might be affected by the EHIU. Besides, θ s =5.0 and θ b =0.4 are chosen to enhance the resolution in both the surface and the bottom boundary layers. The bathymetry is derived from the General Bathymetric Chart of the Oceans. The topography is gently smoothed to avoid horizontal pressure gradient force errors (Beckmann and Haidvogel, 1993 ; Rivas and Samelson, 2011). Then the minimum depth is set to 5 m to ensure model stability in the near-shore areas.
The surface wind stress, heat fluxes and fresh water fluxes derived from the ERA-interim global reanalysis data with 0.125°×0.125° spatial resolution and 3-hourly temporal resolution are taken as the atmospheric forcing of the model. Both wind stress and wind stress curl contribute to the costal upwelling system (Jing et al., 2009 ; Song et al., 2011), hence using high spatial-temporal resolution wind to capture the structure of wind stress and wind stress curl in coastal areas is of necessity. The initial and boundary conditions are interpolated from the Hybrid Coordinate Ocean Model global simulation data (temperature, salinity, 3-D velocity). The model integrates from 1 Jan. 2010 to 31 Dec. 2010 and spins up for 10 repetitions to reach a quasi-equilibrium state without tides during this period. Then, in the CONTROL RUN, taking the initial and boundary conditions extracted from the 10th year model outputs, the atmospheric forcing derived from the ERAinterim global reanalysis data and the tidal harmonic constants of 8 tidal constituents (M2, S2, K1, O1, K 2, N2, P1, Q1) interpolated from the OSU TOPEX/ Poseidon Global Inverse Solution data, the model integrates from 21 Jun. to 29 Jul. 2010, during which period the EHIU event was captured by MODIS SST images.
2.3 Argo temperature and salinity dataCoastal upwelling is characterized by lower sea surface temperature and higher surface salinity. It also has complicated vertical structure. However, no insitu temperature and salinity vertical observations were found in the EHIU area during the period from 1 Jul. to 5 Jul. 2010. Hence, Argo temperature and salinity profiles were used to validate the ROMS results. The Argo data used in this paper is provided by the Global Ocean Data Assimilation Experiment project. There are 5 Argo T-S profiles meeting both the space (red triangles in Fig. 1) and the time limits at the same time. They are all derived from No.2901170 Argo float observations and this paper selects the delayed-mode data rather than the real-time data because the former one is more accurate (http://www.argo.ucsd.edu/FAQ.html). The No. 2901170 Argo float started to send back data every 3 days from 16 Jul. 2010 and its diving depth was ~1 km.

|
| Figure 1 The model domain (tilted rectangle in left chart) and bathymetry contours (unit: m) of the study area |
Figure 2 displays the SST maps around the Hainan Island on 1 Jul.(Fig. 2a), 3 Jul.(Fig. 2c), 5 Jul.(Fig. 2e)2010 captured by MODIS, from which the EHIU could be identified by lower SST like-plume that was distributed offboth the southeast and the northeast coast of the Hainan Island. Obviously, the EHIU evolved with time and varied in intensity as well as shape from 1 Jul. to 5 Jul. During this period, the dominant wind directions of the summer monsoon that occupied the EHIU area (109.5°-113°E, 18°- 23°N) were southeast, south and southwest according to the ASCAT winds (see Fig. 3). These winds were upwelling-favorable according to previous study (Jing et al., 2009 ; Su and Pohlmann, 2009 ; Li et al., 2012). The ECMWF winds are displayed in Fig. 3, which are in reasonably good agreement with the ASCAT winds. Therefore, it is reasonable to force the ROMS with ECMWF winds. The EHIU was identified by the 28.9℃ isotherm. It extended as far as 393 km on average in the northeast direction, 140 km in the northwest direction and covered an area of 22 815 km2 on average. Its area kept decreasing at a rate of ~600 km2 /day.

|
| Figure 2 The MODIS SST images on (a)1 Jul., (c)3 Jul., (e)5 Jul. 2010 and ROMS simulated SST fields on (b)1 Jul., (d)3 Jul., (f)5 Jul. 2010, respectively |

|
| Figure 3 The area-averaged ASCAT and ECMWF wind vectors time series in the EHIU region (109.5°-113°E, 18°-23°N) from 23 Jun. to 05 Jul. 2010 |
An interesting phenomenon is that there existed a cooler-water core (CWC) in the EHIU area located at the east Qiongzhou Strait mouth area on 1 Jul. 2010. We choose the closed 27.5℃ isotherm to determine the CWC area since it could separate the CWC from the EHIU clearly. The CWC was included in the EHIU but characterized by at least 1℃ lower SST than the other part. It vanished quickly in the next few days. The temperature gradient on the CWC boundary was larger than 0.06℃/km and even reached to 0.37℃/km in some area. The maximum length in zonal direction of the CWC was 102 km, longer than 52 km in meridional direction. Then the CWC covered an area of 2 400 km2 and almost occupied the whole east Qiongzhou Strait mouth region with much warmer water on both sides. The CWC arouses our great interest: what was the mechanism of the CWC, what were the governing factors for the generation of the CWC and how did they work? The MODIS images are insufficient to resolve these problems and in the following sections the ROMS is used for assisting in investigating the CWC.
4 MODELING THE UPWELLING OFF THE EAST HAINAN ISLAND COAST 4.1 Model validationTidal processes are quite strong in the Qiongzhou Strait and the Beibu Gulf (Cao and Fang, 1990 ; Sun and Huang, 2001 ; Shi et al., 2002). The influence of the powerful tides on circulation, vertical mixing and other dynamical processes could not be overlooked, especially for synoptic-scale event. Hence, we compared tidal harmonic constants between the model results (after harmonic analysis) and historical observations at 20 stations (blue triangles in Fig. 1). Fig. 4 suggests a generally satisfactory modeling of the 4 dominant tide constituents (K1, O1, M2, S2).

|
| Figure 4 Comparison between the observed and simulated harmonic constants of K1, O1, M2 and S2, (a) for amplitude contrast and (b) for phase contrast |
For evaluating the model temperature and salinity (T - S) performance, a model skill defined as (Willmott, 1981 ; Warner et al., 2005 ; Zhong and Li, 2006)
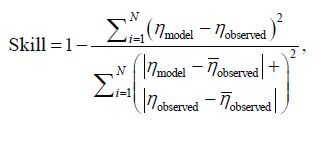 (1)
(1)was brought in, where ηmodel and ηobserved represent the simulated and observed elements. Skill=1 means perfect simulation while Skill=0 means worst simulation. The detailed comparisons of T - S between the simulation and No. 2901170 Argo float observation are presented in Fig. 5. Combining information that Fig. 5 reveals, the simulated T - S structures are satisfying. Moreover, the model Skills for both temperature and salinity at all stations are larger than 0.9, which indicates that the model could provide reliable temperature and salinity structures.

|
| Figure 5 T - S profile comparison between ROMS simulation and Argo-float observation at station (a) A1, (b) A2, (c) A3, (d) A4 and (e) A5, the model Skills at 5 thations are shown in (f) |
Figure 2b, d, f present the ROMS reproduction for the EHIU event on 1 Jul., 3 Jul. and 5 Jul. 2010, which are in good accordance with Fig. 2a, c and e, respectively. To make it clearer, the distribution of the points on 28.9℃ isotherm for both MODIS observation and ROMS simulation on 1 Jul., 3 Jul. and 5 Jul. 2010 are shown in Fig. 6a, b and c, respectively. The reproduction for the EHIU is generally satisfying.

|
| Figure 6 Distribution comparison of points on 28.9℃ isotherm between MODIS infrared SST (red dots) and ROMS simulated SST (green dots) on (a)01 Jul., (b)03 Jul. and (c)05 Jul. 2010; the detailed drawing for the MODIS observed CWC (d) and ROMS simulated CWC (e), then (f) displays the 27.5℃ isotherm comparison between the model and observation |
Figure 6d and e show the details of the MODIS captured CWC and ROMS modeled CWC. The observed and modeled 27.5℃ isotherm, which distinguished the CWC, was displayed in Fig. 6f. Although the modeled CWC appears to be smoother than the observed one, the general pattern is convincing. According to Figs. 2 and 6, the simulated EHIU SST structure agrees with observation well. Although errors exist, the model could capture the main features of the EHIU, especially for the CWC.
4.2 Evolution of the CWC and horizontal currentsThe CWC is captured on 1 Jul. 2010 when the CWC was already vigorous. Considering the continuity of the upwelling dynamical process, the modeled daily-averaged SST and the daily-depthaveraged horizontal currents in the east Qiongzhou Strait areas from 25 Jun. to 3 Jul. 2010 are shown in Fig. 7. As the simulation reveals, the CWC started to form on 27 Jun. and was the strongest on 29 Jun. Then it weakened, as was also captured by the MODIS image on 1 Jul. Finally the CWC vanished and water warmer than 28℃ occupied the east Qiongzhou Strait mouth surface areas on 3 Jul. During the evolution of the CWC, the change of the daily-depth-averaged horizontal currents was striking. The eastward currents in the Qiongzhou Strait on 25 Jun. gradually attenuated and completely shifted to be a westward one on 29 Jun., persisting until 1 Jul. Then the eastward currents occupied the Qiongzhou Strait again from 2 Jul. During the CWC period, the dailydepth- averaged horizontal currents in the CWC area represented a southward pattern, which indicates that the CWC was not a result of advection from the southeastern part of the EHIU but was generated locally.

|
| Figure 7 ROMS simulated daily-averaged SST and the daily-depth-averaged horizontal currents in the east Qiongzhou Strait areas from 25 Jun. to 3 Jul. 2010 |
In consideration of the CWC's extension in the meridional direction and the varied topography it covered, two representative sections AB and CD (see Fig. 1) are chosen for presenting the vertical structure of the CWC. Section AB traverses the Qiongzhou Strait and is perpendicular to isobaths. Section CD is meridional and both sections AB and CD cross the middle of the CWC. Averages have been made for temperature and velocities from 28 Jun. to 1 Jul., which is the CWC period according to the model result. The velocities have been transformed into the along-section (u) and cross-section (v) directions. Figure 8a and b show the vertical structure of alongsection and vertical velocities superimposed on the temperature for sections AB and CD, respectively. For section AB, the most remarkable feature is the upwelled cooler-water tongue climbing the bathymetry slope. On the left of the CWC was the relatively well-mixed warmer water in the Qiongzhou Strait and on the other side was the essentially two- layer water of which the lower layer supplied cold water for the formation of the CWC. Besides, the horizontal currents mainly flow along BA direction, indicating westward flow in the Qiongzhou Strait during the CWC period. The nearly symmetrical secondary circulations that located to either side of the CWC should not be neglected, its likely cause is the pressure gradient force associated with the horizontal density variation around the CWC. These secondary circulations probably are responsible for the broadening, to both east and west, of the CWC. For the meridional section CD, the currents flow almost horizontally parallel with the bathymetry. The currents show a southward pattern (DC direction), again indicating that the CWC developed locally.

|
| Figure 8 ROMS simulated 28 Jun.-1 Jul. averaged u - w (v - w) superimposed on the temperature along section AB (a) and CD (b) w is amplified 1 000 times. |
During the CWC period, the flow showed a westward pattern in the Qiongzhou Strait (Figs. 7 and 8a). These westward currents seem paradoxical given that the southwest monsoon prevails almost all summer and the currents in the Qiongzhou Strait are intuitively expected to be eastward in summer. However, the in-situ current data over 37 years proves directly that the flow in the Qiongzhou Strait is westward in all seasons (Shi et al., 2002), further they concluded that the tidal rectification over variable bottom topography should account for the westward flow over the year, especially in the summer. The water volume transported through the Qiongzhou Strait into the Beibu Gulf is 0.026 Sv in summer as a joint effect of the westward tide-induced residual current and the eastward monsoon driven current (Chen et al., 2009). This westward residual current is also the cause of the cyclonic flow pattern in the Beibu Gulf in summer (Wu et al., 2008 ; Ding et al., 2013). Figure 8a is a strong indicator that the bottom cold water was uplifted while the westward currents encountered the slope covering 80-130 km segment of section AB during the CWC period. Thus, the westward flow played a significant role in the formation of CWC. Questions arise as to how the westward flow was generated. Was it the forced result of the southeast winds, or induced by tidal rectification as former study revealed? To investigate these issues, two numerical experiments were carried out. EXPOW was integrated without tidal forcing on the open boundaries and EXPOT omitted the wind forcing for investigating the influence of the winds and tides on the CWC separately. All other configurations for EXPOW and EXPOT are consistent with the CONTROL RUN.
Figure 9a and b present the time-depth-averaged horizontal currents and the time-averaged SST fields during the CWC period for EXPOW and EXPOT, respectively. As Fig. 9a shows, strong eastward flow dominates the Qiongzhou Strait; this strong current carries the much warmer water from the semi-closed Beibu Gulf to the seas northeast to the Hainan Island, so that there is almost no upwelling signal there. Meanwhile, Fig. 9b reveals that tides could generate relatively strong westward flow in the Qiongzhou Strait; there is a weak but evident cold patch in the east mouth area of the Qiongzhou Strait, of which the location is almost the same as the CWC; obviously, the linear superposition of the results from EXPOW and the EXPOT could not explain the result from the control run, which is a strong indicator of the complicated nonlinear interactions between the tides and winds.

|
| Figure 9 ROMS simulated time-depth-averaged horizontal current vectors superimposed on the time-averaged SST of EXPOW (a) and EXPOT (b) during the CWC period (28 Jun.-1 Jul.) |
Figure 10a, b and c present vertical temperature and vertical velocity features for EXPOW, EXPOT and CONTROL RUN during the CWC period, respectively. Just as revealed by Fig. 9a, Fig. 10a suggests that the CWC did not occur without tidal forcing and Fig. 10d shows that strong eastward currents always occupied the Qiongzhou Strait for EXPOW. EXPOT results in Fig. 10d indicate impressive westward currents in the Qiongzhou Strait during the CWC period, while a cooler-water tongue climbing the bathymetry slope could be detected in Fig. 10b (matches Fig. 9b). Although the intensity of the “CWC” produced by EXPOT is much weaker than that produced by the CONTROL RUN, the EXPOT produced a similar dynamical pattern to the CONTROL RUN. Thus, tides played a critical role in the formation of the CWC: the tidal rectification over variable bottom topography in the Qiongzhou Strait generates westward residual currents (Shi et al., 2002). The carry-over effect of this westward residual current on the bottom cold water and the guiding effect of the bathymetry slope generated the basis for the formation of the CWC.

|
| Figure 10 28 Jun.-1 Jul. averaged ROMS simulated temperature superimposed on the w velocity along section AB for EXPOW (a), EXPOT (b) and CONTROL RUN (c), respectively; water volume (positive eastward) through section AF (see Fig. 1) for 4 numerical experiments (d) |
Both the Ekman transport induced by alongshore wind stress and Ekman pumping generated by wind stress curl play a significant role in coastal upwelling. However, as presented in Section 4.2, while the CWC was evolving, a cold water mass was generated in the east Qiongzhou Strait mouth area, which is wide open. Thus, wind stress curl should play a more important role than the wind stress there. The wind stress curl defined as curlz =(∂ τy)/ ∂ x-(∂ τ x)/ ∂y was calculated from the ECMWF wind stress during the CWC period. According to Fig. 11a, strong negative wind stress curl occupied most of the east Qiongzhou Strait mouth area during the CWC period (28 Jun.-1 Jul. 2010), reaching values as high as -5.0×10⁻⁷ N/m2. Further, the Ekman pumping vertical velocity defined as ωe =curlz /(ρ0 f), where ρ0 is the average density of seawater (1 025 kg/m3) and f =2 ω sin φ is the Coriolis parameter at referencing latitude 20.3°N, could be estimated to achieve -1.0×10⁻⁵ m/s level. How would this strong Ekman pumping vertical velocity affect the CWC?

|
| Figure 11 During the CWC period (28 Jun.-1 Jul. 2010), (a) the time-average wind stress curl, (b) the difference between the EXPNWSC and the CONTROL RUN for temperature and w velocity along section AB (EXPNWSC-CONTROL RUN) |
One more numerical experiment named EXPNWSC was carried out. The only difference between the EXPNWSC and the CONTROL RUN is that the wind stress curl forcing the EXPNWSC at the east Qiongzhou Strait area (19.75°-21°N, 110.1°- 111.35°E) was removed by using spatial-averaged uniform wind stress in the corresponding area. Figure 11b displays the difference between the EXPNWSC and the CONTROL RUN for time-averaged temperature and w velocity along section AB (EXPNWSC-CONTROL RUN) during the CWC period. And Fig. 10d shows that the change of the wind stress curl in EXPNWSC almost has no effect on the volume transport in the Qiongzhou Strait. However, for the 65.0-97.4 km segment of section AB, the w velocity increases by (0.5-2.5)×10-5 m/s when leaving out the negative wind stress curl. Besides, the change in w velocity that the model produced is in reasonable range as the estimated Ekman pumping vertical velocity. Figure 11b also indicates that the strong negative wind stress curl suppressed the intensity of the CWC by 0.2-0.4℃. In contrast, the positive wind stress curl further east to the Qiongzhou Strait mouth area enhanced the upwelling there.
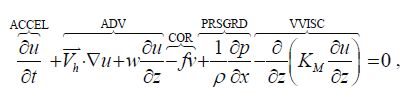
5.3 Momentum balanceAlthough the wind stress curl has an inhibiting effect on the CWC, the winds together with the tides could generate stronger CWC than single tides did. In this section, momentum balance was discussed to find the direct dynamical difference of different numerical experiments during the CWC period. And point E (see Fig. 1) located about 90 km offpoint A along AB direction was selected as the representative point to present the potential different dynamics at the CWC center. Momentum terms including the acceleration (ACCEL), advection (ADV), Coriolis (COR), pressure gradient (PRSGRD), vertical diffusion (VVISC) and horizontal diffusion (HVISC) are transformed into along-section (x, u) and crosssection (y, v) directions. Referred to Blumberg and Mellor (1987) and based on the model result that the HVISC term is much smaller than other terms, the momentum equations for the along-section and crosssection are given by
 (2)
(2)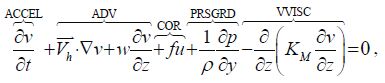 (3)
(3)where t is time, Vh is the horizontal velocity vector with components (u, v), operator ∇=(∂ / ∂x, ∂ / ∂y, ∂ / ∂z), f is the Coriolis parameter and KM is the vertical eddy viscosity.
The 25 hours averaged momentum-depth profiles on 29 Jun. when CWC was strongest based on Fig. 7 for the CONTROL RUN, EXPOW and EXPOT are presented as Fig. 12. The EXPOW reveals an Ekman balance in the along-section direction with COR and VVISC being dominant at all depths (Fig. 12c). A quasi-geostrophic balance in cross-section direction could be inferred given that COR and PRSGRD made the major balance with VVISC being secondarily important (Fig. 12d). The flow showed good linearity; besides, the strong positive COR in cross-section direction indicates vigorous eastward flow in the Qiongzhou Strait.

|
| Figure 12 The daily-averaged momentum-depth profiles at point E on 29 Jun. for the CONTROL RUN (a and b), EXPOW (c and d) and EXPOT (e and f), respectively The left plots show terms in along section direction and right plots in cross-section. |
The momentum balance patterns of EXPOT and the CONTROL RUN are quite alike, which indicates that tides make significant contribution to the dynamics in the east Qiongzhou Strait areas. Further, according to the COR terms in the cross-section direction for the CONTROL RUN (Fig. 12b), the EXPOW (Fig. 12d) and the EXPOT (Fig. 12f), it could be speculated that the westward flow in the Qiongzhou Strait was generated by tidal process which is consistent with the discussion in Section 5.1.
When the tides cooperated with the winds, the most remarkable feature in the momentum terms was the extremely enhanced VVISC term over the whole depth (Fig. 12a, b), especially in the along-section direction. The linear superposition of the momentum terms from the EXPOT and EXPOW could not account for the results from the CONTROL RUN. Thus, nonlinear interaction between tidal currents and wind stress can be proposed as an essential factor for the enhanced VVISC. On one hand, in the shallow waters, tide- and wind-forced currents can interact directly via the nonlinear momentum terms and time variations in the vertical eddy viscosity and windinduced shear coefficients (Davies and Lawrence, 1994 ; Davies and Xing, 2001). Through wave-wave interaction, these nonlinear effects could lead to energy cascade from longer waves to shorter waves, then wave breaking, and eventually to turbulence, which could enhance the vertical mixing. On the other hand, observational evidence proved that internal waves could interact with the inertial oscillations in both deep ocean and shallow sea (Mihaly et al., 1998 ; van Haren et al., 1999), and then Garrett (2001) concluded that the nonlinear interaction between the internal tide- and wind-induced currents (particularly for those at the inertial frequency, namely the resonant frequency) plays a vital role in enhancing the mixing. Other work, by Bai et al.(2015) finds that there exists internal tide signal in the area of the CWC, and the 3-hourly wind forcing could trigger the inertial currents. Thus the interaction between the internal tide- and wind-induced inertial currents might also be one of the explanations for the enhanced vertical mixing.
The redoubled VVISC term would not help to uplift the bottom cold water directly, but the reinforced vertical mixing can benefit the heat exchange between the bottom cold water and surface warm water, which helps to make the surface water cooler. A noteworthy detail is that the water depth on the top of the bathymetry slope east of Qiongzhou Strait is only about 15m, under this circumstance, the contribution of the whole-depth dominant VVISC term in both along- and cross-section directions (Fig. 12a, b) on cooling the upper layer water should be significant.
6 SUMMARY AND CONCLUSIONDifferent from previous investigations on the EHIU, this paper investigates the synoptic characteristics rather than seasonal or annual features of the EHIU. An EHIU event occurring offthe east Hainan Island during 1 Jul.-5 Jul. 2010 was successfully captured by MODIS SST images. This EHIU was separated from non-upwelling water by the 28.9℃ isotherm, whose outline changed in time. On average, this EHIU covered an area of 22 815 km2 and extended up to 393(140) km in the SW-NE (SENW) direction. A cooler-water core (CWC) among the EHIU was found at the east Qiongzhou Strait mouth areas on 1 Jul. 2010. The CWC was at least 1℃ lower SST than the other part of the EHIU. The temperature gradient on the edge of the CWC was larger than 0.06℃/km and even reached to 0.37℃/km in some of the area. Thus, the CWC is the focus of principal interest in this paper.
ROMS is employed to make up the disadvantage that the MODIS SST could only provide surface features of this EHIU (and the CWC). By comparing ROMS result against tide station data, Argo float profiles and MODIS SST, ROMS reproduces both the EHIU and the CWC well. According to the ROMS result, the CWC started to form on 27 Jun., intensified to 29 Jun., after when it weakened and finally vanished on 3 Jul. Vertical structures of the CWC were characterized by an upwelled cooler-water tongue along the bathymetry slope in the open east Qiongzhou Strait areas. The interaction between the westward flow and the bathymetry slope could be inferred as a key factor for the formation of the CWC. Numerical experiments designed to investigate the role that winds and tides played on the CWC separately confirmed that the westward currents into the Qiongzhou Strait were induced by the tidal rectification (Shi et al., 2002 ; Chen et al., 2009), thus tides played a critical role in generating the CWC. Further, the strong negative wind-stress curl that occupied the east Qiongzhou Strait mouth area was proved to suppress the intensity of the CWC by 0.2- 0.4℃. On the other hand, the positive wind stress curl further east to the Qiongzhou Strait mouth area enhanced the upwelling there. The nonlinear interaction between the tidal currents and the wind stress enhanced the vertical mixing in the whole water depth in the CWC area, which would contribute to cooling the upper layer of the shallow water over the bathymetry slope significantly. The complicated nonlinear interaction between the tide- and winddriven currents and the interaction between the internal tide- and wind-driven currents might provide the possible explanations for the enhanced vertical mixing. However, quantitative investigations in situ are required to confirm the key factors in the near future. Our study suggests that the strong tidal process play a critical role in modifying the local dynamical characters of the synoptic-scale EHIU event, thus tides should not be omitted when discussing synopticscale EHIU events.
| Allen S E, Hickey B M, 2010. Dynamics of advection-driven upwelling over a shelf break submarine canyon. Journal of Geophysical Research:Oceans (1978-2012), 115 (C8) . Doi: 10.1029/2009JC005731 |
| Backhaus J O, 1985. A three-dimensional model for the simulation of shelf sea dynamics. DeutscheHydrografische Zeitschrift, 38 (4) : 165 –187. |
| Bai P, Li P L, Gu Y Z, Wu K J, 2015. Interaction between Upwelling and Internal Tide in the East Qiongzhou Strait Areas. Advanced Materials Research, 1092-1093 : 1 160 –1 164. Doi: 10.4028/www.scientific.net/AMR.1092-1093 |
| Beckmann A, Haidvogel D B, 1993. Numerical simulation of flow around a tall isolated seamount. Part I:problem formulation and model accuracy. Journal of Physical Oceanography, 23 (8) : 1 736 –1 753. Doi: 10.1175/1520-0485(1993)023<1736:NSOFAA>2.0.CO;2 |
| Blumberg A F, Mellor G L. 1987. A description of a threedimensional coastal ocean circulation model. Three -Dimensional Coastal Ocean Models. p.1-16. |
| Cao D M, Fang G H, 1990. A numerical model of the tides and tidal currents in Beibu Bay. Oceanologia et Limnologia Sinica, 21 (2) : 105 –113. |
| Chen C L, Li P L, Shi M C, Zuo J C, Chen M X, Sun H P, 2009. Numerical study of the tides and residual currents in the Qiongzhou Strait. Chinese Journal of Oceanology and Limnology, 27 (4) : 931 –942. Doi: 10.1007/s00343-009-9193-0 |
| Chen C S, Lai Z G, Beardsley R C, Xu Q C, Lin H C, Viet N T, 2012. Current separation and upwelling over the southeast shelf of Vietnam in the South China Sea. Journal of Geophysical Research:Oceans (1978-2012), 117 (C3) . Doi: 10.1029/2011JC007150 |
| Chen Z Y, Yan X H, Jiang Y W, Jiang L D, 2013. Roles of shelf slope and wind on upwelling:a case study off east and west coasts of the US. Ocean Modelling, 69 : 136 –145. Doi: 10.1016/j.ocemod.2013.06.004 |
| Davies A M, Lawrence J, 1994. Examining the influence of wind and wind wave turbulence on tidal currents, using a three-dimensional hydrodynamic model including wavecurrent interaction,. Journal of Physical Oceanography, 24 (12) : 2 441 –2 460. Doi: 10.1175/1520-0485(1994)024<2441:ETIOWA>2.0.CO;2 |
| Davies A M, Xing J, 2001. The influence of eddy viscosity parameterization and turbulence energy closure scheme upon the coupling of tidal and wind induced currents. Estuarine, Coastal and Shelf Science, 53 (4) : 415 –436. Doi: 10.1006/ecss.1999.0623 |
| Ding Y, Chen C S, Beardsley R C, Bao X W, Shi M C, Zhang Y, Lai Z G, Li R X, Lin H C, Viet N T, 2013. Observational and model studies of the circulation in the Gulf of Tonkin, South China Sea. Journal of Geophysical Research:Oceans, 118 (12) : 6 495 –6 510. Doi: 10.1002/2013JC009455 |
| Dippner J W, Nguyen K V, Hein H, Ohde T, Loick N, 2007. Monsoon-induced upwelling off the Vietnamese coast. Ocean Dynamics, 57 (1) : 46 –62. Doi: 10.1007/s10236-006-0091-0 |
| Figa-Saldaña J, Wilson J J W, Attema E, Gelsthorpe R, Drinkwater M R, Stoffelen A, 2002. The advanced scatterometer (ASCAT) on the meteorological operational(MetOp) platform:a follow on for European wind scatterometers. Canadian Journal of Remote Sensing, 28 (3) : 404 –412. Doi: 10.5589/m02-035 |
| Franchito S H, Oda T O, Rao V B, Kayano M T, 2008. Interaction between coastal upwelling and local winds at Cabo Frio, Brazil:an observational study. Journal of Applied Meteorology and Climatology, 47 (6) : 1 590 –1 598. Doi: 10.1175/2007JAMC1660.1 |
| Gan J P, Cheung A, Guo X G, Li L, 2009a. Intensified upwelling over a widened shelf in the northeastern South China Sea. Journal of Geophysical Research:Oceans (1978-2012), 114 (C9) . Doi: 10.1029/2007JC004660 |
| Gan J P, Li L, Wang D X, Guo X G, 2009b. Interaction of a river plume with coastal upwelling in the northeastern South China Sea. Continental Shelf Research, 29 (4) : 728 –740. Doi: 10.1016/j.csr.2008.12.002 |
| Garrett C, 2001. What is the "near-inertial" band and why is it different from the rest of the internal wave spectrum?. Journal of Physical Oceanography, 31 (4) : 962 –971. Doi: 10.1175/1520-0485(2001)031<0962:WITNIB>2.0.CO;2 |
| Howatt T M, Allen S E, 2013. Impact of the continental shelf slope on upwelling through submarine canyons. Journal of Geophysical Research:Oceans, 118 (10) : 5 814 –5 828. Doi: 10.1002/jgrc.20401 |
| Jing Z Y, Qi Y Q, Du Y, 2011. Upwelling in the continental shelf of northern South China Sea associated with 1997-1998 El Niño. Journal of Geophysical Research:Oceans(1978-2012), 116 (C2) . Doi: 10.1029/2010JC006598 |
| Jing Z Y, Qi Y Q, Hua Z L, Zhang H, 2009. Numerical study on the summer upwelling system in the northern continental shelf of the South China Sea. Continental Shelf Research, 29 (2) : 467 –478. Doi: 10.1016/j.csr.2008.11.008 |
| Kuo N J, Zheng Q A, Ho C R, 2004. Response of Vietnam coastal upwelling to the 1997-1998 ENSO event observed by multisensor data. Remote Sensing of Environment, 89 (1) : 106 –115. Doi: 10.1016/j.rse.2003.10.009 |
| Lee H J, Chao S Y, Fan K L, Kuo T Y, 1999. Tide-induced eddies and upwelling in a semi-enclosed basin:nan wan. Estuarine, Coastal and Shelf Science, 49 (6) : 775 –787. Doi: 10.1006/ecss.1999.0524 |
| Li Y N, Peng S Q, Yang W, Wang D X, 2012. Numerical simulation of the structure and variation of upwelling off the east coast of Hainan Island using QuikSCAT winds. Chinese Journal of Oceanology and Limnology, 30 (6) : 1 068 –1 081. Doi: 10.1007/s00343-012-1275-8 |
| Matano R P, Palma E D, 2008. On the upwelling of downwelling currents. Journal of Physical Oceanography, 38 (11) : 2 482 –2 500. Doi: 10.1175/2008JPO3783.1 |
| Mellor G L, Yamada T, 1982. Development of a turbulence closure model for geophysical fluid problems. Reviews of Geophysics, 20 (4) : 851 –875. Doi: 10.1029/RG020i004p00851 |
| Mihaly S F, Thomson R E, Rabinovich A B, 1998. Evidence for nonlinear interaction between internal waves of inertial and semidiurnal frequency. Geophysical Research Letters, 25 (8) : 1 205 –1 208. Doi: 10.1029/98GL00722 |
| Morton B, Blackmore G, 2001. South China Sea. Marine Pollution Bulletin, 42 (12) : 1 236 –1 263. Doi: 10.1016/S0025-326X(01)00240-5 |
| Pohlmann T, 1996a. Calculating the development of the thermal vertical stratification in the North Sea with a three-dimensional baroclinic circulation model. Continental Shelf Research, 16 (2) : 163 –194. Doi: 10.1016/0278-4343(95)00018-V |
| Pohlmann T, 1996b. Predicting the thermocline in a circulation model of the North Sea-Part I:model description, calibration and verification. Continental Shelf Research, 16 (2) : 131 –146. Doi: 10.1016/0278-4343(95)90885-S |
| Rivas D, Samelson R M, 2011. A numerical modeling study of the upwelling source waters along the Oregon coast during 2005. Journal of Physical Oceanography, 41 (1) : 88 –112. Doi: 10.1175/2010JPO4327.1 |
| Rossi V, Feng M, Pattiaratchi C, Roughan M, Waite A M, 2013. On the factors influencing the development of sporadic upwelling in the Leeuwin Current system. Journal of Geophysical Research:Oceans, 118 (7) : 3 608 –3 621. Doi: 10.1002/jgrc.20242 |
| Shchepetkin A F, McWilliams J C, 2005. The regional oceanic modeling system (ROMS):a split-explicit, free-surface, topography-following-coordinate oceanic model. Ocean Modelling, 9 (4) : 347 –404. Doi: 10.1016/j.ocemod.2004.08.002 |
| Shi M C, Chen C S, Xu Q C, Lin H C, Liu G M, Wang H, Wang F, Yan J H, 2002. The role of Qiongzhou Strait in the seasonal variation of the South China Sea circulation. Journal of Physical Oceanography, 32 (1) : 103 –121. Doi: 10.1175/1520-0485(2002)032<0103:TROQSI>2.0.CO;2 |
| Song H, Miller A J, Cornuelle B D, Di Lorenzo E, 2011. Changes in upwelling and its water sources in the California Current System driven by different wind forcing. Dynamics of Atmospheres and Oceans, 52 (1-2) : 170 –191. Doi: 10.1016/j.dynatmoce.2011.03.001 |
| Song Y H, Haidvogel D, 1994. A semi-implicit ocean circulation model using a generalized topographyfollowing coordinate system. Journal of Computational Physics, 115 (1) : 228 –244. Doi: 10.1006/jcph.1994.1189 |
| Song Y T, Chao Y, 2004. A theoretical study of topographic effects on coastal upwelling and cross-shore exchange. Ocean Modelling, 6 (2) : 151 –176. Doi: 10.1016/S1463-5003(02)00064-1 |
| Song Y T, Haidvogel D B, Glenn S M, 2001. Effects of topographic variability on the formation of upwelling centers off New Jersey:a theoretical model. Journal of Geophysical Research:Oceans (1978-2012), 106 (C5) : 9 223 –9 240. Doi: 10.1029/2000JC000244 |
| Su J L, 2004. Overview of the South China Sea circulation and its influence on the coastal physical oceanography outside the Pearl River Estuary. Continental Shelf Research, 24 (16) : 1 745 –1 760. Doi: 10.1016/j.csr.2004.06.005 |
| Su J, Pohlmann T, 2009. Wind and topography influence on an upwelling system at the eastern Hainan coast. Journal of Geophysical Research:Oceans (1978-2012), 114 (C6) . Doi: 10.1029/2008JC005018 |
| Sun H L, Huang W M, 2001. Three-dimensional numerical simulation for tide and tidal current in the Beibu Gulf. Acta Oceanologica Sinica, 20 (1) : 29 –38. |
| van Haren H, Maas L, Zimmerman J T F, Ridderinkhof H, Malschaert H, 1999. Strong inertial currents and marginal internal wave stability in the central North Sea. Geophysical Research Letters, 26 (19) : 2 993 –2 996. Doi: 10.1029/1999GL002352 |
| Wang D X, Zhuang W, Xie S P, et al, 2012. Coastal upwelling in summer 2000 in the northeastern South China Sea. Journal of Geophysical Research:Oceans (1978-2012), 117 (C4) . Doi: 10.1029/2011JC007465 |
| Warner J C, Geyer W R, Lerczak J A, 2005. Numerical modeling of an estuary:a comprehensive skill assessment. Journal of Geophysical Research:Oceans (1978-2012), 110 (C5) . Doi: 10.1029/2004JC002691 |
| Willmott C J, 1981. On the validation of models. Physical Geography, 2 (2) : 184 –194. Doi: 10.1080/02723646.1981.10642213 |
| Wu D X, Wang Y, Lin X P, Yang J Y, 2008. On the mechanism of the cyclonic circulation in the Gulf of Tonkin in the summer. Journal of Geophysical Research:Oceans(1978-2012), 113 (C9) . Doi: 10.1029/2007JC004208 |
| Wyrtki K. 1961. Scientific results of marine investigations of the South China Sea and the Gulf of Thailand 1959-1961.NAGA Report 2. University of California, San Diego. |
| Xie S P, Chang C H, Xie Q, Wang D X, 2007. Intraseasonal variability in the summer South China Sea:wind jet, cold filament, and recirculations. Journal of Geophysical Research:Oceans (1978-2012), 112 (C10) . Doi: 10.1029/2007JC004238 |
| Xie S P, Xie Q, Wang D X, Liu W T, 2003. Summer upwelling in the South China Sea and its role in regional climate variations. Journal of Geophysical Research:Oceans(1978-2012), 108 (C8) . Doi: 10.1029/2003JC001867 |
| Zhong L J, Li M, 2006. Tidal energy fluxes and dissipation in the Chesapeake Bay. Continental Shelf Research, 26 (6) : 752 –770. Doi: 10.1016/j.csr.2006.02.006 |