Institute of Oceanology, Chinese Academy of Sciences
Article Information
- QIU Fuwen(丘福文), FANG Wendong(方文东), PAN Aijun(潘爱军), CHA Jing(查晶), ZHANG Shanwu(张善武), HUANG Jiang(黄奖)
- Interannual to decadal variation of spring sea level anomaly in the western South China Sea
- Chinese Journal of Oceanology and Limnology, 35(1): 79-88
- http://dx.doi.org/10.1007/s00343-016-5203-1
Article History
- Received Aug. 17, 2015
- accepted for publication Sep. 28, 2015
- accepted in principle Dec. 25, 2015
2 State Key Laboratory of Tropical Oceanography, South China Sea Institute of Oceanology, Chinese Academy of Sciences, Guangzhou 510301, China
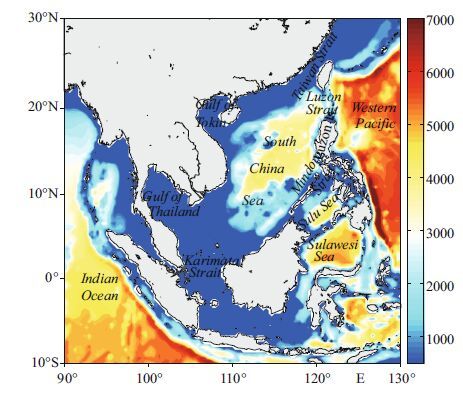
The South China Sea (SCS) is one of the largest tropical marginal seas in the world, which connects with the western Pacific via Luzon Strait, and with the Sulu Sea through the Mindoro Strait (Fig. 1). The remaining connections with external bodies of water are over shallow continental shelf regions. The SCS current system is characterized by strong seasonality associated with wind forcing, and the seasonal cycle over most of the SCS basin is determined predominantly by the regional dynamics within the SCS (Liu et al., 2001). The dominant basin-wide circulation in the upper layer is cyclonic (anticyclonic), driven by the northeasterly (southwesterly) boreal winter (summer) monsoon. The monsoon transition seasons appear during boreal spring and fall, with an anticyclonic and a cyclonic gyre in the central SCS, respectively (Qiu et al., 2012).
|
| Figure 1 Bathymetry of the South China Sea (units: m) |
Considering the importance of the variability in the circulation, numerous studies have concentrated on the seasonal circulation, coastal jet separation, and abundant mesoscale eddies in the SCS (Qu et al., 2000 ; Gan and Qu, 2008 ; Xiu et al., 2010). In summer, the northward coastal jet separates at approximately 12°N and extends to the east coast of central Vietnam, with an anticyclonic eddy to its south and a cyclonic eddy to its north (Fang et al., 2002 ; Xie et al., 2003 ; Wang et al., 2006). The eastward jet, and associated eddy formation, is primarily governed by the winddriven circulation in the basin interior (Xie et al., 2003 ; Wang et al., 2006 ; Cai et al., 2007 ; Bayler and Liu, 2008). Furthermore, it has been demonstrated that the boundary layer dynamics over the narrow shelf topography may also have an effect on the jet and eddy formation (Gan and Qu, 2008). In winter, the western boundary current flows southwestward along the South China shelf and slope, then turns to the south along the Vietnam coast, and partially exits the SCS through the Karimata Strait (Fang et al., 2012). The southward western boundary current transports the cold northern water to the south, which plays an important role in the SCS climate (Liu et al., 2004).
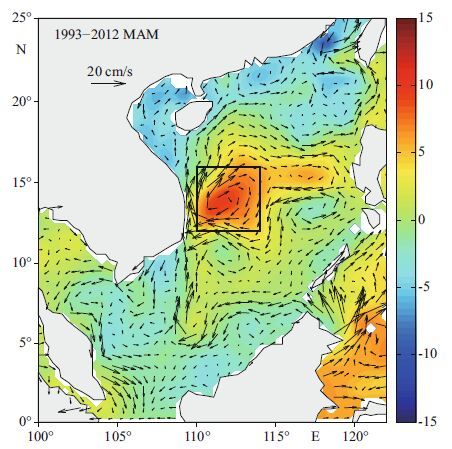
One of the major transition patterns occurs in spring, of which the most dominant feature is the spring warm pool. This warm pool develops and peaks in May over the central SCS and decays in June (Chu and Chang, 1997 ; Qu, 2001 ; Wang and Wang, 2006). It has been suggested that the surface heat flux plays a dominant role in the formation of the spring warm pool (Wang and Wang, 2006); while the surface wind stress curl associated with the bottom topography of the SCS may be responsible for its evolution (Chu and Chang, 1997). Correspondingly, a single high sea level peak centered at 14°N, 114°E becomes a dominant feature during spring (March and April)(Ho et al., 2000), namely, the spring warm-core eddy (Chi et al., 1998) or the spring mesoscale high (He et al., 2013). The 20-year (1993-2012) mean of the sea level anomaly (SLA) and geostrophic current for March-May (MAM) shows a noticeable anticyclonic eddy in the western SCS during spring (Fig. 2). Using numerical experiments, Chi et al., (1998) highlighted the importance of wind in generating the warm-core eddy in the spring-to-summer transition season. He et al., (2013) suggested that the lateral transport in the western SCS also contributes to the generation of the high SLA during spring. The spring warm pool and high SLA in the SCS play an important role on the climate and weather, such as, rainfall and typhoons over the SCS. However, the interannual to decadal variation of these issues is not well understood and deserves further investigation.
|
| Figure 2 The SLA (shaded, cm) and geostrophic current (vector, cm/s) averaged for March-May (MAM) during 1993-2012 |
Previous studies have revealed that the monsoon wind in the SCS displays a remarkable interannual variation associated with ENSO (Wang and Zhang, 2002). The weaker monsoon winds during El Niño events eventually influence the circulation, with weaker gyres and upwelling in the SCS (Chao et al., 1996 ; Qu et al., 2000 ; Xie et al., 2003 ; Fang et al., 2006). As described above, the spring high SLA in the western SCS is closely associated with the monsoon winds. Therefore, the spring high SLA may have a large signal on an interannual time scale, which may have a potential further impact on the summer circulation. So far, few studies have reported on the interannual variability of this feature. In addition, the transition of the circulation patterns from spring to summer may play a significant role in the variability of the coastal jet (Wu et al., 1998). During normal years, the spring high SLA decays in May, and a cyclonic gyre appears and persists from summer well into January. In 1995, a late transition from anticyclonic to cyclonic in the western SCS allowed the northward coastal jet to penetrate into the Gulf of Tonkin. Except for the summer, the winter circulation in the SCS is also modulated by the transition of the spring to summer circulation pattern. For example, the early reversal of the spring to summer circulation resulted in a weak winter gyre during 1992 and 1994(Wu et al., 1998).
As a consequence, the variation of the circulation pattern in the western SCS during the spring transition season is an important academic issue to improve our understanding of the SCS ocean dynamics. In this study, using long continuous satellite altimeter data, the major objective was to investigate the interannual to decadal variability of the spring high SLA in the western SCS, and reveal its potential impact on the variability of the SCS circulation.
2 DATA AND METHODThe monthly SLA data are the merged product of T/P, ERS-1, Jason-1, and ERS-2 satellite altimetry observations, provided by AVISO, and have a 1°/3° spatial resolution. The monthly surface geostrophic velocity was computed with monthly SLA data. Monthly winds with 2.5° horizontal resolution, obtained from the National Center for Environmental Prediction-National Center for Atmospheric Research (NCEP-NCAR) global atmospheric reanalysis data, were used to study the wind stress and wind stress curl anomalies during ENSO events. Meanwhile, the Simple Ocean Data Assimilation (SODA; Carton et al., 2000) dataset was adopted to calculate the ocean heat content anomaly (OHCA) in the upper 300 m of the water column as follows:
 (1)
(1)where ρ is the potential density (taken as constant: ρ =1 000 kg/m3), and C p denotes the specific heat capacity, and T clim represents the climatological temperature.
To study the interannual to decadal variability, the seasonal cycle was first removed: the climatological monthly means from January to December during 1993-2012 were subtracted from monthly values to obtain monthly anomalies from the climatology. Next, the Empirical Orthogonal Function (EOF) method was used to extract the dominant interannual to decadal change signals of the boreal springtime SLA field.
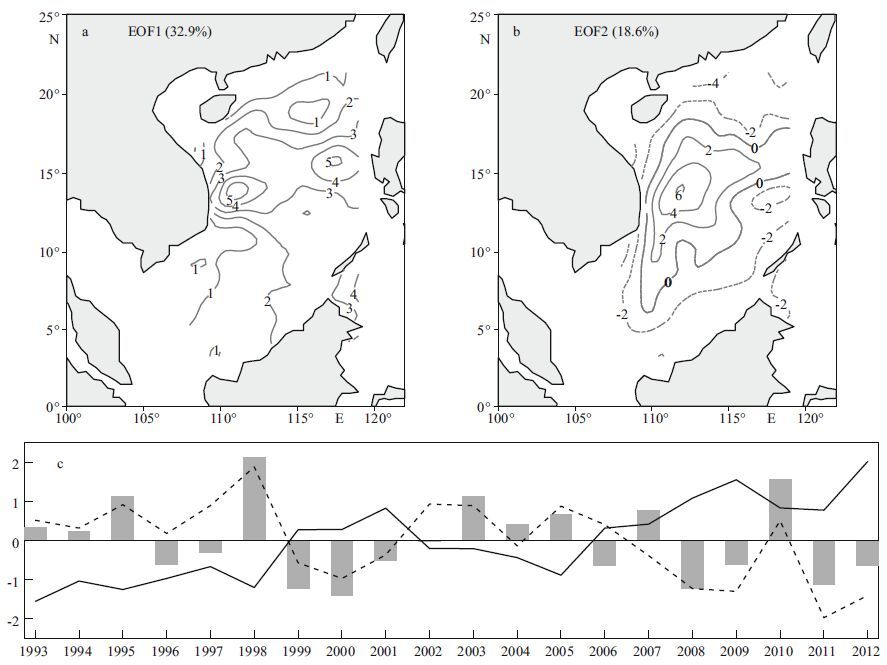
3 PRINCIPAL MODES OF SPRING SLASTo capture the dominant interannual variability signal of the spring SLA in the western SCS, EOF analysis was performed and the first leading two EOF modes are presented in Fig. 3. These two modes explain about 32.9% and 18.6% of the total variance in the spring SLA in the SCS.
|
| Figure 3 The first two leading EOF modes of the spring SLA a. spatial pattern of EOF1; b. spatial pattern of EOF2; c. time coefficients of EOF1(black solid line); time coefficients of EOF2(black dotted line); and December-February Niño 3.4 index (gray bar), all have been normalized. |
The first EOF mode (EOF1; Fig. 3a) shows inphase SLA variability in the entire study region. The high variance zone is mainly located in the central deep basin along 15°N, with two maximum mesoscale variance regimes centered northeast of the Vietnam coast (112°E, 14°N) and west of Luzon (118°E, 16°N), respectively. The corresponding time coefficients of EOF1(Fig. 3c) had a negative correlation (correlation coefficient=-0.47) with the Niño3.4 index (monthly SST anomalies in the region 5°N-5°S, 120°-170°W: positive anomalies >0.5℃ indicate El Niño events and negative anomalies <-0.5℃ indicate La Niña events (McPhaden, 2008)) at the 95% confidence level. In addition, the corresponding time coefficients of EOF1 revealed a quasi-decadal oscillation of the spring SLAs: the higher than normal sea level was observed during 1999-2001 and 2006-2012; whereas the lower than normal sea level was detected during 1993-1998 and 2002-2005. It is noteworthy that the local maximum centered northeast offVietnam coincided with the spring high SLA in the western SCS, suggesting that the intensity of the spring high SLA is also modulated by the decadal variation of SLA in the SCS.
The spatial pattern associated with the second EOF mode (EOF2; Fig. 3b) is dominated by a basin-wide anticyclonic gyre in the SCS. The maximum positive value is centered at 14°N, 112°E, which is consistent with the locations of the spring warm-core eddy and spring mesoscale high (Chi et al., 1998 ; Ho et al., 2000 ; He et al., 2013). Compared with the ENSO years shown in Table 1, the corresponding time coefficients of EOF2(Fig. 3c) indicate strong correlation (>0.7) with the Niño 3.4 index. Specifically, high positive values of the time coefficients of EOF2 arise during El Niño years, while negative values are coincident with the emergence of La Niña events. Furthermore, the EOF2 mode is highly negatively correlated with the mean regional wind stress curl (averaged by 12°-16°N, 110°-114°E). As is known that El Niño prefers a stronger spring anticyclonic gyre in SCS; therefore, the above result suggests that the spatial pattern of EOF2 is directly affected by the negative wind stress curl, which is originally modulated by El Niño. It should be noted that the time coefficients of the first two leading EOF modes are almost out of phase on decadal timescales. The time coefficient of EOF2 shows a strong spring anticyclonic gyre during 1993-1998 and 2002-2006; whereas it is relatively weak during 1999-2001 and 2008-2012.
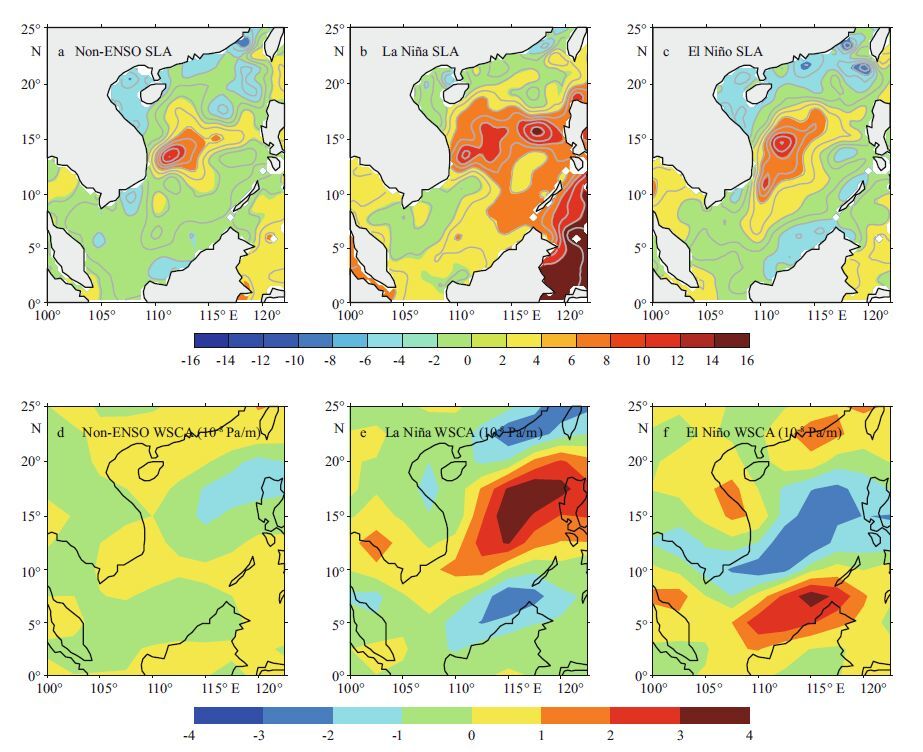
Figure 4 shows composite maps of the SLA and wind stress curl anomalies (WSCA) for non-ENSO years, El Niño, and La Niña events. During non- ENSO years, the SLA pattern is consistent with the climatology of spring SLA, with negative WSCA in the central basin of SCS (Fig. 4a, d). The SLA pattern of El Niño events shows strong anticyclonic anomalies in the western SCS (Fig. 4c), which coincides well with the second EOF mode in terms of shape and location (Fig. 3b). The composite WSCA pattern during El Niño events shows negative values in the central basin of SCS (Fig. 4f). Driven by the negative wind stress curl, an anticyclonic gyre circulation appears in the western SCS in the spring just after the peak phase of El Niño, and persists through to the summer of the decaying phase of El Niño. The highest sea level anomaly occurred as a strong anticyclonic eddy in the western SCS, and persisted from February to September, 2010 (Fang et al., 2014 ; Chu et al., 2014). The eddy moved northward from May to July following the strong northward current along the western boundary, and the energy passed from the boundary current resulting in the continuing growth of the eddy in both strength and size (Chu et al., 2014). Conversely, the composite WSCA pattern during La Niña events showed positive values in the central basin of SCS (Fig. 4e), which is not conducive to form the anticyclonic gyre in the western SCS during the spring after the mature phase of La Niña, and leads to small values in the time coefficients of EOF2 during 1999-2001 and 2008-2009(Fig. 3d). However, the SLA pattern during La Niña events shows a high SLA band in the deep basin around 14°- 18°N (Fig. 4b), with two cells centered on the northeast coast of Vietnam and west of Luzon. Previous studies have revealed that La Niña episodes are generally followed by an increase of sea level in the SCS (Swapna et al., 2009).
|
| Figure 4 The composite distribution of spring SLA (cm; 1993-2012) a. non-ENSO years; b. La Niña years; c. El Niño years; d, e, and f are same as a, b, and c but for the spring WSCA, respectively (×10 - 8 Pa/m). |
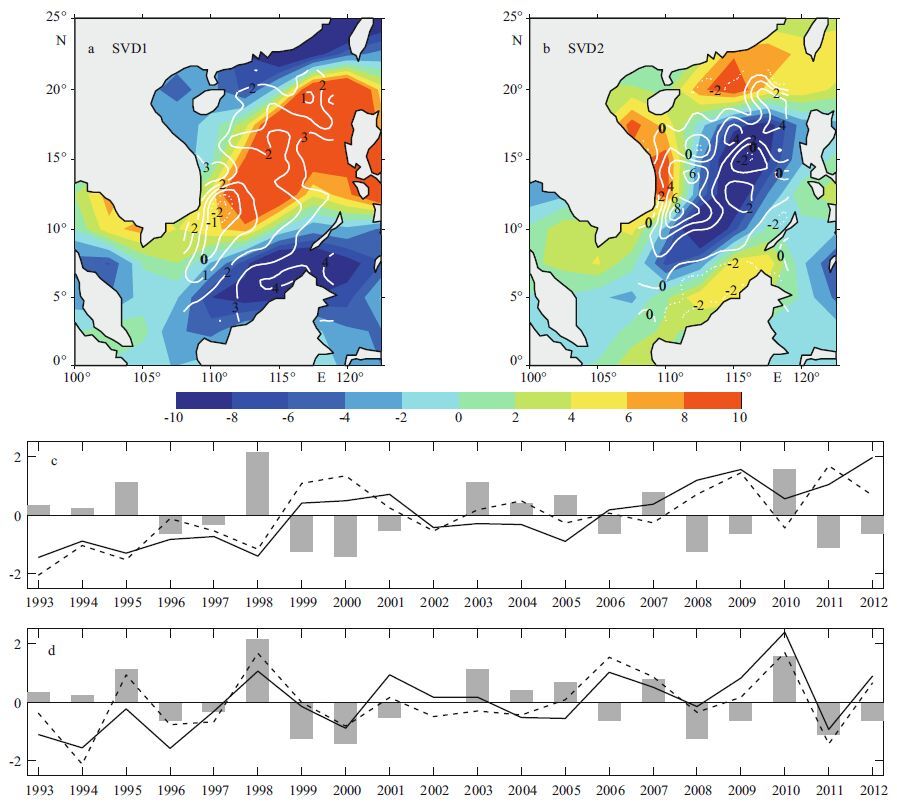
To identify the coupled spatial patterns and temporal variation of the spring SLA and WSCA fields, the Singular Value Decomposition (SVD) method was used to isolate the corresponding modes of the two fields (see e.g., Björnsson and Venegas, 1997 for more details). The Square Covariance Fraction (SCF) of the former six modes reached more than 92.0%. Here, only the results of the first two leading modes are discussed. The SCF of the first coupled mode reached 75.9% and the correlation coefficients of the expansion coefficients in both fields were 0.81(Fig. 5c). The first mode of the SLA showed the positive SLA in the eastern and northern SCS, while a negative SLA occurred offthe southwestern Vietnam coast (Fig. 5a). Conversely, the first mode of the WSCA displayed a pattern similar to the composite distribution during La Niña years, with a positive WSCA in the central basin of the SCS. The expansion coefficients of both fields revealed prominent rising trends during 1993-2012, and extraordinary positive values during 1999-2001 and 2006-2012. The SCF of the second mode was 7.0%. The second mode of the SLA and WSCA showed a positive SLA and a negative WSCA in the central-western SCS (Fig. 5b), which is consistent with the composite patterns during El Niño years. The expansion coefficients showed positive anomaly values during 1998 and 2010, corresponding well with the strong El Niño events that occurred during the winters of 1998 and 2010(Fig. 5d). The above analyses show that coupled spatial patterns and temporal variation of the spring SLA and WSCA fields have significant interannual variation. During La Niña years, the SLAs in the southwestern SCS are negative, which coincide with the positive WSCA in the central basin. However, the WSCA pattern cannot explain the positive SLAs in the northeastern SCS. Conversely, during El Niño years, the positive SLAs in the western SCS and the negative WSCA in the central basin are highly correlated.
|
| Figure 5 The SVD modes of spring SLA and WSCA (1993-2012) a. the first SVD modes of the SLA (contours) and WSCA (shaded); b. the second SVD modes of the SLA (contours) and WSCA (shaded); c. time series of the first SVD modal expansion coefficients of SLA (black solid line) and WSCA (black dotted line); d. same as (c) and (b) but for the second SVD modal expansion coefficients. The gray bars in (c) and (d) are the Niño 3.4 index of December-February, all have been normalized. |
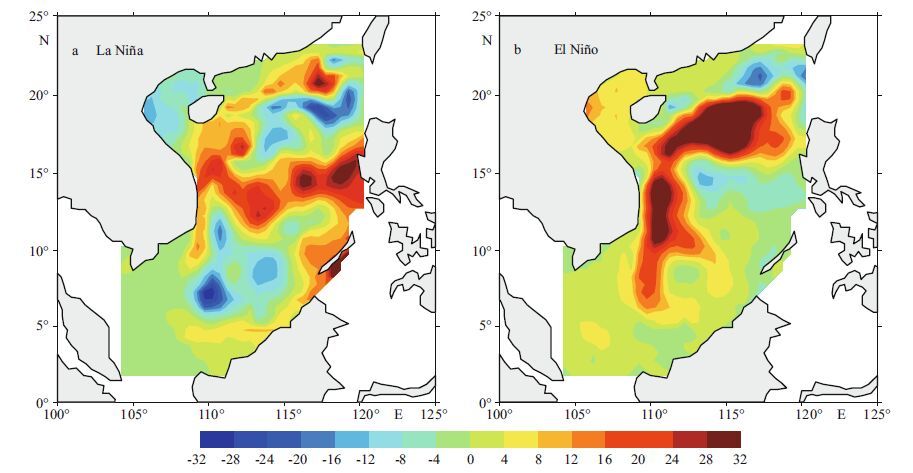
To obtain a better understanding of the physical processes attributed to the high SLA during La Niña episodes, the spatial pattern of composite OHCA during March of El Niño and La Niña episodes is presented in Fig. 6. Strong positive OHCA was found in the west of Luzon, which extended into the central basin of SCS and connected with the positive OHCA in the areas along the northwestern coast of SCS (Fig. 6a). The SLA patterns during La Niña years were consistent with the OHCA, indicating the strong influence of OHCA on sea level variations in the SCS during La Niña episodes. The intrusion of abnormally warm water from the western Pacific through the Luzon Strait increased the heat content during La Niña years (Swapna et al., 2009). Then, the positive OHCA propagated westward in the northern SCS (Yan et al., 2010), which led to the abnormally high sea level band in the north-central SCS. Conversely, a positive OHCA appeared in the areas along the western boundary current during El Niño episodes (Fig. 6b), indicating the potential impact of the ocean dynamics on the variance of OHCA in the SCS.
|
| Figure 6 Composite distribution of OHCA in the SCS during March of (a) La Niña years; and (b) El Niño years from SODA (1017 J) |
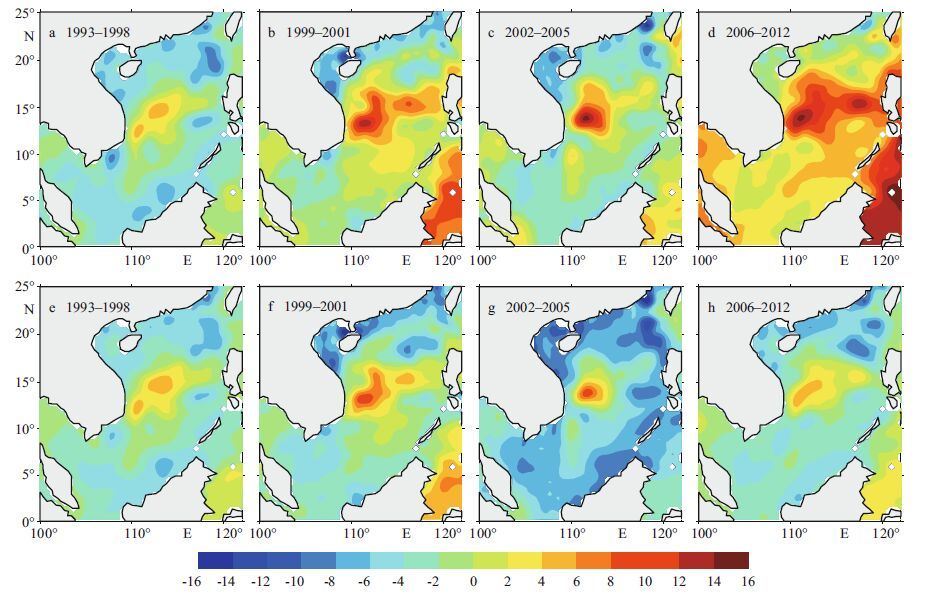
The variations of the spring anticyclonic eddy in the western SCS have two leading modes: the Sea Level Changing Mode (SLCM) and the Anticyclonic Eddy Mode (AEM; Fig. 3). The dominant modes of the spring anticyclonic eddy in the western SCS showed a decadal change. The most prominent feature was associated with the sea level change for the periods of 1999-2001 and 2006-2012; while it was associated with the strength of the spring anticyclonic gyre for the periods of 1993-1998 and 2002-2005. We compared the spring SLA field during four periods. During two of these (1993-1998 and 2002- 2005), the spring SLAs in the western-central SCS occurred as an anticyclonic eddy (Fig. 7a, c). The other two periods (1999-2001 and 2006-2012) were dominated by the abnormally high sea level in the north-central SCS (Fig. 7b, d), with the shape and location consistent with the first EOF mode (Fig. 7a), as well as with the composite SLA of La Niña years (Fig. 7b).
|
| Figure 7 SLA (cm) in the SCS during spring in (a)1993-1998;(b)1999-2001;(c)2002-2005; and (d)2006-2012;(e)-(h) same as (a)-(d) but with the linear trend removed |
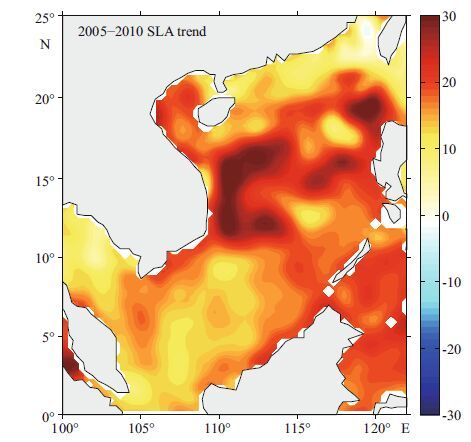
During 2006-2012, a period with prevailing La Niña events (2007/2008, 2008/2009, 2010/2011, and 2011/2012)(Dieng et al., 2014), the rapid sea level rise during 2005-2010 appeared in the whole SCS basin, with the maximum rising trend exceeding 30 mm/a in the central SCS basin (Fang et al., 2014). The SLA field with the linear trend removed during 1999-2001 and 2006-2012(Fig. 7f, h) was very different from that with all signals included. Note that the spatial patterns of the field with the linear trend removed during 1999-2001 and 2006-2012 share some degree of similarity with the anticyclonic gyre pattern during 1993-1998 and 2002-2005. In addition, the leading mode becomes the anticyclonic eddy mode, if the EOF analysis is conducted only for the period 1993-2005(figure not shown). A similar situation occurred in 1993-2012 when the linear trend was removed, which indicated that the accelerated sea level rise during 2005-2010(exceeding 30 mm/a in the western SCS, Fig. 8) has a significant influence on the spring circulation patterns in the SCS and causes a significant decadal variability of the spring circulation in the western SCS.
|
| Figure 8 Geographical distribution of the sea level change trend (units: mm/a)2005-2010 |
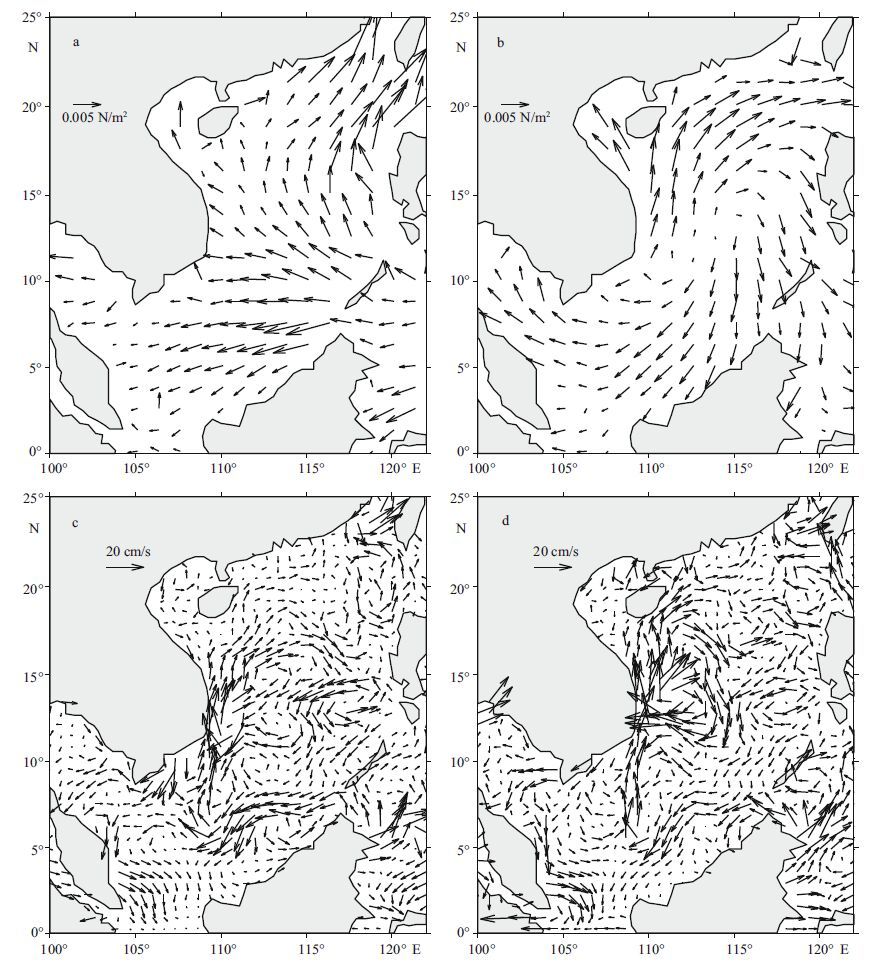
It is interesting to note that the strength of the anticyclonic gyre was much greater during 2002- 2005 than during 1993-1998. The strength of the spring anticyclonic gyre in the SCS was closely associated with the variation of the anticyclonic wind circulation. The anticyclonic circulation center located over the eastern region of the SCS and western Pacific, with easterlies dominating in the central basin of SCS, resulted in the abnormally weak spring anticyclonic gyre during the spring of 1993-1998(Fig. 9a, c). Conversely, during the spring of 2002- 2005, the anticyclonic circulation center was located in the central basin of SCS (Fig. 9b), which induced the negative wind curl anomalies, and led to the strengthening of the spring anticyclonic gyre in the western SCS during this season (Fig. 9d).
|
| Figure 9 Surface wind stress anomalies (N/m 2 ) from CCMP in the SCS during spring in (a) 1993–1998 and (b) 2002–2005; (c) and (d) same as (a) and (b) but for the geostrophic current (cm/s) |
SLA data from multiple satellite altimeter missions over the past 20 years was used to study the interannual to decadal variability of the spring high SLA in the western SCS. We found that there are remarkable interannual to decadal changes in the spring high SLA in the western SCS. The EOF analysis revealed the existence of two dominant modes in the interannual to decadal variability of spring high SLA: the SLCM and the AEM. The former appeared mainly during La Niña years, with the anomalous high SLA in the SCS central basin extending from west of Luzon to the eastern coast of Vietnam, induced by the increase of OHC from the intrusion of abnormally warm North Pacific water into the northern SCS through the Luzon Strait. The latter was closely associated with negative wind curl anomalies driven by the anticyclonic atmospheric circulation during spring on the central SCS. In addition to the notable interannual variability, the first leading mode changed from the AEM in 1993-2005 to the SLCM in recent years (2006-2012). During 2006-2012, a period with prevailing La Niña events, the rapid sea level rise in the central SCS, with the maximum rising trend, exceeded 30 mm/a, which has made the SLCM much more dominant in recent years. Conversely, the AEM, which was dominant during 1993-2004, also experienced distinct decadal variability, with a considerable increase in intensity during 2002-2005. The intensity of the AEM is mainly modulated by the strength and position of the anticyclonic atmospheric circulation on the SCS. As shown in other studies, the WSCA would have more impact on SLA compared with OHCA; however, the WSCA pattern is not consistent with SLAs in the SCS during La Niña. The individual contributions of OHCA and WSCA to the SLAs in the SCS during La Niña, and their potential impacts on climate and weather deserve further investigation through numerical and analytical modeling studies.
7 ACKNOWLEDGEMENTWe are grateful to Dr. WANG Qiang and Dr. ZHAN Jianqiong for discussion and comments on the paper.
| Bayler E J, Liu Z Y, 2008. Basin-scale wind-forced dynamics of the seasonal southern South China Sea gyre. Journal of Geophysical Research, 113 (C7) : C07014 . |
| Björnsson H, Venegas S A. 1997. A manual for EOF and SVD analyses of climate data. CCGCR Report. McGill University, Montreal, Quebec, Canada. p.23-27. |
| Cai S Q, Long X M, Wang S A, 2007. A model study of the summer Southeast Vietnam offshore current in the southern South China Sea. Continental Shelf Research, 27 (18) : 2 357 –2 372. Doi: 10.1016/j.csr.2007.06.002 |
| Carton J A, Chepurin G, Cao X H, Giese B, 2000. A simple ocean data assimilation analysis of the global upper ocean 1950-95. Part I: methodology. Journal of Physical Oceanography, 30 (2) : 294 –309. Doi: 10.1175/1520-0485(2000)030<0294:ASODAA>2.0.CO;2 |
| Chao S Y, Shaw P T, Wu S Y, 1996. El Niño modulation of the South China Sea circulation. Progress in Oceanography, 38 (1) : 51 –93. Doi: 10.1016/S0079-6611(96)00010-9 |
| Chi P C, Chen Y, Lu S H, 1998. Wind-driven South China Sea deep basin warm-core/cool-core eddies. Journal of Oceanography, 54 (4) : 347 –360. Doi: 10.1007/BF02742619 |
| Chu P C, Chang C P, 1997. South China Sea warm pool in boreal spring. Advances in Atmospheric Sciences, 14 (2) : 195 –206. Doi: 10.1007/s00376-997-0019-8 |
| Chu X Q, Xue H J, Qi Y Q, Chen G X, Mao Q W, Wang D X, Chai F, 2014. An exceptional anticyclonic eddy in the South China Sea in 2010. Journal of Geophysical Research, 119 (2) : 881 –897. |
| Dieng H B, Cazenave A, Meyssignac B, Henry O, von Schuckmann K, Palanisamy H, Lemoine J M, 2014. Effect of La Niña on the global mean sea level and north Pacific Ocean mass over 2005-2011. Journal of Geodetic Science, 4 (1) . |
| Fang G H, Chen H Y, Wei Z X, Wang Y G, Wang X Y, Li C Y, 2006. Trends and interannual variability of the South China Sea surface winds, surface height, and surface temperature in the recent decade. Journal of Geophysical Research, 111 (C11) : C11S16 . |
| Fang G H, Wang G, Fang Y, Fang W D, 2012. A review on the South China Sea western boundary current. Acta Oceanologica Sinica, 31 (5) : 1 –10. Doi: 10.1007/s13131-012-0231-y |
| Fang W D, Fang G H, Shi P, Huang Q Z, Xie Q, 2002. Seasonal structures of upper layer circulation in the southern South China Sea from in situ observations. Journal of Geophysical Research, 107 (C11) : 23 –1. |
| Fang W D, Qiu F W, Guo P, 2014. Summer circulation variability in the South China Sea during 2006-2010. Journal of Marine Systems, 137 : 47 –54. Doi: 10.1016/j.jmarsys.2014.04.014 |
| Gan J P, Qu T D, 2008. Coastal jet separation and associated flow variability in the southwest South China Sea. Deep Sea Research Part I: Oceanographic Research Papers, 55 (1) : 1 –19. Doi: 10.1016/j.dsr.2007.09.008 |
| He Z G, Zhang Y, Wang D X, 2013. Spring mesoscale high in the western South China Sea. Acta Oceanologica Sinica, 32 (6) : 1 –5. Doi: 10.1007/s13131-013-0318-0 |
| Ho C R, Zheng Q A, Soong Y S, Kuo N J, Hu J H, 2000. Seasonal variability of sea surface height in the South China Sea observed with TOPEX/Poseidon altimeter data. Journal of Geophysical Research, 105 (C6) : 13 981 –13 990. Doi: 10.1029/2000JC900001 |
| Liu Q Y, Jiang X, Xie S P, Liu W T, 2004. A gap in the IndoPacific warm pool over the South China Sea in boreal winter: seasonal development and interannual variability. Journal of Geophysical Research, 109 (C7) : C07012 . |
| Liu Z Y, Yang H J, Liu Q Y, 2001. Regional dynamics of seasonal variability in the South China Sea. Journal of Physical Oceanography, 31 (1) : 272 –284. Doi: 10.1175/1520-0485(2001)031<0272:RDOSVI>2.0.CO;2 |
| McPhaden M J, 2008. Evolution of the 2006-2007 El Niño: the role of intraseasonal to interannual time scale dynamics. Advances in Geosciences, 14 : 219 –230. Doi: 10.5194/adgeo-14-219-2008 |
| Qiu F W, Fang W D, Fang Y, Guo P, 2012. Anomalous oceanic characteristics in the South China Sea associated with the large-scale forcing during 2006-2009. Journal of Marine Systems, 100-101 : 9 –18. Doi: 10.1016/j.jmarsys.2012.03.010 |
| Qu T D, Mitsudera H, Yamagata T, 2000. Intrusion of the North Pacific waters into the South China Sea. Journal of Geophysical Research, 105 (C3) : 6 415 –6 424. Doi: 10.1029/1999JC900323 |
| Qu T D, 2001. Role of ocean dynamics in determining the mean seasonal cycle of the South China Sea surface temperature. Journal of Geophysical Research, 106 (C4) : 6 943 –6 955. Doi: 10.1029/2000JC000479 |
| Swapna P, Gan J P, Lau A, Fung J, 2009. On the warm/cold regime shift in the South China Sea: observation and modeling study. Deep Sea Research Part I: Oceanographic Research Papers, 56 (7) : 1 039 –1 056. Doi: 10.1016/j.dsr.2009.03.008 |
| Wang B, Zhang Q, 2002. Pacific-East Asian teleconnection. Part Ⅱ: how the Philippine Sea anomalous anticyclone is established during El Niño development. Journal of Climate, 15 (22) : 3 252 –3 265. |
| Wang G H, Chen D K, Su J L, 2006. Generation and life cycle of the dipole in the South China Sea summer circulation. Journal of Geophysical Research, 111 (C6) : C06002 . |
| Wang W Q, Wang C Z, 2006. Formation and decay of the spring warm pool in the South China Sea. Geophysical Research Letters, 33 (2) : L02615 . |
| Wu C R, Shaw P T, Chao S Y, 1998. Seasonal and interannual variations in the velocity field of the South China Sea. Journal of Oceanography, 54 (4) : 361 –372. Doi: 10.1007/BF02742620 |
| Xie S P, Xie Q, Wang D X, Liu W T, 2003. Summer upwelling in the South China Sea and its role in regional climate variations. Journal of Geophysical Research, 108 (C8) : 3 261 . Doi: 10.1029/2003JC001867 |
| Xiu P, Chai F, Shi L, Xue H J, Chao Y, 2010. A census of eddy activities in the South China Sea during 1993-2007. Journal of Geophysical Research, 115 (C3) : C03012 . |
| Yan Y F, Qi Y Q, Zhou W, 2010. Interannual heat content variability in the South China Sea and its response to ENSO. Dynamics of Atmospheres and Oceans, 50 (3) : 400 –414. Doi: 10.1016/j.dynatmoce.2010.07.002 |
 2017, Vol. 35


