 2017, Vol. 35
Institute of Oceanology, Chinese Academy of Sciences
Article Information
- HOU Zhishuai(侯志帅), WEN Haishen(温海深), LI Jifang(李吉方), HE Feng(何峰), LIU Qun(刘群), WANG Jinhuan(王金环), GUAN Biao(管标), WANG Qinglong(王庆龙)
- Effects of varying densities on serum reproductive parameters in pen-reared juvenile female rainbow trout Oncorhynchus mykiss farms
- Chinese Journal of Oceanology and Limnology, 35(1): 98-108
- http://dx.doi.org/10.1007/s00343-016-5172-4
Article History
- Received Jul. 23, 2015
- accepted for publication Sep. 22, 2015
- accepted in principle Dec. 25, 2015


2 Key Laboratory of Mariculture, Ministry of Education, Ocean University of China, Qingdao 266003, China
High rearing density can lead to poor gonadal maturation and poor growth performance for rainbow trout Oncorhynchus mykiss (Berg et al., 1996 ; Skov et al., 2011). A review of previous studies indicates that the majority of negative effects of farming rainbow trout at high densities are manifested in poor fish growth (Larsen et al., 2012) and reductions of respiratory capacity (Skov et al., 2011). In addition, high-density farming has also been shown to affect the welfare behaviors (Laursen et al., 2013) and antioxidation functions (Sahin et al., 2014). These studies, however, lack details regarding how density affects the serum reproductive parameters of the rainbow trout.
Gonadal maturation of rainbow trout is an interesting field of aquaculture and food industry (Schubring, 2004). From the reproduction point of view, good quality eggs (roe) could usually ensure excellent survival rates during incubation and the quantity of fry hatched. For example, World production of salmon increased 2.6-fold from 1970 to 2005 as a result of increased aquaculture, and this increase had led to significant amounts of salmon roe of different sizes and maturity (Bekhit et al., 2009). From the point of using roe for human consumption, roe obtained from the ovaries of females is a wellknown snack in the Mediterranean area (Rodrigo et al., 1998). For processing salmon roe as caviar, the ovaries are most valuable when they are at stage IV, while salmon eggs at stage V have membranes which are too thick to be really acceptable for good caviar (Sternin and Dore, 1993 ; Schubring, 2004).
The synthesis and release of reproductive steroids are primarily under the control of follicle-stimulating hormone (FSH) and luteinizing hormone (LH). Both FSH and LH mediate steroid hormones production within the follicular cells surrounding the oocyte (Nagahama, 1994). Studies have demonstrated that FSH plays a primary role in the regulation of oocyte growth and folliculogenesis whereas LH plays a primary role in the regulation of final maturation (Richards, 1994 ; Luckenbach et al., 2013). Estradiol (E2) is regulated by both FSH and LH and is known to induce the synthesis and release of liver vitellogenin ((vg), Kagawa et al., 1981 ; Nagler et al., 2012). In salmonids (synchronous gonadal development species), serum testosterone (T) level in females matches the patterns of E2 during vitellogenin synthesis (King and Pankhurst, 2003). 17α, 20βdihydroxy4-pregnen-3-one (17α, 20β-P) regulates the final stages of oocyte maturation and is considered to be the maturation inducing steroid ((MIS), Thomas, 1994 ; Pramanick et al., 2013).
Rainbow trout are reared extensively in fresh water reservoirs through pen-reared culture systems for intensive farming. In these culture systems, profitability largely depends on the volumes of production, which seems to have a correlation with rearing density. Previous studies were designed to evaluate the effect of varying rearing densities on growth performance and the humoral immune system (Morgan et al., 2008 ; Larsen et al., 2012). However, there is little information regarding the reproductive parameters of rainbow trout at varying pen-reared rearing density.
The present study was designed to evaluate the effect of varying rearing densities on serum reproductive parameters of rainbow trout in puberty reared under intensive conditions in pen-reared culture systems. Effects of varying rearing densities on serum gonadotropin (LH, FSH), sexual steroid hormone (E2, T, 17α, 20β-P), vitellogenin as well as GSI were evaluated. These reproductive parameters were also measured in different ovarian development stages of rainbow trout from varying densities. The relationships of rearing density with serum reproductive parameters are presented within the context of the reproductive endocrine processes.
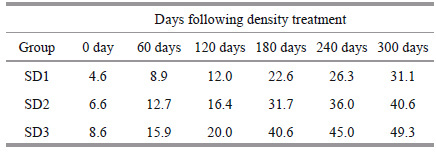
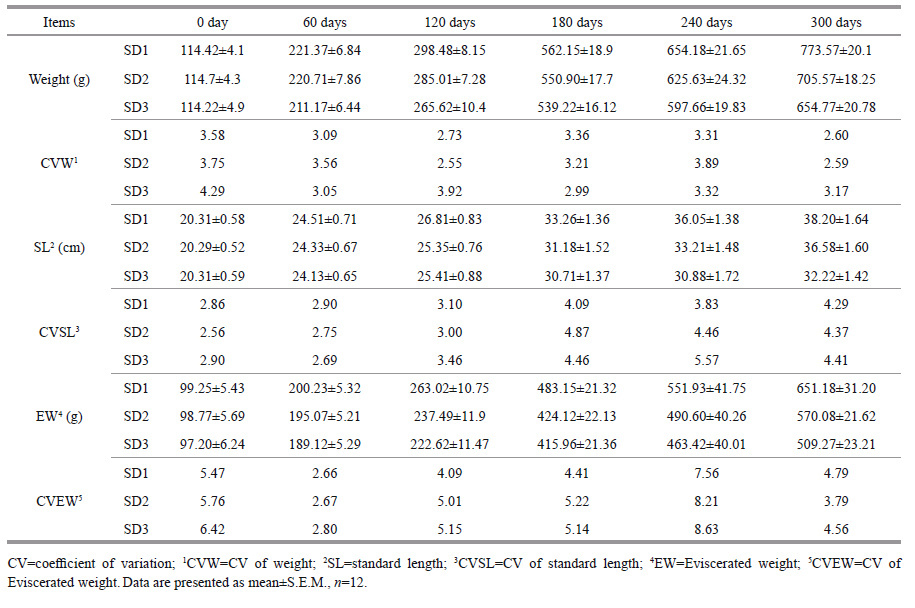
2 MATERIAL AND METHOD 2.1 Experimental designRainbow trout ((114.44±5.21) g, (19.69±0.31) cm) used in this study were fed and maintained in penreared farms (3 m×3 m×3 m) in Liujia Gorge Reservoir (fresh water reservoir) in Gansu Province, China for a period of 300 days (from May 2011 to March 2012). The initial stocking densities were 40 ind./m3(4.6 kg/m3) as SD1; 60 ind./m3(6.6 kg/m3) as SD2; 80 ind./m3(8.6 kg/m3) as SD3 and the final densities (in the final phase of the experiment) were 31.1 kg/m3 for SD1; 40.6 kg/m3 for SD2 and 49.3 kg/m3 for SD3(Table 1). Three pen-reared cages at each density. The growth performance is shown in supplementary Table 2. Low and high stocking densities were considered as 40 ind./m3(4.6 kg/m3) and 80 ind./m3(8.6 kg/m3) according to the standards of aquaculture industry (private information from Gansu Fisheries Research Institute and Liujia Gorge Fish Farm). All trout were spawned on the same day and all were therefore at the same reproductive stage when entering the first gonad development. Before distribution into different densities, the fish never entered the reproductive cycle. Fish were fed two times a day (pellet diet: protein (40%), fat (26%), carbohydrate (14%)) and water quality in the cages was constantly monitored once a week (Supplementary Table 1). Factors checked included pH, temperature, ammonia nitrogen and dissolved oxygen. During the experimental period, temperature ranged from 8.51 to 18.2℃, pH ranged from 8.5 to 8.9 and under a nature photoperiod. Maximum NH 4 + -N at SD1, SD2, SD3 were 0.53±0.05(mean±S.E., the same below), 0.55±0.01, and 0.60±0.06(mg/L) respectively, mean NH 4 +-N at SD1, SD2, SD3 were 0.38±0.07, 0.40±0.08 and 0.45±0.10(mg/L). Minimum dissolved oxygen at SD1, SD2, SD3 were 6.5±0.22, 6.3±0.35 and 5.4±0.31(mg/L) respectively, mean dissolved oxygen at SD1, SD2, SD3 were 6.93±0.36, 6.71±0.50 and 6.61±0.75(mg/L). Mortality at SD1, SD2 and SD3 were 2.21±0.21%, 2.48±0.24% and 3.35±0.14% respectively during the experimental period (Supplementary Table 1). Experimental procedures were performed by workers specifically trained.
|
|
|
|
Twelve rainbow trout were removed from each of three densities every 60 days over the course of 300 days. They were anesthetized by MS-222(35- 45 mg/L) for 10 minutes and then killed. The weight (g), body length (cm), ovary weight (g), liver weight (g), eviscerated weight (g) were recorded to calculate the GSI (gonad somatic index; GSI=ovary weight/ eviscerated weight), and HSI (hepatic somatic index; HSI=liver weight/eviscerated weight). Blood was sampled by using a 1.5-mL syringe from caudal vessels and the serum was separated from the blood by centrifugation and frozen at -80℃. Small portions of the ovaries were excised and immediately placed in a 1.5-mL EP tube (RNase-free) and eventually frozen at -80℃ for storage. Small pieces sampled from the middle of the ovary were fixed in Bouin's fluid for histology classification (Nagler et al., 2012).
According to the histological observations of the ovaries, the teleost were grouped into six stages: stage I, perinucleolar; stage II, previtellogenic; stage III, vitellogenic; stage IV, postvitellogenic; stage V, spawning; stage VI, spent (Pramanick et al., 2013). In this experiment, ovaries were mainly at stage II (previtellogenic), stage III (vitellogenic) and stage IV (postvitellogenic).
2.3 Sexual steroid hormone (T and E2) radioimmunoassay (RIA)A commercial radioimmunoassay kits (Tianjin Nine Tripods Medical & Bioengineering Co. Ltd., Sino-US joint-venture enterprise) were used to detect the Iodine isotope [125I] to measure T and E2 concentrations in serum. Previous studies demonstrated details and methods of radioimmunoassay (Wen et al., 2006).
2.4 Gonadotropin, 17, 20beta-P and vitellogenin enzyme-linked immunosorbent assay (ELISA)The ELISA kits (RD Biosciences, USA) for rainbow trout serum vg, LH, FSH and 17, 20beta-P level analysis were made the use of purified fish antibody to make solid-phase antibody. Combined antibody with HRP (Horse Reddish Peroxidase) labeled had become to antibody-antigen-enzymeantibody complex. After washing completely, TMB substrate (3, 3, 5, 5 tetramethylbenzidine Substrate, a kind of Color-substrate solution) solution was added. Reaction was terminated by the addition of a sulphuric acid solution and the color change was measured spectrophotometrically at a wavelength of 450 nm by microplate reader. The concentrations of gonadotropin, 17, 20beta-P and vitellogenin in the samples (10 μL) were then determined by comparing the O.D. of the samples to the standard curve.
2.5 Statistical analysisReproductive parameters (gonadotropin, sexual steroid hormone and vg) subjected to one-way analysis of variance (ANOVA) and differences among means were analyzed via Duncan's multiple comparison range test with a level of significance set at P<0.05. Statistical analysis was shown among three different rearing densities. Moreover, these reproductive parameters were also grouped by ovarian development stage for statistical data analysis (P<0.05, one-way ANOVA, followed by Duncan's multiple Range test). All data were analyzed using the SPSS17 program. Results are expressed as mean±S.E.
3 RESULT 3.1 Histological observations on ovaries of the female rainbow troutDuring the experiment, no juvenile female rainbow trout in the ovarian development stage were found to be the final maturation stage (stage V, Supplementary Fig. 1). A summary of the histological examination of ovaries at 180, 240 and 300 days were given respectively in Fig. 1. Histological observation revealed that ovarian development was unified within SD1 and SD2 trout population at 180 days (Fig. 1a, b, c). Most ovaries had reached ovarian stage III and IV at SD1 and SD2 at 240 days, however, 41.7% of ovaries at SD3 remained in ovarian stage II at the same time, which occupied the largest proportion at three densities (Fig. 1d, e, f). 58.4% and 33.3% of females had reached ovarian stage IV at SD1 and SD2, whereas only 16.7% of females had reached ovarian stage IV at SD3 at 300 days (Fig. 1g, h, i).

|
| Figure 1 A summary of the histological examination of the ovarian stages at 180, 240 and 300 days of the female rainbow trout a: a summary of ovaries at 180 days at SD1; b: a summary of ovaries at 180 days at SD2; c: a summary of ovaries at 180 days at SD3; d: a summary of ovaries at 240 days at SD1; e: a summary of ovaries at 240 days at SD2; f: a summary of ovaries at 240 days at SD3; g: a summary of ovaries at 300 days at SD1; h: a summary of ovaries at 300 days at SD2; i: a summary of ovaries at 300 days at SD3. Figures show that the number of trout in specific ovarian stage. n =12 for each pie chart. |

|
| Supplementary Figure 1 The histological observations on ovary of the female rainbow trout during experiments a. the oocyte in the stage II (the scale is 50 μm); b. the oocyte in the stage III (the scale is 100 μm); c. the oocyte in the stage IV (the scale is 50 μm). |
GSI of SD1 increased throughout the experiment, whereas decreased GSI trends of SD2 and SD3 were seen at 300 days. GSI of SD3 were decreased and significantly lower than those of SD1 and SD2 at 300 days. Significant differences in GSI between SD1 and SD2 were noted at 300 days as GSI of SD2 were decreased (Fig. 2a). We also analyze GSI levels in different stages of ovarian development for all density groups. In ovarian stage III, GSI of SD1 were significantly higher than those of SD2 and SD3. In ovarian stage IV, GSI of trout in all density groups showed significant differences (Fig. 2b).

|
| Figure 2 Changes of GSI (Gonad somatic index) among three stocking densities (a), grouped by ovarian development stage (b) and changes of HSI (Hepatic somatic index) among three stocking densities (c), grouped by ovarian development stage (d) Data are presented as mean±S.E., n =12. Different superscript letters within one sample time (a, c) and same ovarian development stage (b, d) indicate significant differences (P<0.05, one-way ANOVA, followed by Duncan's multiple Range test). |
Trout displayed increasing HSI from 60 to 120 days, and HSI were relatively stable from 120 to 240 days. At 300 days, decreasing trends in HSI were observed at SD1, SD2 and SD3. There were no significant differences in HSI among densities throughout the experiment (Fig. 2c). In ovarian stage II, HSI of SD1 were significantly higher than those of SD3. In ovarian stage III and IV, HSI showed no significant differences among densities (Fig. 2d).

|
| Figure 3 Changes of FSH (Follicle-Stimulating Hormone) among three stocking densities (a), grouped by ovarian development stage (b) and changes of LH (Luteinizing Hormone) among three stocking densities (c), grouped by ovarian development stage (d) Data are presented as mean±S.E., n =4. Different superscript letters within one sample time (a, c) and same ovarian development stage (b, d) indicate significant differences (P<0.05, one-way ANOVA, followed by Duncan's multiple Range test). |
FSH of SD1 and SD2 increased from 0 to 180 days. At 180 and 240 days, FSH of SD3 were significantly lower than those of SD1 and SD2. Subsequently, trout displayed decreasing FSH patterns at SD1 and SD2, and FSH of trout in all density groups showed no significant differences (Fig. 3a). FSH displayed increasing levels from ovarian stage II to III and reduced trends from ovarian stage III to IV. FSH of SD3 were significantly lower than those of SD1 and SD2 in ovarian stage III (Fig. 3b).
LH increased continuously from 120 to 300 days. At 300 days, LH of SD1 were significantly higher than those of SD3(Fig. 3c). LH increased from ovarian stage II to ovarian stage IV in each density group. No significant differences in LH were observed among densities in different ovarian stages (Fig. 3d).
3.4 Sexual steroid hormone levels of the female rainbow trout 3.4.1 Changes of E2 levels among and within densities as well as grouped by ovarian developmentTrout in SD1 groups showed increasing E2 from 0 to 240 days, whereas decreasing levels in E2 of SD1were seen at 300 days. Moreover, E2 of SD2 and SD3 were relatively stable at low levels from 60 to 180 days. At 60 days, E2 of SD3 were significantly lower than those of SD1 and SD2. E2 levels from 120 to 300 days showed significantly decreasing levels with increasing densities for all density groups (Fig. 4a). E2 increased continuously from ovarian stage II to ovarian stage IV. In the ovarian stage IV, E2 of SD1 were significantly higher than those of SD2 and SD3(Fig. 4b).

|
| Figure 4 Changes of E2(Estradiol) among three stocking densities (a), grouped by ovarian development stage (b) and changes of T (Testosterone) among three stocking densities (c), grouped by ovarian development stage (d) Data are presented as mean±S.E., n =12. Different superscript letters within one sample time (a, c) and each ovarian development stage (b, d) indicate significant differences (P<0.05, one-way ANOVA, followed by Duncan's multiple Range test). |
T of SD1 increased throughout the experiment. A fluctuating trends in T of SD2 and SD3 were seen from 120 to 240 days. At 300 days, trout showed reduced T in SD2 and SD3 groups. SD1 showed significantly higher T levels than those of SD2 and SD3 from 180 days to 300 days. Significant differences in T levels were observed between SD2 and SD3 at 300 days (Fig. 4c). T increased continuously from ovarian stage II to IV at SD1 and SD2, and T levels of SD3 were relatively stable. In ovarian stage III and IV, T of SD1 were significantly higher than those of SD2 and SD3(Fig. 4d).
3.4.3 Changes of 17α, 20β-P levels among and within densities as well as grouped by ovarian development17α, 20β-P displayed increasing trends from 120 to 300 days for all density groups. No significant differences in 17α, 20β-P levels were seen among densities from 0 to 180 days, whereas 17α, 20β-P of SD1 were significantly higher than those of SD2 and SD3 at 240 and 300 days (Fig. 5a). 17α, 20β-P increased from ovarian stage II to IV. In ovarian stage IV, 17α, 20β-P of SD1 were significantly higher than those of SD2 and SD3(Fig. 5b).
3.5 Changes of vitellogenin levels among and within densities as well as grouped by ovarian developmentVitellogenin of the three density groups increased throughout the experiment. At 240 and 300 days, serum vitellogenin levels of SD2 and SD3 showed significantly decreasing levels in comparison to those of SD1(Fig. 5c). Vitellogenin increased continuously from ovarian stage II to IV. In ovarian stage IV, serum vitellogenin of SD1 were significantly higher than those of SD2 and SD3(Fig. 5d).
4 DISCUSSIONRearing density is an important element for fish rearing and high density can influence the gonadal development (Berg et al., 1996). GSI is an important index to gonad development. In the present study, rainbow trout at highest density showed significant decreases of GSI and the lowest proportion of ovaries in ovarian stage IV at 300 days (SD3, at 49.3 kg/m3). This finding suggests that female rainbow trout reared at 40-50 kg/m3 were not able to adjust to the increasing density in terms of the ovarian development under the pen-reared culture systems in a fresh water reservoir or lake. Fish could be either positively or negatively affected by rearing density. High density may result in stress (Leatherland and Cho, 1985), but studies measuring plasma cortisol (an important stress response parameter) in rainbow trout which have been held over a range of densities are contradictory— with no effect, a transient adverse effect, a sampletime dependent effect, and even a favourable effect being found (Ellis et al., 2002). Although with some fish species, positive effects of density have been shown (Jørgensen et al., 1993). As regarded GSI patterns in our experiment, rearing density retarded ovarian development obviously when density reached 45 kg/m3. Further exploration is warranted to investigate whether the metabolism or immune function of rainbow trout is influenced at about 40- 50 kg/m3, as humoral and immune parameters did not change in Dicentrarchus labrax (Di Marco et al., 2008) and Solea senegalensis (Andrade et al., 2015). Moreover, significantly lower GSI levels in ovarian stage III and IV indicated that ovarian development was retarded in rainbow trout at SD2 and SD3(initially stocked at 6.6 and 8.6 kg/m3) as density increased.

|
| Figure 5 Changes of 17α, 20β-P (17α, 20β dihydroxy 4- pregnen-3-one) among three stocking densities (a), grouped by ovarian development stage (b) and changes of vg (vitellogenin) among three stocking densities (c), grouped by ovarian development stage (d) Data are presented as mean±S.E., n =4 for 17α, 20β-P and n =12 for vg. Different superscript letters within one sample time (a, c) and same ovarian development stage (b, d) indicate significant differences (P<0.05, one-way ANOVA, followed by Duncan's multiple Range test). |
Activation of the brain-pituitary-gonad (BPG) axis triggers puberty in teleosts, mediated by FSH and LH. Previous studies have shown that increasing FSH levels were observed during vitellogenin synthesis in Atlantic salmon (Salmo salar)(Oppen-Berntsen et al., 1994). In addition LH levels, which is initially low, increases during vitellogenin synthesis and peaks in fully mature females (Andersson et al., 2013). In our studies, the lowest density (SD1) presented FSH and LH levels comparable to previous descriptions, whereas, in comparison to those of SD1, the serum FSH and LH levels at SD3 showed significantly decreasing levels during the time period when most of the ovaries were involved in the accumulation of vitellogenin (180 to 300 days). The significantly decreasing levels of both serum FSH and LH are consistent with the recognized reproductive effects of rearing density in retarding pubertal activation (Siikavuopio et al., 2007) and 40.6(180 days) or 49.3(300 days) kg/m3 were the densities at which serum FSH or LH levels became retarded in SD3 group.
In fish, sex steroid synthesizing increases and gamete maturation is initiated via binding to and activation of the FSH and LH receptors in the gonads (Levavi-Sivan et al., 2010). In the present study, significantly higher levels of FSH, E2 and T at SD1 at 180 and 240 days were mostly consistent with the recognized role of FSH in synthesizing and releasing ovarian steroid hormones (Swanson et al., 2003). However, high density caused lower FSH, E2, and T at SD3 at 180 and 240 days among the varying densities. Moreover, significantly reduced trends of E2 and T within SD2 and SD3 at 300 days (40.6 and 49.3 kg/m3) were observed. These findings suggest that sex steroid synthesis was retarded. Rainbow trout within SD3(initially stocked at 8.6 kg/m3) showed significantly lower levels of E2 and T than those at SD1(initially stocked at 4.6 kg/m3) in ovarian stage IV, indicating that the accumulative effects of intensive rearing may retard the synthesis of sex steroids.
17α, 20β-P is the most effective steroid in the induction of final oocyte maturation in the majority of teleost species (Nagahama and Yamashita, 2008). Previous studies have also indicated that E2 and 17α, 20β-P exert a synergistic effect on the reproductive axis and often act in sequence (Atteke et al., 2003). In our study, complementary trends of E2 and 17α, 20β-P were also observed (viz. 17α, 20β-P showed rising patterns at 240 days when E2 exerted reduced patterns). Our finding that 17α, 20β-P levels within SD1 increased continuously from 180 to 300 days when most trouts were in the rapid vitellogenin synthesizing stage is consistent with the previous observation that 17α, 20β-P appeared in the circulation for the first time during the vitellogenin synthesizing stage and abruptly increased at the time of oocyte maturation (Pramanick et al., 2013). However, high rearing density led to 17α, 20β-P levels at SD2 and SD3 showed significantly decreasing levels in comparison to SD1, which may prevent further recruitment of oocytes in stage III from entering into rapid vitellogenin accumulation and limit further developmental chances for oocytes at stage IV (viz. low percentage of oocytes in stage IV at 40.6(SD2) and 49.3(SD3) kg/m3 at 300 days). In addition, these results correspond to previous studies indicating that final oocyte maturation in carp (Labeo rohita) and rainbow trout are regulated by 17α, 20β-P (Yoshikuni et al., 1993 ; Sen et al., 2002).
E2 is responsible for the hepatic production of vitellogenin (Nagler et al., 2012). This has been most convincingly established by gene knockdown experiments in the goldfish (Nelson and Habibi, 2010). In the present study, serum vitellogenin levels were in accordance with serum E2 patterns from 240 to 300 days among the varying densities. In comparison to SD1, significantly reduced levels of serum vitellogenin at SD2 and SD3 were seen from 240 to 300 days. This observation suggests that vitellogenin synthesizing in liver was retarded when the density was over 36 kg/m3.
5 CONCLUSIONIn conclusion, under the present pen-reared experimental conditions, overall patterns of serum reproductive production in the rainbow trout at lower densities (SD1) were regular and in accordance with previous studies. Ovarian development, however, was not unified as a function of time under different rearing densities. Most notably, ovarian development was retarded at higher rearing densities (from stage III to stage IV) as results of GSI, FSH, LH, E2, T, 17α, 20β-P and vitellogenin levels decreased with increasing densities, particularly at SD3. Moreover, comparison of ovaries at the same developmental stages revealed that serum reproductive parameters at high density (SD3) exhibited significantly decreasing levels compared to those in the low density (SD1) group. Based on our experiment, this observation is likely attributable to the cumulative results of dense rearing condition. Therefore, based on our findings, we suggest that rainbow trout (114.44±5.21 g, 19.69±0.31 cm) that are initially stocked at 6.6 or 8.6 kg/m3 for commercial roe should be subdivided into lower density groups after 180 days' farming (31.7 kg/m3) while maintaining the water quality is at a suitable level (as mentioned in 2.1, Supplementary Table 1).
| Andersson E, Schulz R W, Male R, et al, 2013. Pituitary gonadotropin and ovarian gonadotropin receptor transcript levels: seasonal and photoperiod-induced changes in the reproductive physiology of female Atlantic salmon(Salmo salar). General and Comparative Endocrinology, 191 : 247 –258. Doi: 10.1016/j.ygcen.2013.07.001 |
| Andrade T, Afonso A, Pérez-Jiménez A, et al, 2015. Evaluation of different stocking densities in a Senegalese sole (Solea senegalensis) farm: implications for growth, humoral immune parameters and oxidative status. Aquaculture, 438 : 6 –11. Doi: 10.1016/j.aquaculture.2014.12.034 |
| Atteke C, Vetillard A, Fostier A, et al, 2003. Effects of progesterone and estradiol on the reproductive axis in immature diploid and triploid rainbow trout. Comparative Biochemistry and Physiology Part A: Molecular & Integrative Physiology, 134 (4) : 693 –705. |
| Bekhit A E D A, Morton J D, Dawson C O, Zhao J H, Lee H Y Y, 2009. Impact of maturity on the physicochemical and biochemical properties of chinook salmon roe. Food Chemistry, 117 (2) : 318 –325. Doi: 10.1016/j.foodchem.2009.04.009 |
| Berg A J, Sigholt T, Seland A, Danielsberg A, 1996. Effect of stocking density, oxygen level, light regime and swimming velocity on the incidence of sexual maturation in adult Atlantic salmon (Salmo salar). Aquaculture, 143 (1) : 43 –59. Doi: 10.1016/0044-8486(96)01256-2 |
| Di Marco P, Priori A, Finoia M G, et al, 2008. Physiological responses of European sea bass Dicentrarchus labrax to different stocking densities and acute stress challenge. Aquaculture, 275 (1-4) : 319 –328. Doi: 10.1016/j.aquaculture.2007.12.012 |
| Ellis T, North B, Scott A P, Bromage N R, Porter M, Gadd D, 2002. The relationships between stocking density and welfare in farmed rainbow trout. Journal of Fish Biology, 61 (3) : 493 –531. Doi: 10.1111/jfb.2002.61.issue-3 |
| Jørgensen E H, Christiansen J S, Jobling M, 1993. Effects of stocking density on food intake, growth performance and oxygen consumption in Arctic charr (Salvelinus alpinus). Aquaculture, 110 (2) : 191 –204. Doi: 10.1016/0044-8486(93)90272-Z |
| Kagawa H, Takano K, Nagahama Y, 1981. Correlation of plasma estradiol-17β and progesterone levels with ultrastructure and histochemistry of ovarian follicles in the white-spotted char, Salvelinus leucomaenis. Cell and Tissue Research, 218 (2) : 315 –329. |
| King H R, Pankhurst N W, 2003. Ovarian growth and plasma sex steroid and vitellogenin profiles during vitellogenesis in Tasmanian female Atlantic salmon (Salmo salar). Aquaculture, 219 (1-4) : 797 –813. Doi: 10.1016/S0044-8486(02)00647-6 |
| Larsen B K, Skov P V, McKenzie D J, et al, 2012. The effects of stocking density and low level sustained exercise on the energetic efficiency of rainbow trout (Oncorhynchus mykiss) reared at 19℃. Aquaculture, 324-325 : 226 –233. Doi: 10.1016/j.aquaculture.2011.10.021 |
| Laursen D C, Silva P I M, Larsen B K, et al, 2013. High oxygen consumption rates and scale loss indicate elevated aggressive behaviour at low rearing density, while elevated brain serotonergic activity suggests chronic stress at high rearing densities in farmed rainbow trout. Physiology & Behavior, 122 : 147 –154. |
| Leatherland J F, Cho C Y, 1985. Effect of rearing density on thyroid and interrenal gland activity and plasma hepatic metabolite levels in rainbow trout, Salmo gairdneri, Richardson. Journal of Fish Biology, 27 (5) : 583 –592. Doi: 10.1111/jfb.1985.27.issue-5 |
| Levavi-Sivan B, Bogerd J, Mañanós E L, et al, 2010. Perspectives on fish gonadotropins and their receptors. General and Comparative Endocrinology, 165 (3) : 412 –437. Doi: 10.1016/j.ygcen.2009.07.019 |
| Luckenbach J A, Yamamoto Y, Guzmán J M, et al, 2013. Identification of ovarian genes regulated by folliclestimulating hormone (Fsh) in vitro during early secondary oocyte growth in coho salmon. Molecular and Cellular Endocrinology, 366 (1) : 38 –52. Doi: 10.1016/j.mce.2012.11.015 |
| Morgan A L, Thompson K D, Auchinachie N A, et al, 2008. The effect of seasonality on normal haematological and innate immune parameters of rainbow trout Oncorhynchus mykiss L. Fish & Shellfish Immunology, 25 (6) : 791 –799. |
| Nagahama Y, Yamashita M, 2008. Regulation of oocyte maturation in fish. Development,Growth&Differentiation, 50 (S1) : S195 –S219. |
| Nagahama Y, 1994. Endocrine regulation of gametogenesis in fish. International Journal of Developmental Biology, 38 (2) : 217 –229. |
| Nagler J J, Cavileer T D, Verducci J S, et al, 2012. Estrogen receptor mRNA expression patterns in the liver and ovary of female rainbow trout over a complete reproductive cycle. General and Comparative Endocrinology, 178 (3) : 556 –561. Doi: 10.1016/j.ygcen.2012.06.010 |
| Nelson E R, Habibi H R, 2010. Functional significance of nuclear estrogen receptor subtypes in the liver of goldfish. Endocrinology, 151 (4) : 1668 –1676. Doi: 10.1210/en.2009-1447 |
| Oppen-Berntsen D O, Olsen S O, Rong C J, et al, 1994. Plasma levels of eggshell zr-proteins, estradiol-17β, and gonadotropins during an annual reproductive cycle of Atlantic salmon (Salmo salar). Journal of Experimental Zoology, 268 (1) : 59 –70. Doi: 10.1002/(ISSN)1097-010X |
| Pramanick K, Kundu S, Paul S, et al, 2013. Changes in plasma steroid levels during oocyte development in Indian shad, Tenualosa ilisha (Hamilton, 1822): role of gonadotropins on in vitro steroid production and development of oocyte maturational competence. Animal Reproduction Science, 141 (3-4) : 177 –188. Doi: 10.1016/j.anireprosci.2013.08.009 |
| Richards J A S, 1994. Hormonal control of gene expression in the ovary. Endocrine Reviews, 15 (6) : 725 –751. Doi: 10.1210/edrv-15-6-725 |
| Rodrigo J, Ros G, Periago M, López C, Ortuño J, 1998. Proximate and mineral composition of dried salted roes of hake (Merluccius merluccius, L. ) and ling (Molva molva, L.). Food Chemistry, 63 (2) : 221 –225. |
| Sahin K, Yazlak H, Orhan C, et al, 2014. The effect of lycopene on antioxidant status in rainbow trout (Oncorhynchus mykiss) reared under high stocking density. Aquaculture, 418-419 : 132 –138. Doi: 10.1016/j.aquaculture.2013.10.009 |
| Schubring R, 2004. Differential scanning calorimetric (DSC) measurements on the roe of rainbow trout (Oncorhynchus mykiss): influence of maturation and technological treatment. Thermochimica Acta, 415 (1-2) : 89 –98. Doi: 10.1016/j.tca.2003.09.020 |
| Sen U, Mukherjee D, Bhattacharyya S P, et al, 2002. Seasonal changes in plasma steroid levels in Indian major carp Labeo rohita: influence of homologous pituitary extract on steroid production and development of oocyte maturational competence. General and Comparative Endocrinology, 128 (2) : 123 –134. Doi: 10.1016/S0016-6480(02)00060-6 |
| Siikavuopio S I, Dale T, Mortensen A, 2007. The effects of stocking density on gonad growth, survival and feed intake of adult green sea urchin (Strongylocentrotus droebachiensis). Aquaculture, 262 (1) : 78 –85. Doi: 10.1016/j.aquaculture.2006.09.045 |
| Skov P V, Larsen B K, Frisk M, et al, 2011. Effects of rearing density and water current on the respiratory physiology and haematology in rainbow trout, Oncorhynchus mykiss at high temperature. Aquaculture, 319 (3-4) : 446 –452. Doi: 10.1016/j.aquaculture.2011.07.008 |
| Sternin V, Dore I. 1993. Caviar: the Resource Book. Cultura, Stanwood, WA, US. |
| Swanson P, Dickey J T, Campbell B, 2003. Biochemistry and physiology of fish gonadotropins. Fish Physiology and Biochemistry, 28 (1-4) : 53 –59. Doi: 10.1023/B:FISH.0000030476.73360.07 |
| Thomas P. 1994. Hormonal control of final oocyte maturation in sciaenid fishes. In: Davy K G ed. Perspectives in Comparative Endocrinology. National Research Council of Canada, Ottawa, p.619-625. |
| Wen H S, Song H X, Yang L T, et al, 2006. A study on the effects of exogenous hormone on the plasma testosterone and estradiol levels in cultured Japanese flounder. Acta Oceanologica Sinica, 28 (4) : 115 –120. |
| Yoshikuni M, Shibata N, Nagahama Y, 1993. Specific binding of. Fish Physiology and Biochemistry, 11 (1-6) : 15 –24. Doi: 10.1007/BF00004546 |