 2017, Vol. 35
Institute of Oceanology, Chinese Academy of Sciences
Article Information
- HAN Zhaofang(韩兆方), XIAO Shijun(肖世俊), LIU Xiande(刘贤德), LIU Yang(刘洋), LI Jiakai(李佳凯), XIE Yangjie(谢仰杰), WANG Zhiyong(王志勇)
- De novo characterization of Larimichthys crocea transcrip-tome for growth-/immune-related gene identification and massive microsatellite (SSR) marker development
- Chinese Journal of Oceanology and Limnology, 35(2): 225-234
- http://dx.doi.org/10.1007/s00343-016-5288-6
Article History
- Received Nov. 18, 2015
- accepted in principle Jan. 4, 2016
- accepted for publication Jan. 11, 2016


The large yellow croaker, Larimichthys crocea is one of the most important economic marine fish in China and East Asia (Wang et al., 2014). However, since the 1970s wild L. crocea fishery resources have collapsed owing to overfishing (Ye et al., 2010). To maintain wild populations and to protect their germplasm, artificial breeding techniques have been established and applied for L. crocea in China since 1987 (Hong and Zhang, 2003). In the last few years, a number of reports about gene functional analysis for meat quality, growth traits and disease resistance have been published (Mu et al., 2010; Zhou et al., 2010). Despite scientific progress, scientists still need massive genomic transcriptomic sequences for genetic analysis of important economic traits in L. crocea. In addition, polymorphic molecular markers developed from those sequence resources could play an important role in genetic resource management, wild population estimation, and markerassisted selection of L. crocea. However, molecular markers, especially for those functional markers that are directly linked with functional genes, are still insufficient for genetic studies.
The advent of next generation sequencing (NGS) technologies have profoundly reshaped biological research, including bio-medical and agriculture studies (Lapunzina et al., 2014). RNA sequencing (RNA-Seq), an implementation of NGS on transcriptome research, has prompted gene expression analyses of various species, enabling scientists to identify functional genes in living cells and to develop functional markers in a high-throughput manner (Wang et al., 2009). For molecular markers, simple sequence repeats (SSR) are ubiquitous in eukaryotic genomes and are frequently used in genetics and population studies, such as linkage map construction, bio-diversity assessment, and genome selection studies because of their high level of polymorphism and co-dominant inheritance (Lü et al., 2013). As a result, SSR has recently become one of the most prevalent molecular markers used in many species, especially for non-model animals in agricultural studies (Kang et al., 2012; Luo et al., 2012). Although molecular markers developed conventionally based on genomic sequences exhibited abundant polymorphism, the majority of markers are located in non-coding regions (Wang et al., 2012), implying that they are unlikely to be closely associated with functional genes and important traits. To improve efficiency of marker-assisted selection in the aquaculture industry, functional markers from transcript sequences have been developed for many species. Previous molecular marker development in aquaculture organisms, such as in yellow catfish and crucian carp (Liao et al., 2013; Zhang et al., 2014), showed that RNA-seq provided valuable sequence resources for functional molecular marker development since many sequences were proteincoding and regulation genes in living cells. However, 454 pyrosequencing based transcriptome and functional SSR marker analysis for L. crocea have not yet been reported.
In this work, we sequenced and assembled L. crocea transcriptome from liver tissues by taking advantage of the 454 pyrosequencing platform. 93 801 transcripts were assembled and 41.4% were successfully annotated by public databases. Genes involved in important economic traits of L. crocea, including growth and immunity, were identified. To develop functional SSR markers and to assess the polymorphisms of these markers, potential SSR loci were detected from the assembled transcripts, and thirty SSR loci were randomly selected for polymorphism validation in thirty individuals. This is the first 454 pyrosequencing transcriptome analysis of L. crocea and the research offers valuable sequence resources, as well as molecular markers, for wild population conservation, important trait association, and marker-assisted selection studies of this important species.
2 MATERIAL AND METHOD 2.1 Sample collection and RNA extractionTo obtain proper samples for sequencing, liver tissues from 10 L. crocea were collected from the aquaculture farm of Jimei University, Ningde, Fujian, China. Total RNA was extracted from liver samples by TRIZOL RNA isolation procedures and pooled together for sequencing. The transcriptomic RNA concentration was quantified using a Nanodrop ND-2000 spectrophotometer (Thermo Fisher Scientific, Wilmington, DE) and RNA quality was assessed on agarose gel electrophoresis.
2.2 Library construction and 454 sequencingThe pooled-RNA was used for cDNA library construction, following the preparation protocol for Roche 454 sequencing. Approximately 10 μg of sheared cDNA was used for GS20-454 sequencing. A homemade Perl script was written to remove vector and ambiguous bases from raw sequences. All transcriptome sequence data were submitted to the National Center for Biotechnology Information (NCBI) SRA (Short Read Archive) with the project accession number PRJNA279244.
2.3 Transcriptome assembly and functional annotationThe high quality reads were assembled with Newbler (Zerbino and Birney, 2008) to construct unique consensus sequences. The assembled transcripts were then compared with NCBI nt and nr databases by BLAST programs (Altschul et al., 1997) with an E-value threshold of 1×10⁻⁵. Furthermore, the transcripts were searched against Swiss-Prot, COG database with BLAST at an E-value cutoff of 1×10⁻¹⁰. A Perl script was written to assign the functional class to assembled transcripts for the COG database. KAAS (KEGG Automatic Annotation Server) (Moriya et al., 2007) was used to assign KEGG Orthology (KO) and pathway information to transcripts. The sequences were finally annotated in the InterPro database with InterProScan (Zdobnov and Apweiler, 2001) and functional assignments were mapped onto the GO database by blast2GO (Conesa et al., 2005). The web-based program WEGO (Ye et al., 2006) was used with default parameters for GO term classification and visualization.
2.4 Functional SSR marker detectionBecause it is hard to distinguish real mononucleotide repeats from single nucleotide stretch error in 454 sequencing, mononucleotide repeats were excluded in this study. Transcriptome SSR detection was performed using the Perl program MIcroSAtellite (MISA) (Thiel et al., 2003) with the default parameters. A minimum repeat number of 6, 5, 5, 5 and 5 were used to identify perfect di-, tri-, tetra-, penta-and hexa-nucleotide SSRs, respectively. Primer 5.0 software (Lalitha, 2000) and DNAMAN 6.0 (Woffelman, 1994) were used to design primers. The important parameters for primers designing were set as follows: primer length ranging from 18 bases to 28 bases with 20 as the optimum, PCR product size ranging from 100 to 300 bp, optimum annealing temperature 60°C, and GC content from 40% to 60% with 50% as optimum.
2.5 SSR marker validation and polymorphism analysisThirty individuals were collected as a test population from the aquaculture farm of Jimei University in Ningde, Fujian, China. Thirty primer sets were randomly selected for polymorphism validation. PCR amplifications were performed in 10-μL reactions, containing 1.0 μL genomic DNA, 1.0 μL 10× PCR buffer, 0.2 μmol/L dNTPs, 0.2 μmol/L of each primer, 0.1 μL 5 U Taq enzymes and 7.3 μL ddH2O. The PCR reaction procedure was 94 °C for 5 min, 30 cycles at 94°C for 0.5 min, annealing temperature (from 55°C to 62°C) for 0.5 min, 72°C for 0.5 min and a final extension step at 72°C for 10 min. PCR products were separated by 6% denatured polyacrylamide and allele size was estimated using a 10-bp DNA Ladder (Invitrogen, USA) as a reference standard for electrophoresis bands. All selected primers were preliminarily tested by genomic DNA of 30 individuals. The number of alleles (NA), polymorphic information content (PIC) of each locus, observed (HO) and expected (HE) heterozygosity were evaluated by CERVUS version 3.03 (Kalinowski et al., 2007). POPGENE version 1.32 (Yeh et al., 1997) was applied for testing Hardy-Weinberg equilibrium (HWE) and linkage disequilibrium among all loci.
3 RESULT 3.1 454 pyrosequencing data and transcript assemblyTotal RNA from liver samples of L. crocea were extracted and prepared for cDNA library construction as described in the Experimental Section. The reads generated by the Roche 454 GS20 were used for sequence clustering and de novo transcriptome assembly. After eliminating vector and contamination sequences, 152 070 clean transcript reads were obtained with an average length of 320 bp, resulting in a total size of 48.7 Mb. The transcript sequences were clustered and assembled into contigs by Newbler application, which was the most prevalent transcriptome assembler for 454 pyrosequencing in previous studies (Zerbino and Birney, 2008). As a result, 4 993 contigs were obtained along with 88 808 singletons. The average length of contigs and total transcript was about 541 bp and 332 bp, respectively. A large number (76.4%) of assembled transcripts fell into a length range between 201 and 800 bp.
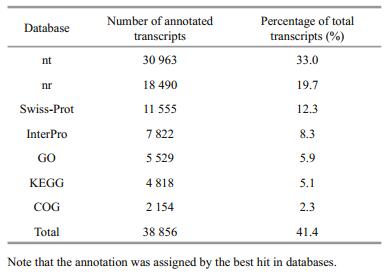
3.2 Transcripts functional annotationTo functionally annotate the transcriptome, we searched against the NCBI non-redundant nucleotide (nt) and protein (nr) databases for homologous sequences with BLAST applications. As listed in Table 1, 30 963 (33.0%) and 18 490 (19.7%) sequences had significant matches in the nt and nr databases. In addition, Swiss-Prot, InterPro, Clusters of Orthologous Groups of proteins (COG), Gene Ontology (GO) and Kyoto Encyclopedia of Genes and Genomes (KEGG) databases were used to further identify protein families, function categories and pathways of L. crocea transcripts: 11 555 (12.3%) and 7 822 (8.3%) sequences had significant hits in Swiss-Prot and InterPro, respectively; while 2 154 (2.3%) had significant matches in the COG. As a collection of controlled vocabularies representing the biology of a gene product in organisms, the GO database was split into three major categories: cellular component (CC), molecular function (MF) and biological process (BP). With the blast2GO package, 5 529 (5.9%) transcripts were assigned to at least one GO category. As detailed annotations shown in Fig. 1a, 2 450 (2.6%), 4 874 (5.2%) and 3 687 (3.9%) transcripts were successfully annotated by the level of CC, MF and BP, respectively. The most representative GO term for CC, MF and BP was cell (GO:0005623), binding (GO:0005488) and cellular process (GO:0009987). In addition, 4 818 (5.1%) transcripts were assigned to KO terms and grouped into 225 pathways. Among the top abundant 20 pathways shown in Fig. 1b, many essential pathways, including tight junction (ko04530), regulation of actin cytoskeleton (ko04810), and focal adhesion (ko04510) were highlighted by more than 100 transcript annotations.

|
| Figure 1 Gene Ontology (GO) and KEGG functional classification of L. crocea transcriptome a. transcripts are annotated by GO terms by three main categories: cellular component, molecular function, or biological progress; b. only the top 20 most abundant pathways and the annotated transcripts are listed. |
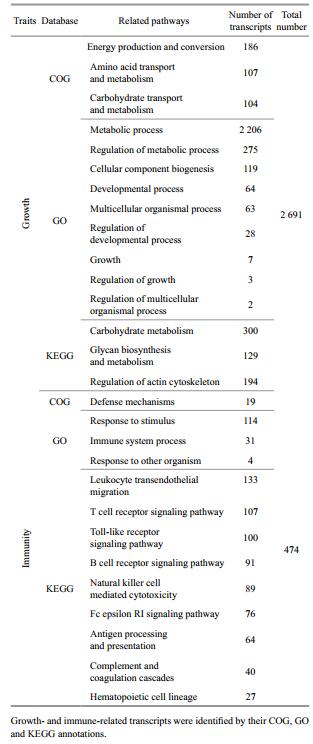
After functional annotation, a total of 38 856 transcripts were successfully annotated in the nt, nr, Swiss-Prot, InterPro, COG, GO and KEGG databases. According to previous studies of aquaculture organisms, growth rate and immune response are two of the most important economic traits because they are directly related to aquaculture production and disease resistance to infectious pathogens (Goliomytis et al., 2014). Therefore, we attempted to identify possible functional genes controlling these important biological processes in L. crocea. As a result, 2 691 and 474 transcripts annotated by COG assignment, GO terms, and KEGG pathway were identified involved in growth and immunity, respectively (Table 2). The detailed gene information and annotation with nt and nr by BLAST are summarized in Supplementary Tables 1 and 2. The gene function identification related to important economic traits of L. crocea provided valuable candidates for future gene functional analysis and association studies for important economic traits of L. crocea.
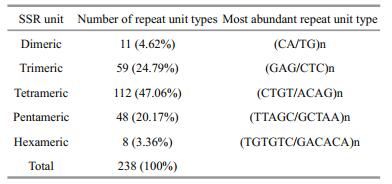
To detect potential SSR markers in the transcriptome of L. crocea, a total of 6 391 SSRs were identified in the transcriptome. Mono-nucleotide and di-nucleotide SSRs with a repeat number smaller than six were excluded from the analysis. Among all SSR markers, di-nucleotide repeat unit exhibited the highest frequency (73.35%), followed by tri-(21.37%) and tetra-nucleotide units (4.21%). Penta-and hexanucleotides had significant lower frequencies (0.94% and 0.15%, respectively) (Fig. 2). The statistics of unit length distribution were comparable with a previous analysis (Xiao et al., 2015). A total of 238 types of repeat units were identified among all SSRs (Table 3). (CA/TG)n was the most abundant SSR unit in the dinucleotide, as well as in all unit length groups, while in tri-, tetra-, penta-and hexa-nucleotides, (GAG/CTC)n, (CTGT/ACAG)n, (TTAGC/GCTAA)n and (TGTGTC/GACACA)n were the most frequent units, respectively. Notably, we did not observe (GC/CG)n di-nucleotides in our data, which was similar with a previous report for other organisms (Kale et al., 2012).

|
| Figure 2 The distribution of di-, tri-, tetra-, penta-, and hexa-nucleotide repeat units for SSRs in L. crocea transcriptome |
SSR unit length and repeat number distribution of L. crocea are depicted in Fig. 3. Most SSR markers had a repeat number between 5 and 10. Di-nucleotide SSRs were predominant in almost all SSRs with various repeat numbers. We found that the SSR unit length distribution was not remarkably changed in different repeat number groups: di-nucleotide dominated and was followed by tri-and tetra-/penta-/ hexa-nucleotide units, which was also consistent with previous reports (Kale et al., 2012). The SSR with the high repeat number (≥10) in our study may represent potential for repeat number polymorphism in the genome of L. crocea.

|
| Figure 3 Repeat number distribution of SSRs The number of SSR loci (Y-axis) was plotted against repeat number (X-axis). Different unit lengths (color key) were stacked in each vertical bar. |
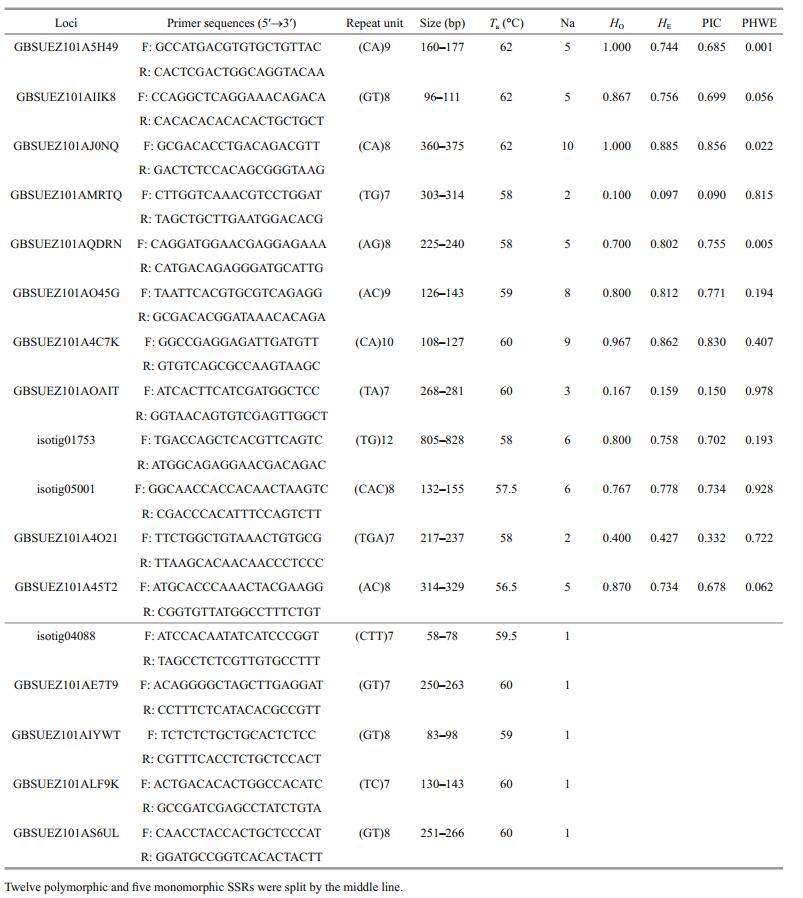
After sequence analysis, we found that 4 498 repeats had sufficient two-end flanking regions for designing PCR primers. To validate polymorphism and stability of SSR loci in populations, 30 SSR markers with a flanking region were randomly selected and verified in L. crocea individuals. A preliminary test of 30 loci in 10 individuals showed that 17 (Table 4) loci were successfully amplified, among which five were monomorphic and 12 were polymorphic. The primers without amplification product may be designed in exon-intron junction regions in the genome. The 12 polymorphic loci were further verified by an expanded population of 30 L. crocea individuals. Figure 4 shows one example of allele detection for marker GBSUEZ101AQDRN in our study. As shown in Table 4, the number of alleles ranged from 2 to 10 with an average of 5.5 alleles per locus. The observed (HO) and expected (HE) heterozygosities ranged from 0.100 to 1.000 with an average value of 0.703 and from 0.097 to 0.885 with an average value 0.651, respectively. The estimated polymorphic information content (PIC) value ranged from 0.090 to 0.856 with an average value 0.607. After Hardy-Weinberg Equilibrium (HWE) heterozygote deficiency evaluation (P < 0.05), we found that most loci followed HWE with three exceptions (GBSUEZ101A5H49, GBSUEZ101AJ0NQ, GBSUEZ101AQDRN), implying the majority of SSR loci were stable markers with excellent heterozygosities in the population.

|
| Figure 4 Polymorphism of the SSR loci GBSUEZ101AQDRN in 30 L. crocea samples The experiment was performed with 6% PAGE for 30 individuals. The left-most markers (M) represented the DNA ladder. |
Recent scientific progress and demands in aquaculture have led researchers of related organisms into the genomic era, giving gene sequences and functional molecular markers an even more important role in important trait associations, QTL identification, and marker-assisted selection. With the wide application of NGS techniques in more fields, RNAseq provides a powerful tool for researchers to investigate gene functions in living cells (Wang et al., 2009). The transcripts assembled from the sequencing reads are valuable sequence resources, enabling scientists to develop functional molecular markers in transcriptomes instead of traditional genomic DNA fragments. The 454 pyrosequencing platform is characterized by its remarkable transcript read length compared with other NGS platforms (Mardis, 2008). Therefore, transcriptome based on Roche 454 is rather suitable for SSR development by avoiding possible transcript mis-assembly from shorter sequencing reads.
From the annotations of gene production, 2 691 and 474 transcripts assigned by COG, GO and KEGG pathway databases were identified to be involved in growth and immunity, respectively. Although we identified several thousand growth-related genes, these transcripts may not represent all genes contributing to the growth rate of L. crocea because of the complicated development processes in animals (Tsai et al., 2015). We noted that the number of immune genes reported in the work was comparable with previous reports in the miiuy croaker (Che et al., 2014), a closely related species. Several reported genes were rediscovered in our transcriptome analysis, such as MyD88 (Yao et al., 2009), Cathepsin B (Li et al., 2014) and fibrinogen beta chain (Xie et al., 2009), while most of the immune-related genes, including MLLT4, BLNK and TAPBP, were identified from L. crocea for the first time. These gene sequences and annotations are valuable genetic resources for subsequent gene function analysis.
SSRs, repeated motifs with a unit sequence of 2-6 base pairs, are a repeat length polymorphism present in DNA sequences. Because of its high abundance, polymorphism, and co-dominance in the genome (Appleby et al., 2009), SSRs have been used as stable loci for genetic linkage construction, QTL identification, and population genetic structure analysis. Previous SSR markers of L. crocea were developed based on genomic and limited EST libraries (Guo et al., 2005; Ye et al., 2010) and only a small number of SSR markers for L. crocea were available prior to our study. In this work, a total of 6 391 SSRs were identified from the assembled transcripts. Of them, 4 498 repeats had flanking sequences feasible for designing PCR primers. Based on next generation sequencing (NGS) transcriptome sequencing, we identified almost 4-times the number of SSR loci compared with a previous report for the species from genomic fragments (Lü et al., 2013). More importantly, these markers possessed great functional potential for their direct linkage with expressed genes.
As a result of a basic polymorphism statistics for developed SSR markers, we found that the mean number of alleles per locus, HO, and HE were 5.5, 0.703, and 0.651, respectively. The average PIC value of SSRs in this study was 0.607. We found that the PIC value in this work was slightly lower than those of other studies (Guo et al., 2005; Ye et al., 2010; Lü et al., 2013), and a possible reason could be attributed to three loci with low heterozygosity (GBSUEZ101AMRTQ, GBSUEZ101AOAIT and GBSUEZ101A4O21), which was similar to the case in Ruditapes philippinarum transcriptome (Yan et al., 2015). According to the classification standard proposed by Botstein (Botstein et al., 1980), nine among 12 loci polymorphic were highly informative (PIC >0.5), one was reasonably informative (0.25 < PIC < 0.5) and two were slightly informative (PIC < 0.25). As shown in Table 4, three SSR loci showed significant deviation from Hardy-Weinberg equilibrium (P < 0.05) owing to heterozygote excess (GBSUEZ101A5H49 and GBSUEZ101AJ0NQ) and heterozygote deficiency (GBSUEZ101AQDRN). According to a prior study, the three aberrant SSR loci might result from gametes having a segregation distortion locus (SDL), or SDL genotypes with differential viability before fertilization (Li et al., 2008). The isolation and validation of 12 SSR markers from transcriptomic sequences exhibited high polymorphism in this work. Highly polymorphic functional SSR markers will be valuable resources for genetic resource management, economic trait genetic investigations, and marker-assisted selection for L. crocea in future studies.
5 CONCLUSIONIn this work, we applied RNA-seq by 454 pyrosequencing to probe the liver transcriptome of L. crocea. The assembled and annotated transcriptome provided valuable sequence resources for gene functional analysis of this species. Based on the annotation information, growth-and immune-related genes were identified for future gene function and genetic studies. Meanwhile, massive SSR markers were detected from L. crocea transcriptome and validated in 30 individuals. The results demonstrated that the developed SSR loci were stable markers exhibiting excellent polymorphism in populations. This is the first 454 pyrosequencing based transcriptome report for this species. The transcript sequences information and SSR markers will be utilized further in economic trait mapping and associated studies of L. crocea.
6 AUTHOR CONTRIBUTIONSX and ZW conceived and designed the study; SX, XL, YX and ZW analyzed the results; YL collected samples; ZH and SX performed bioinformatics analysis; ZH and JL carried out SSRs validation experiments; ZH and SX wrote the manuscript.
| Altschul S F, Madden T L, Schäaffer A A, Zhang J H, Zhang Z, Miller W, Lipman D J, 1997. Gapped BLAST and PSIBLAST:a new generation of protein database search programs. Nucleic Acids Research, 25(17): 3 389–3 402. Doi: 10.1093/nar/25.17.3389 |
| Appleby N, Edwards D, Batley J. 2009. New technologies for ultra-high throughput genotyping in plants. In:Gustafson J P, Langridge P, Somers D J eds. Plant Genomics.Humana Press, Totowa, NJ. 513:19-39. |
| Botstein D, White R L, Skolnick M, Davis R W, 1980. Construction of a genetic linkage map in man using restriction fragment length polymorphisms. The American Journal of Human Genetics, 32(3): 314–331. |
| Che R B, Sun Y Y, Sun D Q, Xu T J, 2014. Characterization of the miiuy croaker (Miichthys miiuy) transcriptome and development of immune-relevant genes and molecular markers. PLoS One, 9(4): e94046. Doi: 10.1371/journal.pone.0094046 |
| Conesa A, Götz S, García-Gómez J M, Terol J, Talón M, Robles M, 2005. Blast2GO:a universal tool for annotation, visualization and analysis in functional genomics research. Bioinformatics, 21(18): 3 674–3 676. Doi: 10.1093/bioinformatics/bti610 |
| Goliomytis M, Tsoureki D, Simitzis P E, Charismiadou M A, Hager-Theodorides A L, Deligeorgis S G, 2014. The effects of quercetin dietary supplementation on broiler growth performance, meat quality, and oxidative stability. Poultry Science, 93(8): 1 957–1 962. Doi: 10.3382/ps.2013-03585 |
| Guo W, Wang Z Y, Wang Y L, Zhang Z P, Gui J F, 2005. Isolation and characterization of six microsatellite markers in the large yellow croaker (Pseudosciaena crocea Richardson). Molecular Ecology Notes, 5(2): 369–371. Doi: 10.1111/men.2005.5.issue-2 |
| Hong W S, Zhang Q Y, 2003. Review of captive bred species and fry production of marine fish in China. Aquaculture, 227(1-4): 305–318. Doi: 10.1016/S0044-8486(03)00511-8 |
| Kale S M, Pardeshi V C, Kadoo N Y, Ghorpade P B, Jana M M, Gupta V S, 2012. Development of genomic simple sequence repeat markers for linseed using next-generation sequencing technology. Molecular Breeding, 30(1): 597–606. Doi: 10.1007/s11032-011-9648-9 |
| Kalinowski S T, Taper M L, Marshall T C, 2007. Revising how the computer program CERVUS accommodates genotyping error increases success in paternity assignment. Molecular Ecology, 16(5): 1 099–1 106. Doi: 10.1111/j.1365-294X.2007.03089.x |
| Kang J H, Park J Y, Jo H S, 2012. Rapid development of microsatellite markers with 454 pyrosequencing in a vulnerable fish, the mottled skate. Raja pulchraInternational Journal of Molecular Sciences, 13(12): 7 199–7 211. Doi: 10.3390/ijms13067199 |
| Lalitha S, 2000. Primer premier 5. Biotech Software & Internet Report, 1(6): 270–272. |
| Lapunzina P, López R O, Rodríguez-Laguna L, García-Miguel P, Martínez A R, Martínez-Glez V M, 2014. Impact of NGS in the medical sciences:genetic syndromes with an increased risk of developing cancer as an example of the use of new technologies. Genetics and Molecular Biology, 37(1): 241–249. Doi: 10.1590/S1415-47572014000200010 |
| Li M Y, Li Q H, Yang Z J, Hu G H, Li T, Chen X H, Ao J Q, 2014. Identification of cathepsin B from large yellow croaker (Pseudosciaena crocea) and its role in the processing of MHC class Ⅱ-associated invariant chain. Developmental & Comparative Immunology, 45(2): 313–320. |
| Li Y Y, Cai M Y, Wang Z Y, Guo W, Liu X D, Wang X Q, Ning Y, 2008. Microsatellite-centromere mapping in large yellow croaker (Pseudosciaena crocea) using gynogenetic diploid families. Marine Biotechnology, 10(1): 83–90. Doi: 10.1007/s10126-007-9040-2 |
| Liao X L, Cheng L, Xu P, Lu G Q, Wachholtz M, Sun X W, Chen S L, 2013. Transcriptome analysis of crucian carp (Carassius auratus), an important aquaculture and hypoxia-tolerant species. PLoS One, 8(4): e62308. Doi: 10.1371/journal.pone.0062308 |
| Lü Z M, Li H M, Liu L Q, Cui W T, Hu X Y, Wang C F, 2013. Rapid development of microsatellite markers from the large yellow croaker (Pseudosciaena crocea) using next generation DNA sequencing technology. Biochemical Systematics and Ecology, 51: 314–319. Doi: 10.1016/j.bse.2013.09.019 |
| Luo W, Nie Z L, Zhan F B, Wei J, Wang W M, Gao Z X, 2012. Rapid development of microsatellite markers for the endangered fish Schizothorax biddulphi (Günther) using next generation sequencing and cross-species amplification. International Journal of Molecular Sciences, 13(12): 14 946–14 955. Doi: 10.3390/ijms131114946 |
| Mardis E R, 2008. Next-generation DNA sequencing methods. Annual Review of Genomics and Human Genetics, 9(1): 387–402. Doi: 10.1146/annurev.genom.9.081307.164359 |
| Moriya Y, Itoh M, Okuda S, Yoshizawa A C, Kanehisa M, 2007. KAAS:an automatic genome annotation and pathway reconstruction server. Nucleic Acids Research, 35(S2): W182–W185. |
| Mu Y N, Ding F, Cui P, Ao J Q, Hu S N, Chen X H, 2010. Transcriptome and expression profiling analysis revealed changes of multiple signaling pathways involved in immunity in the large yellow croaker during Aeromonas hydrophila infection. BMC Genomics, 11(1): 506. Doi: 10.1186/1471-2164-11-506 |
| Thiel T, Michalek W, Varshney R, Graner A, 2003. Exploiting EST databases for the development and characterization of gene-derived SSR-markers in barley (Hordeum vulgare L).. Theoretical and Applied Genetics, 106(3): 411–422. Doi: 10.1007/s00122-002-1031-0 |
| Tsai H Y, Hamilton A, Guy D R, Tinch A E, Bishop S C, Houston R D, 2015. The genetic architecture of growth and fillet traits in farmed Atlantic salmon (Salmo salar). BMC Genetics, 16(1): 51. Doi: 10.1186/s12863-015-0215-y |
| Wang J J, Yu X M, Zhao K, Zhang Y G, Tong J G, Peng Z G, 2012. Microsatellite development for an endangered bream Megalobrama pellegrini (Teleostei, Cyprinidae) using 454 sequencing. International Journal of Molecular Sciences, 13(12): 3 009–3 021. Doi: 10.3390/ijms13033009 |
| Wang J, Ai Q H, Mai K S, Xu H G, Zuo R T, 2014. Dietary chromium polynicotinate enhanced growth performance, feed utilization, and resistance to Cryptocaryon irritans in juvenile large yellow croaker (Larmichthys crocea). Aquaculture, 432: 321–326. Doi: 10.1016/j.aquaculture.2014.05.027 |
| Wang Z, Gerstein M, Snyder M, 2009. RNA-Seq:a revolutionary tool for transcriptomics. Nature Reviews Genetics, 10(1): 57–63. Doi: 10.1038/nrg2484 |
| Woffelman C, 1994. DNAMAN for Windows. Leiden University, The Netherland. |
| Xiao S J, Han Z F, Wang P P, Han F, Liu Y, Li J T, Wang Z Y, 2015. Functional marker detection and analysis on a comprehensive transcriptome of large yellow croaker by next generation sequencing. PLoS One, 10(4): e0124432. Doi: 10.1371/journal.pone.0124432 |
| Xie F J, Zhang Z P, Lin P, Wang S H, Zou Z H, Wang Y L, 2009. Identification of immune responsible fibrinogen beta chain in the liver of large yellow croaker using a modified annealing control primer system. Fish & Shellfish Immunology, 27(2): 202–209. |
| Yan L L, Qin Y J, Yan X W, Wang L N, Bi C L, Zhang J Y, 2015. Development of microsatellite markers in Ruditapes philippinarum using next-generation sequencing. Acta Ecologica Sinica, 35(5): 1 573–1 580. |
| Yao C L, Kong P, Wang Z Y, Ji P F, Liu X D, Cai M Y, Han X Z, 2009. Molecular cloning and expression of MyD88 in large yellow croaker, Pseudosciaena crocea. Fish & Shellfish Immunology, 26(2): 249–255. |
| Ye H, Wang X Q, Gao T X, Wang Z Y, 2010. EST-derived microsatellites in Pseudosciaena crocea and their applicability to related species. Acta Oceanologica Sinica, 29(6): 83–91. Doi: 10.1007/s13131-010-0079-y |
| Ye J, Fang L, Zheng H K, Zhang Y, Chen J, Zhang Z J, Wang J, Li S T, Li R Q, Bolund L, Wang J, 2006. WEGO:a web tool for plotting GO annotations. Nucleic Acids Research, 34(S2): W293–W297. |
| Yeh F C, Yang R C, Boyle T B J, Ye Z H, Mao J X. 1997.POPGENE, the User-Friendly Shareware for Population Genetic Analysis. Molecular and Biotechnology Center, University of Alberta, Edmonton, Alberta, Canada. |
| Zdobnov E M, Apweiler R, 2001. InterProScan-an integration platform for the signature-recognition methods in InterPro. Bioinformatics, 17(9): 847–848. Doi: 10.1093/bioinformatics/17.9.847 |
| Zerbino D R, Birney E, 2008. Velvet:algorithms for de novo short read assembly using de Bruijn graphs. Genome Research, 18(5): 821–829. Doi: 10.1101/gr.074492.107 |
| Zhang J, Ma W G, Song X M, Lin Q H, Gui J F, Mei J, 2014. Characterization and development of EST-SSR markers derived from transcriptome of yellow catfish. Molecules, 19(10): 16 402–16 415. Doi: 10.3390/molecules191016402 |
| Zhou P, Zhang Z P, Wang Y L, Zou Z H, Xie F J, 2010. EST analysis and identification of gonad-related genes from the normalized cDNA library of large yellow croaker. Larimichthys crocea Comparative Biochemistry and Physiology Part D:Genomics and Proteomics, 5(2): 89–97. Doi: 10.1016/j.cbd.2010.01.002 |