 2017, Vol. 35
Institute of Oceanology, Chinese Academy of Sciences
Article Information
- ZHOU Shanshan(周珊珊), ZHANG Xiumei(张秀梅), LI Wentao(李文涛), LI Long(李龙), CAI Xingyuan(蔡星媛)
- Experimental evaluation of fluorescent (alizarin red S and calcein) and clip-tag markers for stock assessment of ark shell, Anadara broughtonii
- Chinese Journal of Oceanology and Limnology, 35(2): 265-274
- http://dx.doi.org/10.1007/s00343-016-5137-7
Article History
- Received Apr. 24, 2015
- accepted in principle Jun. 24, 2015
- accepted for publication Jan. 14, 2016


Ark shell, Anadara broughtonii, is distributed in shallow sandy mud or muddy sediments in 5-50-m-deep subtidal zones of coastal Asia, including China, Japan, the Philippines, Korea, and the southeastern part of Russia (Evseev and Lutaenko, 1998; Matsukuma and Okutani, 2000). Ark shells, which are characterized by their large size, delicious taste, and medicinal value, are an economically important shellfish in Japan and China (Tang et al., 1994; Nishida et al., 2012).
Ark shell stocks have decreased substantially over the years because of habitat degradation and overfishing (Silina, 2006). Since the 1960s, large numbers of ark shells have been bred artificially in Japan and released into their natural environment (Broom, 1985). Research on stock enhancement and release of ark shell began in the 1980s in China, and the number released has increased consistently with the development of artificial breeding and stockenhancement technologies (Wang et al., 1987). However, the effectiveness of these release programs for stock enhancement has rarely been investigated (Tang et al., 1994; Xiao et al., 1994).
Directly tracking larvae and indirectly studying population genetics are problematic in assessing the value of stock enhancement (Neigel, 2002; Palumbi, 2003), and have led to an incomplete understanding of the extent to which local populations are either self-recruiting or supplied with new recruits from stock enhancement programs. Thus, the development of suitable tagging methods is essential in directly assessing the effectiveness of stock enhancement and in indirectly obtaining data on population genetics (Morgan, 2001; Thorrold et al., 2002).
Marking shellfish is particularly inconvenient, as shellfish are long-lived species; thus, the collection of population data in assessing stock enhancement programs may last for many years. Therefore, the marks must be recognizable and retained over the long-term. Furthermore, marks on shellfish are subject to abrasion by the substrate and corrosion by seawater. An appropriate shellfish marking method should minimize the influence of the mark on survival, growth, and behavior. It should also be economical and applicable to large-scale marking programs. Moreover, marked shellfish may potentially be more vulnerable to predation (Lemarie et al., 2000); thus, suitable marks should be small and of a subdued color.
Fluorescent stains act by chelating calcium in the growing shell, thereby causing a permanent mark that fluoresces when the shell is viewed under ultraviolet light (Day et al., 1995). A variety of fluorescentstaining methods are effective in producing fluorescent or pigmented marks in calcified or bony structures with few negative side-effects on survival, such as oxytetracycline (Barker and McKaye, 2004), tetracycline hydrochloride (Oliveira, 1996), calcein (CAL) (Leips et al., 2001; Frenkel et al., 2002; van der Geest et al., 2011; Klunzinger et al., 2014), alizarin red S (ARS) (Eckmann, 2003; Bashey, 2004), and alizarin complexone (Skov et al., 2001; van der Walt and Faragher, 2003). Many studies have evaluated the retention times of fluorescent marks in fish (Eckmann, 2003; Bashey, 2004; Baer and Rösch, 2008), but few similar studies have investigated shellfish such as the ark shell, A. broughtonii.
Several marking methods (fluorescent dyes and clip tags) were examined in this study to determine their suitability for mass tagging of ark shells in stock enhancement. The feasibility of using ARS and CAL fluorescent staining and stainless steel clip-marking methods in the long-term were investigated, in addition to the effects of the marking methods on survival and growth.
2 MATERIAL AND METHOD 2.1 Sample preparationA total of 1 900 juvenile ark shells (shell length: 27.24±1.12 mm) were collected from a commercial hatchery in Lingshan Bay (Qingdao, China) on 30 July 2012. The shells were allocated randomly to six groups: two CAL groups (200 and 300 mg/L CAL), two ARS groups (200 and 300 mg/L ARS), a clip group, and a control group. All experiments were carried out in triplicate, except for the clip group, which was performed in quadruplicate. Each replicate included 100 randomly selected individuals.
ARS and CAL (Sinopharm Chemical Reagent Co., Shanghai, China) were dissolved in filtered seawater at a concentration of 1 000 mg/L using a magnetic stirrer at 27°C as a stock solution. Solubility and pH were adjusted by adding NaHCO3. A preliminary experiment was conducted to determine suitable concentrations and immersion times, and 200 and 300 mg/L CAL and ARS were selected based on their bright, visible marks, and the finding that the fluorochrome combined fully with calcium in the shell after immersion for 24 h. The stock solution was added to filtered seawater at particular ratios to prepare the different CAL (200 and 300 mg/L) and ARS (200 and 300 mg/L) solutions. The ark shells were immersed in an aerated solution for 24 h at a density of 5 ind./L under conditions of 31±0.3 salinity, temperature of 20±1°C, pH 8.2±0.2, and dissolved oxygen≥5.5 mg/L, and maintained without feeding. The tanks used for fluorescent staining were shaded to reduce stress from the fluorochromes during immersion. The shells were washed with fresh seawater after immersion and transferred to corresponding holding tanks containing fresh seawater.
All juvenile ark shells of clip group were anesthetized with 2 mL MS-222 to keep their shells open. Following anesthetization, 6 mm×3 mm stainless steel clips, weighing 0.056 g, were inserted into the fringes of the shell, and the tagged ark shells were transferred to corresponding holding tanks until they recovered.
2.2 Culture and monitoringFollowing staining and clip tagging, the animals in each group were held in separate tanks containing fresh seawater for 4 h. The seawater was exchanged to remove the fluorochromes and anesthetic completely. Survival rates were recorded in the separate tanks during the first 24 h after marking.
The culture cages were divided into 10 layers using circular plates (0.13 m high for each layer), and 100 individuals were released into each layer at a density of 0.08 ind./L. Replicates for the different treatment groups were located in the same layers of corresponding cages, and the six group cages were suspended in parallel on a culture raft in Lingshan Bay on 31 July 2012 (Fig. 1). Unmarked juvenile ark shells were used as a control. Fluorescent mark retention was photographed 15, 30, 60, 90, 120, 160, 220, 270, and 365 days after marking. Survival rates, shell length, and wet weight of 40 individuals sampled randomly from each group, and tag retention in the clip group (with 400 individuals), were recorded 15, 30, 60, 90, 120, and 160 days after marking. Shell length was measured to the nearest 0.01 mm, and wet weight was determined to the nearest 0.01 g (National Standardization Management Council, 2008). All sampled shells were returned to their respective cages after measuring.

|
| Figure 1 Cages suspended from a culture raft in Lingshan Bay, Qingdao, China R is the radius of the circular plates separating the cages. |
Twenty shells were sampled randomly from each replicate of the fluorescent-marked groups 1 year after marking and rinsed with freshwater to detect the marks. To prevent the fluorescent marks from fading, all samples were stored in a dark environment and observed within 1 month (Bashey, 2004).
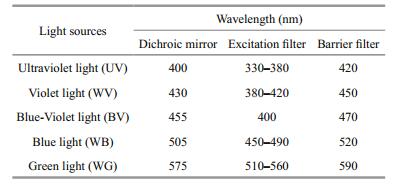
Fluorescent marks produced by CAL and ARS were examined with a Nikon Eclipse 80i fluorescence microscope fitted with a Nikon DXM-1200F highresolution digital camera equipped with a fluorescence attachment (Nikon Corp., Tokyo, Japan) (Table 1). The inside and outside of the ark shell was examined for fluorescent marks and evaluated for marking quality on a scale of 0-5 under a fluorescence microscope (Liu, 2009; Lu et al., 2014) (0: no visible mark; 1: faintly visible mark; 2: easily visible mark; 3: brightly luminous mark; 4: mark visible in transmitted light; 5: mark clear in transmitted light). Quality scores≥2 were considered acceptable, as they were easily distinguishable in a sample (Taylor et al., 2005). At least five shells were selected randomly from each fluorescent-marked group and assessed by two observers to reduce errors. If there was disagreement between the two observers, the quality of the mark was decided by a third observer. All samples were observed directly without resin or polishing (Frenkel et al., 2002). The clip tags, which were enfolded into the shell, were observed under a stereoscopic zoom microscope (M16SC; Leica) fitted with a Leica DFC295 high-resolution digital camera (Leica Microsystems, Buffalo Heights, IL, USA).
|
The following parameters were analyzed:
Rt(%)=It/It-1×100%,
where Rt is retention rate at month t, It is the number of individuals with a clip tag at month t (dead and alive), and It-1 is the number of individuals with a clip tag at month t-1 (dead and alive).
CRt(%)=Ct/I0×100%,
where CRt is the cumulative retention rate at month t, Ct is the number of individuals with a clip tag at month t (dead and alive), and I0 is the number of individuals with a clip tag at month 0 (i.e., 100).
St(%)=Nt/Nt-1×100%,
where St is survival rate at month t, Nt is the number of survivors at month t, and Nt-1 is the number of survivors at month t-1.
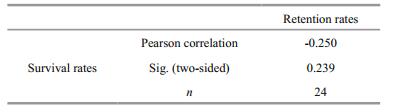
One-way analysis of variance was used to detect differences in various parameters between the treatment and control groups. Fluorochromes have a negative effect on shellfish; therefore, it was assumed that the survival rate in each treatment group would be equal to or less (mean≤control) than that in the control group (Lucas et al., 2008). Wet weight and shell length in each treatment group were assumed to be equal or less (mean≤control) than those in the control group. These differences among means were assessed and compared using a one-tailed Dunnett test. The correlations between retention and survival rates in the clip group were investigated via Pearson’s correlation analysis. The total correlation coefficient for all 6 months of data was calculated between the retention and survival rates (four replicates) with all data, 15, 30, 60, 90, 120, and 160 days after marking. Statistical analyses were performed using SPSS 17.0 software (SPSS Inc., Chicago, IL, USA), and quantitative data are expressed as mean±standard deviation. A P < 0.05 was considered significant.
3 RESULT 3.1 Survival and growth of juvenile ark shellThe survival rates on day 0 were 99.67% in the control, 100% and 99.67% in the ARS groups (200 and 300 mg/L, respectively), and 99.67% and 99.50% in the CAL groups (200 and 300 mg/L, respectively) (df=5; P>0.05). A significant difference in the 30-day survival rate was observed between the clip and control groups (df=5; P < 0.05), but no differences in survival rates were found after marking between the fluorescentmarked and control groups (df=5; P>0.05) (Fig. 2). Cumulative survival rates 160 days after marking were 53.67%, 47%, 43.33%, 44.67%, 40.25%, and 40.67% in the 200 mg/L ARS, 300 mg/L ARS, 200 mg/L CAL, 300 mg/L CAL, clip, and control groups, respectively.

|
| Figure 2 Temporal variations in survival rates of juvenile ark shells in the treatment and control groups Star indicates a significant difference (P<0.05). |
No differences were found in wet weight or shell length 0, 15, 30, 60, 90, 120, or 160 days after fluorescent staining between the fluorescent and control groups (df=5; P>0.05) (Figs. 3 and 4). However, significant differences in shell length were observed between the clip and control group after 60, 90, 120, and 160 days (df=5; P < 0.05), and in wet weight after 90, 120, and 160 days (df=5; P < 0.05).

|
| Figure 3 Temporal variations in wet weight of juvenile ark shell in the treatment and control groups Stars indicate significant differences (P<0.05). |

|
| Figure 4 Temporal variations in length of juvenile ark shell in the treatment and control groups Stars indicate significant differences (P<0.05). |
The lowest retention rate was found 15 days after clip tagging, but retention rates tended to be stable over time (Fig. 5). The cumulative retention rate of the clip-tagged group was 64.25% after 160 days (Fig. 6). Some ark shells died during the early period after clip tagging, but no relationship was detected between retention and survival rates (P>0.05) (Table 2), probably because the clip tags were surrounded by a nacreous layer secreted by the ark shell and, thus, became part of the shell (Fig. 7).

|
| Figure 5 Retention rates of clips by shells at different time points |

|
| Figure 6 Cumulative retention rates of clips by ark shells at different time points |

|
| Figure 7 Clip tag outside the shell (a, c), the clip tag surrounded by a nacreous layer in the shell and forming a concavity (b, d) 90 days after marking |
The yellow and red CAL and ARS marks were clearly visible on day 0. A ring was detectable in the center of the shell 120 days after marking some of the ark shells, and was still detectable on most shells after 1 year, although the colors were invisible in a few ark shells because of marine fouling in the culture cages (Fig. 8). Marks in the umbo and ring were clearer than those observed in other areas of the shell.

|
| Figure 8 Retention of fluorescent marks on the shell surface of juvenile ark shells on days 0 and 365 after marking Left to right: 200 mg/L alizarin red S (ARS), 300 mg/L ARS, 200 mg/L calcein (CAL), 300 mg/L CAL, control, and clip group. Top to bottom: 0 and 365 days. Arrows indicate marked rings. |
A bright red fluorescent area was observable under green light (WG) in the ark shells stained with ARS and CAL, and bright green and yellow fluorescent areas were evident under blue light (WB) in samples stained with CAL. However, no fluorescence was detectable on ark shells in the control group under WB or WG wavelengths (Fig. 9a). No differences were observed between the marks on shells treated with different concentrations of CAL and ARS, except for illumination intensity. Therefore, only photographs of the right valve of ark shells stained with 300 mg/L ARS and 300 mg/L CAL under optimum light are shown in Fig. 9b. ARS and CAL produced clearly visible fluorescent marks in all ark shells. However, marking rings were detectable and fluorescence had decayed in some area after 365 days.

|
| Figure 9 a. photomicrographs of fluorescent markings on the radial ribs of 1-year-stained ark shells under different light conditions; b. photographs of the right valve of ark shells immersed in ARS and CAL 0 and 365 days after marking In a: top to bottom: radial ribs on shells in the control group, 200 mg/L alizarin red S (ARS), 300 mg/L ARS, 200 mg/L calcein (CAL), and 300 mg/L CAL group. Left to right in columns: green light, blue light, blue-violet light, violet light, ultraviolet light, and transmitted light. In b: left to right in line: 300 mg/L ARS on days 0 and 365 after marking under green light, and 300 mg/L CAL on days 0 and 365 after marking under blue light. Black areas are fluff that was easily abraded from the juvenile ark shells after marking on day 0. Fluorescent markings were abraded on the umbo, and the fluff had integrated 365 days after marking. t0 to t1 represents the distance from the umbo to the shell edge after marking on day 0, and t1 to t2 represents shell growth 365 days after marking. Dashed line indicates the distance to the shell edge that cannot be observed in the panel owing to the size of the photo. Arrows indicate marking rings, as shown in Fig. 8. |
Clearly visible marks (score≥2) were evident under fluorescent microscopy on all CAL-and ARS-treated shells after 365 days (Fig. 10). Visible marks (score≥4) were observable with the naked eye in the ARS-and CAL-stained shells, which had brighter fluorescent marks, particularly the red marks. Marks in the ARS groups were clearer than were those in the CAL groups. Brightness of the marks was positively correlated with CAL and ARS concentration, and the marks most visible (score≥4) to the naked eye were treated with 300 mg/L ARS.

|
| Figure 10 Variations in mark quality on ark shells subjected to calcein (CAL) and alizarin red S (ARS) treatments |
Significant differences in survival rate (30 days), shell length (60, 90, 120, and 160 days), and wet weight (90, 120, and 160 days) were detected between clip-tagged juvenile ark shells and those in the control group. This result is consistent with the following observations: (1) clip treatment may have damaged the juvenile ark shell, resulting in the significant difference in survival rate at marking time; (2) over time, clip tags became surrounded by a nacreous layer secreted by the ark shell and moved to the center, which stunted growth of the soft part of the shell; and (3) the secretion of the nacreous layer expended energy that could be used for growth. No differences in survival or growth were found in juvenile ark shells stained with ARS and CAL, which agrees with studies on Australian abalone (Haliotis rubra) (Day et al., 1995), bay scallop larvae (Argopecten irradians concentricus), mussel larvae (Mytilus trossulus) (Moran and Marko, 2005), scallop larvae (Amusium balloti) (Lucas et al., 2008), and brown mussel (Perna perna) (Kaehler and McQuaid, 1999) stained with CAL. High mortalities were reported in brown mussels stained with ARS (Kaehler and McQuaid, 1999), indicating that the safety of the dye should be tested prior to marking shellfish, as the effects of fluorescent stains can vary with species and size.
Low survival rates were observed in control juvenile ark shells 30-90 days after marking, which was probably due to high temperature, air exposure, and handling stress during the monthly sampling. Temperature strongly affects growth, survival, and behavior of organisms (Somero, 2002), and growth of ark shells slows at water temperatures of 23-28°C (Wang et al., 1996). The stress of short-term, high temperature exposure (24-26°C) during monthly sampling from August to October at the Jiaonan aquaculture area may have caused the mass mortality. Mortality was also attributed to rolling of the net cages during typhoon Dawei in September 2012. The reduced number of samples caused by the mass mortality of juvenile ark shells was the main reason that the monitoring survival rate, shell length, and wet weight was halted after 160 days.
4.2 Feasibility of using clip tags and fluorescent markingThe early, low retention rate of clip tags was speculated to be due to shell fragility, the imperfect match between the inner diameter of the tag and shell thickness, and rejection of a “foreign body” (i.e., tag) by the ark shell itself. Some shells broke because of the pressure of the clip tags; therefore, as large as possible individuals should be selected for marking. However, retention rates tended to stabilize during continuous growth of the ark shells after the initial period. Clip tags were surrounded by a nacreous substance secreted by the mantle that were incorporated into the shell, thereby preventing disengagement of the tag from the shell. The clip-tag retention rate was 64.25% in juvenile ark shell marked for 160 days, indicating that the clip-tagging method is more practical for marking large-sized individuals. As marked animals may be at increased risk for predation (Lemarie et al., 2000), the clip tags should be lightweight and miniaturized to reduce predation and injury.
Some ARS and CAL fluorescently marked ark shells (score≤4) were not accurately identifiable with the naked eye because of degraded fluorescence or marine fouling. However, all fluorescent marks were detectable under a fluorescence microscope (score≥3), indicating that ARS and CAL are both effective for marking juvenile ark shells prior to large-scale restocking. Owing to the sharp contrast of the red ARS stain with the white shell and no periostracum on the shell surface, the ARS marks were detectable with the naked eye on most shells after 1 year. This finding indicates that ARS could be a suitable technique for rapidly examining marked shells in assessing the value and success of stock enhancement programs after 1 year. However, the use of ARS has limitations, and many studies of different shellfish species have demonstrated that CAL may be superior to ARS. CAL marking is superior to ARS marking in abalone (Day et al., 1995) and larval saucer scallop (Amusium balloti) (Lucas et al., 2008), because ARS fluorescence is close to the natural fluorescence of these shells. The periostracum of shells may influence the effect of marking with different fluorochromes, and ARS may not be appropriate for shells with a dark-colored periostraca. CAL has been used successfully to mark shells with a darkly colored periostracum (brown to black), such as the Australian freshwater mussel (Westralunio carteri) and greenlipped mussel (Perna canaliculus) (Fitzpatrick et al., 2013; Klunzinger et al., 2014), but no studies have reported the successful marking of shells with darkcolored periostraca using ARS.
CAL is the optimum fluorochrome for estimating growth in many larval and juvenile bivalves (Linard et al., 2011; van der Geest et al., 2011; Klunzinger et al., 2014). CAL is also the most suitable fluorochrome for tracking pulmonate limpet larvae (Siphonaria australis), as it can penetrate the gelatinous egg matrix and larval capsule (Fitzpatrick et al., 2010). CAL has been used to stain sensitive early life stages of green-lipped mussel to identify individuals of interest and for large-scale marking (Fitzpatrick et al., 2013). In our experiment, both ARS and CAL were useful for large-scale marking, but CAL was considered the optimal fluorochrome to measure the growth of ark shells because it provided clearly marked rings and shell edges. However, the efficacy of ARS and CAL to track larval ark shells needs further investigation.
The effective duration of fluorescent marking depends on fluorochrome concentration. Bright fluorescent marks were observed on abalone stained with CAL (10-120 mg/L) for 14 days (Day et al., 1995). Fluorescence faded in saucer scallop stained with CAL (10-50 mg/L) during the first few months (Lucas et al., 2008). However, in the present study, marking color was clearly detectable in ark shells stained with 200-300 mg/L CAL or ARS after 1 year. It was concluded that the duration of fluorescent marking could be prolonged by increasing the fluorochrome concentration. A clear correlation was found in ark shells between age and brightness of the mark produced, probably because, over time, thickening of the shell covered the fluorescent marks with successive layers of shell growth (Fitzpatrick et al., 2013). Furthermore, simple fading could have decreased brightness of the fluorescent marks. CAL marks fade in response to either large temperature fluctuations (i.e., 5°C above ambient) or exposure to light (Leips et al., 2001; Bashey, 2004).
In the current study, the retention rate of fluorescent staining was much higher than that of the clip tags and the cost of ARS and CAL (300 mg/L) marking was 1/3-1/20 of that of a clip tag. The fluorescent marking method is simple and rapid, with a high retention rate and low cost. Thus, it may be a better and more practical option for evaluating the success and effectiveness of large-scale stock enhancement programs and ecological surveys of ark shell stocks.
Clip tags can provide additional information, such as release date, institution of origin and number, making it possible to assess the success of stock enhancement. However, clip tagging is a more complex process that includes anesthesia and manually inserting a label. The additional information provided by clip tags would be valuable in understanding the growth and survival of a population or individuals to evaluate the effect of stock enhancement at micro and macro levels. Clip tags are particularly suitable for accurate marking during scientific research and, in addition, can be detected without killing the animals, which facilitates detecting marked shells in the field.
5 CONCLUSIONNo significant differences in survival rate or shell growth were observed in juvenile ark shells stained with one of two fluorochromes after 160 days of culture, and retention rates were 100% after 1 year. The fluorescent-stain marks (grade≥3) could be detected under a microscope, and the marks (grade≥4) on some samples could be seen with the naked eye after 1 year (brightest stain detected at 300 mg/L ARS). Both ARS and CAL were useful for large-scale marking of A. broughtonii, and optimal marking quality was observed in the 300 mg/L ARS group. Retention rates of the clip tags tended to be stable over time, as they were gradually incorporated into the shell, but clip tags had an adverse impact on survival and growth of ark shell. Thus, lighter and smaller clip tags are required to reduce injury to juvenile bivalves and increase their survival rates. The long-term (3-5 years) application of a marking technique and its effectiveness in studying stock enhancement needs to be investigated.
| Baer J, Rösch R, 2008. Mass-marking of brown trout (Salmo trutta L.) larvae by alizarin:method and evaluation of stocking. J. Appl. Ichthyol, 24(1): 44–49. Doi: 10.1111/j.1439-0426.2007.01038.x |
| Barker J M, McKaye K R, 2004. Immersion marking of juvenile Midas cichlids with Oxytetracycline. North Am.J. Fish. Manage., 24(1): 262–269. Doi: 10.1577/M02-144 |
| Bashey F, 2004. A comparison of the suitability of alizarin red S and calcein for inducing a nonlethally detectable mark in juvenile guppies. Trans. Am. Fish. Soc., 133(6): 1 516–1 523. Doi: 10.1577/T03-073.1 |
| Broom M J, 1985. The biology and culture of marine bivalve molluscs of the genus Anadara. ICLARM Stu. Rev., 12: 37. |
| Day R W, Williams M C, Hawkes G P, 1995. A comparison of fluorochromes for marking abalone shells. Mar.Freshwater. Res., 46(3): 599–605. Doi: 10.1071/MF9950599 |
| Eckmann R, 2003. Alizarin marking of whitefish, Coregonus lavaretus otoliths during egg incubation. Fisheries Manag. Ecol., 10(4): 233–239. Doi: 10.1046/j.1365-2400.2003.00345.x |
| Evseev G A, Lutaenko K A, 1998. Bivalves of the subfamily Anadarinae (Arcidae) from Vietnam. Malacol. Rev., 31(S7): 1–37. |
| Fitzpatrick M P, Jeffs A G, Dunphy B J, 2010. Identification of the optimal fluorochrome for marking larvae of the pulmonate limpet Siphonaria australis. J. Shellfish Res., 29(4): 941–944. Doi: 10.2983/035.029.0427 |
| Fitzpatrick M P, Jeffs A G, Dunphy B J, 2013. Efficacy of calcein as a chemical marker of green-lipped mussel (Perna canaliculus) larvae and its potential use for tracking larval dispersal. Aquac. Res., 44(3): 345–353. Doi: 10.1111/are.2013.44.issue-3 |
| Frenkel V, Kindschi G, Zohar Y, 2002. Noninvasive, mass marking of fish by immersion in calcein:evaluation of fish size and ultrasound exposure on mark endurance. Aquaculture, 214(1-4): 169–183. Doi: 10.1016/S0044-8486(02)00135-7 |
| Kaehler S, McQuaid C D, 1999. Use of the fluorochrome calcein as an in situ growth marker in the brown mussel Perna perna. Mar. Biol., 133(3): 455–460. Doi: 10.1007/s002270050485 |
| Klunzinger M W, Beatty S J, Morgan D L, Lymbery A J, Haag W R, 2014. Age and growth in the Australian freshwater mussel, Westralunio carteri, with an evaluation of the fluorochrome calcein for validating the assumption of annulus formation. Freshw. Sci., 33(4): 1 127–1 135. Doi: 10.1086/677815 |
| Leips J, Baril C T, Rodd F H, Reznick D N, Bashey F, Visser G J, Travis J, 2001. The suitability of calcein to mark poeciliid fish and a new method of detection. T. Am. Fish.Soc., 130(3): 501–507. Doi: 10.1577/1548-8659(2001)130<0501:TSOCTM>2.0.CO;2 |
| Lemarie D P, Smith D R, Villella R F, Weller D A, 2000. Evaluation of tag types and adhesives for marking freshwater mussels (Mollusca:Unionidae). J. Shellfish.Res., 19(1): 247–250. |
| Linard C, Gueguen Y, Moriceau J, Soyez C, Hui B, Raoux A, Le Moullac G, 2011. Calcein staining of calcified structures in pearl oyster Pinctada margaritifera and the effect of food resource level on shell growth. Aquaculture, 313(1-4): 149–155. Doi: 10.1016/j.aquaculture.2011.01.008 |
| Liu Q, 2009. Japanese flounder marking techniques and Juveniles released for stock enhancement. Ocean University of China, Qingdao, China. |
| Lu H J, Zhang X M, Xi D, Gao T X, 2014. Use of calcein and alizarin red S for immersion marking of black rockfish Sebastes schlegelii juveniles. Chin. J. Oceanol. Limnol., 32(1): 88–98. Doi: 10.1007/s00343-014-3022-9 |
| Lucas T, Palmer P J, Wang S Z, Scoones R, O'brien E, 2008. Marking the shell of the saucer scallop Amusium balloti for sea ranching using oxytetracycline, calcein and alizarin red S. J. Shellfish Res., 27(5): 1 183–1 188. Doi: 10.2983/0730-8000-27.5.1183 |
| Matsukuma A, Okutani T. 2000. Family Arcidae, order Arcoida. Marine Mollusks in Japan. Tokai University Press, Tokyo, Japan. p.844-855. |
| Moran A L, Marko P B, 2005. A simple technique for physical marking of larvae of marine bivalves. J. Shellfish. Res., 24(2): 567–571. Doi: 10.2983/0730-8000(2005)24[567:ASTFPM]2.0.CO;2 |
| Morgan S G. 2001. The larval ecology of marine communities.Marine Community Ecology. Sinauer Associates, New York. p.159-181. |
| Morgan S G. 2001. The larval ecology of marine communities.Marine community ecology. Sinauer Associates, Sunderland, Massachusetts, USA. p.159-181. |
| National Standardization Management Council. 2008. GB/T 12763. Specifications for oceanographic survey-Part 6:Marine biological survey. China Standard Publishing House, Beijing. (in Chinese) |
| Neigel J E, 2002. Is FST obsolete? Conserv. Genet., 3(2): 167–173. |
| Nishida K, Ishimura T, Suzuki A, Sasaki T, 2012. Seasonal changes in the shell microstructure of the bloody clam, Scapharca broughtonii (Mollusca:Bivalvia:Arcidae). Palaeogeogr. Palaeocl., 363: 99–108. |
| Oliveira K, 1996. Field validation of annular growth rings in the American eel, Anguilla rostrata, using tetracyclinemarked otoliths. Fish. B., 94(1): 186–189. |
| Palumbi S R, 2003. Population genetics, demographic connectivity, and the design of marine reserves. Ecol.Appl., 13(sp1): 146–158. Doi: 10.1890/1051-0761(2003)013[0146:PGDCAT]2.0.CO;2 |
| Silina A V, 2006. Spatial heterogeneity and long-term changes in bivalve Anadara broughtonii population:influence of river run-off and fishery. Ocean. Sci. J., 414(4): 211–219. |
| Skov C, Grønkjær P, Nielsen C, 2001. Marking pike fry otoliths with alizarin complexone and strontium:an evaluation of methods. J. Fish. Biol., 59(3): 745–750. Doi: 10.1111/jfb.2001.59.issue-3 |
| Somero G N, 2002. Thermal physiology and vertical zonation of intertidal animals:optima, limits, and costs of living. Integr. Comp. Biol., 42(4): 780–789. Doi: 10.1093/icb/42.4.780 |
| Tang Q X, Wang J, Qiu X Y, Guo X W, 1994. S tudies on releasing enhancement of Scapharca broughtonii. Mar.Fish. Res(15): 79–86. |
| Taylor M D, Fielder D S, Suthers I M, 2005. Batch marking of otoliths and fin spines to assess the stock enhancement of Argyrosomus japonicus. J. Fish. Biol., 66(4): 1 149–1 162. Doi: 10.1111/jfb.2005.66.issue-4 |
| Thorrold S R, Jones G P, Hellberg M E, Burton R S, Swearer S E, Neigel J E, Morgan S G, Warner R R, 2002. Quantifying larval retention and connectivity in marine populations with artificial and natural markers. B. Mar. Sci., 70(S1): 291–308. |
| van der Geest M, van Gils J A, van der Meer J, Olff H, Piersma T, 2011. Suitability of calcein as an in situ growth marker in burrowing bivalves. J. Exp. Mar. Biol. Ecol., 399(1): 1–7. Doi: 10.1016/j.jembe.2011.01.003 |
| van der Walt B, Faragher R A, 2003. Otolith marking of rainbow trout fry by immersion in low concentrations of alizarin complexone. N. Am. J. Fish. Manage., 23(1): 141–148. Doi: 10.1577/1548-8675(2003)023<0141:OMORTF>2.0.CO;2 |
| Wang Z C, Zhang G F, Gao Y M, Zhang C Y, 1987. Effects of temperature and foods on the development of gonad of the blood cockle, Arca inflata. J. Dalian. Fish. Coll(2): 1–10. |
| Wang Z S, Sui X L, 1996. Preliminary study of the death of Scapharca broughtonii in simulating ecological conditions. Fish. Sci., 15(2): 31–33. |
| Xiao Y X, Su J J, Xu E D, 1994. Effects of salinity on growth of juvenile and on fattening and mature acceleration of parent Scapharca broughtonii (Schrenck). Mar. Sci(4): 5–7. |