 2017, Vol. 35
Institute of Oceanology, Chinese Academy of Sciences
Article Information
- ZHU Jianhua(朱建华), ZHOU Hongli(周虹丽), HAN Bing(韩冰), LI Tongji(李铜基)
- Measurement and feature analysis of absorption spectra of four algal species
- Chinese Journal of Oceanology and Limnology, 35(2): 350-359
- http://dx.doi.org/
Article History
- Received Nov. 12, 2015
- accepted in principle Dec. 31, 2015
- accepted for publication Jan. 18, 2016


Characteristics of optical absorption spectra of marine phytoplankton play key roles in primary productivity, optical radiative transfer in seawater, and passive remote sensing of phytoplankton (Abramowitz and Segun, 1968; Yentsch and Phinney, 1989; Bricaud et al., 2004; Marra et al., 2007). Numerous studies have shown that the absorption coefficients of phytoplankton were correlated with cell type, pigment amount, pigment composition, and physiological status of the phytoplankton population (Mitchell and Kiefer, 1988a; Millanán-Núñez et al., 1998; Suzuki et al., 1998; Lohrenz et al., 2003; Wang et al., 2007; Ras et al., 2008; Lan et al., 2013; Zhuang et al., 2014). In earlier researches, pigments of phytoplankton were generally studied as chlorophyll a (Chl a), or Chl a plus its degradation product (phaeopigments). There have been many studies focusing on the absorption coefficients of phytoplankton either in laboratory cultures or in natural water samples (Lorenzen et al., 1967; Bidigare et al., 1989; Bricaud et al., 2007; Zhou et al., 2010, 2011). Several studies report the spectral patterns of particle light absorption (Maske and Haardt, 1987; Yentsch and Phinney, 1989; Cleveland, 1995) and a non-linear correlation between optical absorption coefficient and chlorophyll concentration in phytoplankton. This correlation varies with environmental condition, particle shape and size, and pigment and debris concentrations in phytoplankton (Morel and Bricaud, 1981; Bricaud and Stramski, 1995). Cell size and photosynthetic pigment composition of phytoplankton were thought to contribute to changes in specific absorption coefficients, defined as the ratio of pigment absorption and its concentration. These studies also showed that it could be more simple and practical to use a single pigment (e.g., chlorophyll a) to explain changes in optical absorption. However, because the absorption coefficient of phytoplankton is a complex summation of absorption coefficients of photosynthetic carotenoid (PSC) and photo-protective carotenoid (PPC), different results and conclusion can be drawn if different methods or classification criteria are used in various studies.
Due to the small number of phytoplankton cells in seawater and difficulty in pigment extraction, it is very hard to obtain absorption coefficient of phytoplankton pigments. Yentsch (1962) used glass fiber filter (GF/F) for the first time to accumulate particles present in seawater, which was then used to measure the optical density of particles in seawater by a spectrophotometer, thus establishing a method to obtain absorption coefficients for suspended particles in seawater. This method has been widely used and revised (Allali et al., 1995; Chavez et al., 1995; Ferrari and Tassan, 1996, 1999). Mitchell (1990) designated this method as the quantitative filter technique (QFT). In the SeaWiFS program, Mitchell et al. (2000) recommended QFT as standard method for determining the absorption coefficient of aquatic particles and also proposed two methods based on methanol extraction and sodium hypochlorite oxidation to remove the particulate pigments on GF/F filter to obtain the absorption coefficient of phytoplankton pigments. Jeffrey et al. (1997) described the method of using high-performance liquid chromatography (HPLC) to analyze phytoplankton pigments. HPLC was recommended as the standard method in the SeaWiFS program to measure pigment concentration of phytoplankton. Various types of pigment can also be isolated by HPLC from which the absorption spectra of every single pigment can be determined. Hence, HPLC can also be used to measure absorption coefficients of phytoplankton pigments (noted as HPLC method). Moreover, a new method is also proposed to use a dual beam spectrophotometer (Bidigare et al., 1990) to obtain the absorption coefficient of in vivo concentrated phytoplankton suspension (noted as InVivo method). In addition, we used a dual beam spectrophotometer to measure the absorption coefficient of extracted pigments by Acetone, which was noted as the AceEx method. Among all methods mentioned above, the QFT and InVivo methods can be used to determine the absorption coefficient of particulate phytoplankton pigment, while the HPLC and AceEx methods can be used to determin that of dissolved pigments.
This study aimed to use the different methods previously described to obtain the absorption coefficients of particulate and dissolved phytoplankton pigments, and then to compare difference in magnitude, shape, peak position of the absorption spectra determined by these methods. Afterwards, feature analysis of the absorption spectra of four typical blue-green algal species was performed to obtain major characteristics in them, which can be laid as the basis for future studies in pigment absorption coefficients and their specific absorption coefficients.
2 METHOD AND DATA 2.1 Laboratory algal cultureFour algal species, i.e., Platymonas, Heterosigma akashiwo, Nannochloris oculata, and Dunaliella salina, belonging to blue-green algae, were selected in study. All algal species were incubated in illuminated growth chambers in our laboratory. The culture conditions were an f/2 culture medium, a salinity of 32, L:D of 12:12, a light intensity of 2 000 lx, a temperature of 18±1℃ and a pH value of 7.5. Platymonas, Heterosigma akashiwo, Nannochloris oculata and Dunaliella salina were cultured in 3-L conical flasks and sampled during the algal growth cycle for 19 consecutive days.
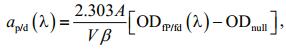
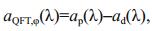
2.2 Absorption coefficients of algal pigments measured using QFT methodGF/F filter, with a diameter of 25 mm and a pore size of approximately 0.7 μm, was presoaked in purified seawater (i.e., filtered through membrane with pore size of about 0.2 μm) for 30 min and used to filter particles in the algal cultures at 120-140 mmHg negative pressure (Mitchell, 1990). A Cintra 20 spectrophotometer (CBC Scientific Equipment, Australia) was used to measure the optical absorbance spectra of total particles (ODfP(λ)) and non-pigment particles (ODfd(λ)) retained on the filter pad before and after addition of more than 2 drops of NaClO solution (1% active chlorine) to the filter for pigment removal. The absorbance spectrum was interpolated to 1-nm and smoothed using the Akima method (Akima, 1970). The difference in the original and smoothed curve were controlled in the range of±0.005 OD. The mean optical density between 790 nm and 800 nm was used for the null correction of absorption spectra. The optical path-length amplification factor from Mitchell (1990) were used to calculate absorption coefficients using Eq.1, including the absorption coefficients of total particles (ap(λ)) and non-pigment particles (ad(λ)). The pigment absorption coefficient of phytoplankton (aφ(λ)) was calculated as their difference (Eq.2).
 (1)
(1) (2)
(2)where A represents the effective area (cm2) of filter pad occupied by phytoplankton particles; V represents the sample volume (mL) of algal solution; and β represents the correction factor of amplified optical path-length.
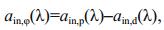
2.3 Absorption coefficients of in vivo algal pigments measured using In Vivo methodTwo milliliters of algal culture and two milliliters of 0.2 μm fresh medium were taken daily as the algal sample and reference (Dbk(λ)), respectively. Following protocol proposed by Tassan and Ferrari (1995a, 1998), measurement was made with the same spectrophotometer with an integrating-sphere system under same configuration. Under the transmission measurement mode (T-mode), the optical density of total in vivo particles (ODsp(λ)) in the algal sample and that of total non-pigment particles (ODsd(λ)) were measured before and after a droplet of 1% NaClO solution was added into the algal sample solution, which was used for pigment removal by oxidation. Same method as the QFT method for wavelengthinterpolation, spectra smoothing and null correction were adapted to convert the optical density to the absorption coefficients of in vivo particles (ain, p(λ)) and non-pigment particles (ain, d(λ)) using Eq.3. Pigment absorption coefficients of the in vivo particles (ain, φ(λ)) were calculated as their difference (Eq.4).
 (3)
(3) (4)
(4)where l represents the optical path of the cuvette, i.e., 1 cm.
2.4 Absorption coefficients of algal pigments measured using AceEx methodCertain volume of algal cultures were taken and filtered daily through a 25-mm diameter Whatman GF/F membrane under 180-200 mmHG pressure. The GF/F membrane was then transferred into a 15 mL centrifuge tube, followed by precisely pipetting 7 mL of HPLC-grade 90% acetone solution (v/v in ultrapure water) into the centrifuge tube. After ultrasonic vibration in an ice bath, the centrifuge tube was placed in a freezer ( < 0℃) for 24 hours for pigment extraction, followed by centrifuging the pigment solution and collecting the pigments from the supernatant. To measure the optical density of extracted pigments (ODint, ϕ(λ)), 3 mL of supernatant solution was inserted into a 1-cm-long cuvette and measured using the same spectrophotometer as other methods mentioned above. The 90% acetone solution was used as the reference solution. Wavelengthinterpolation, spectra smoothing and null correction were performed as that for the QFT method to determine the absorption coefficients of the extracted pigment solutions (aACE, φ(λ)) using Eq.5.
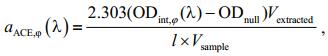 (5)
(5)where Vextracted represents the volume of extracted pigment solution, which was 7 mL in this study; Vsample represents the sample volume (mL) of algal solution; and l represents the optical path-length of the cuvette, which was 1 cm in this test.
2.5 Absorption coefficients of pigments measured using HPLC methodThe supernatant of the pigment extract was prepared with the same procedure as that for the AceEx method and was then injected into the HPLC system for chromatographic analysis. The Waters 600E system used in the HPLC measurement contained a 996 photodiode array detector (PDA), a 600E quaternary solvent delivery system, a 717 plus autosampler, an online solvent degasser, and a C18 (ODS) column. The analysis program of pigment standards and samples was based on the theory of ternary gradients in reversed-phase liquid chromatography as in Zhu (Zhu, 2003; Zhu et al., 2005). According to the chromatographic data of pigment standards, the absorbance spectra of different pigments between 350 nm and 800 nm (ODHPLC, i(λ)) were measured for each sample. Absorption coefficients of each pigment in each sample were calculated according to Eq.6. For a particular sample, the pigment absorption coefficient (aHPLC, ϕ(λ)) was calculated as the sum absorption coefficient of all pigments detected in each sample.
 (6)
(6)where Vextracted represents the volume of pigment extract, which was 3 mL in this test; Vsample represents the sample volume (mL) of the algal solution; Vinjected represents the volume of pigment extract injected into the chromatographic column; l represents the optical path-length of HPLC flow cell, which was 1 cm in this test; and n represents the pigment types detected by HPLC.
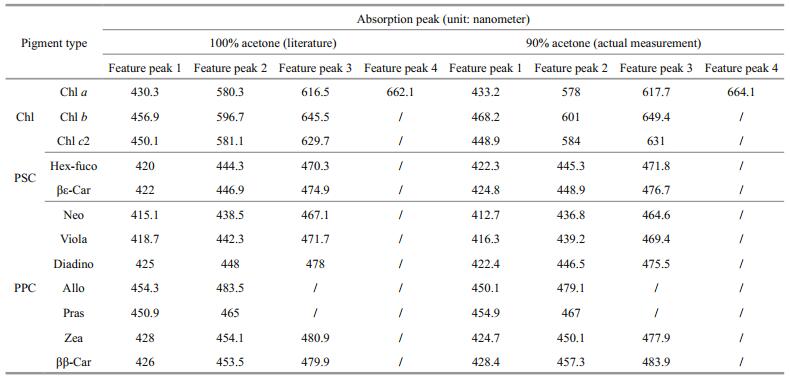
3 RESULT AND DISCUSSION 3.1 Absorbance of algal pigments measured using HPLC methodTable 1 shows the pigment types present in four blue-green algal species (i.e., Platymonas, Heterosigma akashiwo, Nannochloris oculata, and Dunaliella salina) which were detected by HPLC system. According to pigment classification methodology of Bidigare and Ondrusek (1990), chlorophyll includes chlorophyll a, b, and c2; photosynthetic pigment includes Hex-fuco and βε-Car; and photoprotective pigment includes Neo, Viola, Diadino, Allo, Pras, Zea, and ββ-Car.

However, the pigment types present in each of four blue-green algae species were not exactly same. Chl a, Viola, and Diadino were three pigments common to every species. Chl b and Allo, Chl c2 and Pras, Zea, and ββ-Car were the unique pigment (s) of Platymonas, Heterosigma akashiwo, Nannochloris oculata, and Dunaliella salina, respectively. Neo was not detected in Heterosigma akashiwo, and βε-Car was not detected in Dunaliella salina. Pigments that were not detected in particular algal species may not exist indeed, or their concentrations were below the limit of detection and, thus, cannot be isolated by the HPLC system under current configuration.
Figure 1 demonstrates the optical absorbance spectra of different pigments measured by the HPLC system. Both Chl a and Chl b had significant absorption peaks in the blue and red (Fig. 1a). The significant absorption peaks of Chl a were found near 433 nm and 664 nm, while the significant absorption peaks of Chl b were located near 468 nm and 649 nm. Both also had a smaller peak located between 550 nm and 650 nm. Chl c2 only had a significant absorption peak in the blue (near 450 nm) and two smaller absorption peaks between 550 nm to 650 nm (near 581 nm and 629 nm, respectively). Chlorophyll-type pigments have high, sharp and narrow absorption peaks. Absorption peaks of photosynthetic pigments (PSC) were as broad as~150 nm (approximately 350 nm-500 nm), with two smaller sharp spikes overridden on them (Fig. 1b). Almost no absorption peaks can be found beyond 500 nm. The absorption peaks of photoprotective pigments (PPC) shows similar pattern with PSC pigments. Two or three small spikes were found on a broad absorption plateau and almost no absorption peak was found beyond 500 nm (Fig. 1c). Absorbance spectra of Pras demonstrated an extremely broad absorption peak, with peak center near 450 nm and width over 200 nm. Total pigment absorption of algae can be calculated as the sum of the absorption of each individual pigment present in each species, which suggests that total pigment absorption was significantly affected by variation in magnitude and shape of absorption spectra of each individual pigment, which in turn was determined by their composition and amount. According to the absorption characteristics of Chl, PSC, and PPC as described above, the variation of the total pigment absorption spectra in algal species seemed to be probably between 400 nm and 500 nm. In this domain, difference in pigment types and their portfolio in different algal species results in various absorption spectra pattern among species. Between 500 nm and 600 nm, due to very weak or even no pigment absorption, no significant change can be found within this domain. Table 2 lists featured peaks and shifts in the pigment absorption spectra of four different algal species. The featured peak positions (90% acetone, left column in Table 2) found in this study showed certain shift from those of Jeffrey et al. (1997) (100% acetone, right column in Table 2).

|
| Figure 1 Pigment absorption spectral density a. chlorophylls (Chl); b. photosynthetic carotenoids (PSC); c. photoprotective carotenoids (PPC). |
|
To compare the absorption spectral patterns of the four algae species, we normalized the optical absorption coefficients at 440 nm, i.e.,
 (7)
(7)where X represents the different methods (i.e., QFT, HPLC, AceEx, and InVivo, respectively). The four methods were used to determine the absorption coefficient spectra. Figure 2 shows the normalized absorption coefficient spectra of four algal cultures measured using four different methods. The spectral patterns of normalized absorption coefficients from the four methods were consistent with each other. The relative standard deviation of the absorption spectra between 400 nm and 500 nm and between 600 nm and 700 nm were no more than 20%, mostly about 10%. However, relative standard deviation in between 500 nm and 600 nm was as large as 40% due to very weak absorption (data not shown). As previously mentioned, the optical absorption coefficient and algal pigment spectral pattern were determined by the pigment types in the algae and their proportional contribution. In general, same algal species and algal species with similar pigment portfolio were thought to have similar absorption spectra. The absorption spectra of accessory pigments varied the most in the absorption wavelength intervals. The spectral patterns of normalized absorption coefficients measured using different methods were consistent with significant absorption peaks in the blue and red (Fig. 2). However, there were differences in the detailed structure between them. Between 450 nm and 500 nm, absorption spectra measured by QFT, InVivo, and HPLC showed that the peak plateau was due to the absorption of carotenoid, which reflects significant difference among species. HPLC performed best among them. The peak shoulder in absorption spectra measured by AceEx was not prominent, especially for Heterosigma akashiwo and Dunaliella salina. Between 500 nm and 600 nm, optical absorption coefficients measured by QFT and InVivo were significantly higher than those measured by HPLC and AceEx. It may be due to difference in sample pretreatments. For example, algal samples treated in QFT and InVivo may contain other debris which increased the optical absorption coefficients. Similar results were also found in Wright et al. (1991) and Tassan et al. (2000). On the other hand, algal samples used by HPLC and AceEx methods contained only pigment extracts with no other substance. Between 600 nm and 700 nm, absorption spectra measured by QFT, InVivo, and HPLC methods appeared several small peaks due to chlorophyll-type pigments, while no peaks appeared in those measured by AceEx. It may be due to disturbance from other pigments acetone extract was measured by spectrophotometer. It is known that the absorption properties of pigment may change with different solvent used for used for pigment extraction. For example, Sathyendranath et al. (1987) indicated that pigment absorptions of acetone extracts could not be used for quantitative assessment of changes of specific absorption due to in pigment composition.

|
| Figure 2 Four methods (a. QFT; b. InVivo; c. HPLC; d. AceEx) were used to determine the normalized spectrum of absorption coefficients from a culture of four algal species |
Table 3 summarizes the absorption peak positions in the blue and red. The optical absorption peaks in the blue for four algal species measured by different methods was located between 433 nm and 441 nm, and their difference was less than 10 nm. The peak positions in the blue were slightly different and smaller than 440 nm as found by Zhu and Li (2004) and Ruivo et al. (2011). The absorption peaks in the red measured by QFT and InVivo were located between 670 nm and 680 nm. The peaks of Platymonas, Dunaliella salina, and Nannochloris oculata were located between 676 nm and 680 nm, and were slightly larger than 675 nm which was commonly used in earlier studies. The peak position for Dunaliella salina was slightly less than 675 nm, i.e., 674 nm.The difference in peak positions measured by QFT and InVivo was relatively small (~3 nm). However, the absorption peaks in the red measured by HPLC and AceEx were found between 660 nm and 670 nm, mostly around 665 nm (data not shown) and deviation about 10 nm. In principle, the QFT and InVivo methods measured pigment in particulate status, while HPLC and AceEx measured extracted pigment in solution status. Therefore there was no surprise about the shift of peak positions. Results of HPLC and AceEx significantly represented the contribution from pigments themselves, while those of QFT and InVivo may be also affected by multiple reflection and fluorescence effects.
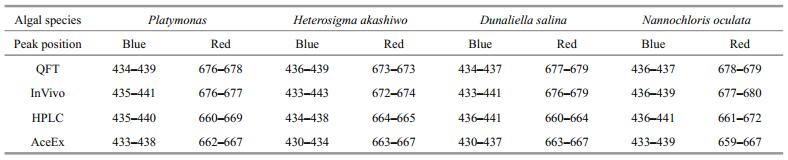
Figure 3 illustrates the absorption coefficients of Heterosigma akashiwo measured using the four methods during the culture period. As seen in Fig. 3a and 3b, both the total absorption pigment coefficients at 440 nm and 675 nm (QFT and InVivo methods) or 665 nm (HPLC and AceEx methods) were significantly increased with time. There were more fluctuations in absorption coefficient by the HPLC and AceEx methods when compared to those by the QFT and InVivo methods. For same sample, differences in absorption coefficients from the four methods were very significant, with the HPLC method giving the largest measurement, the InVivo method giving the least, and the AceEx and QFT methods giving intermediate and close results. Figure 3c shows ratio of the absorption in the blue to that in the red. These ratios explain the absorption of accessory pigments and Chl to a certain degree. During the sampling period, the ratios from the InVivo and QFT methods were relatively stable and approximately 1 and 1.5, respectively, but the ratios from the AceEx varied from 2.5 to 3 and that from the HPLC method showed largest variation (from 1.5 to 3.5). In other words, the HPLC method was most sensitive to accessory pigment absorption, followed by the AceEx method, while InVivo and QFT were least sensitive in this regard. The largest fluctuation in HPLC results showed changes in quantities and ratio of accessory pigments and Chl during the algal culture time. Figure 3d shows the absorption coefficient ratios of particulate pigments (QFT and InVivo) and dissolved pigments (HPLC and AceEx). According to van de Hulst (1957) and Morel and Bricaud (1981), the package effect factor was defined as the ratio between the absorption coefficient of same quantity of pigments in the in vivo cells and in the dissolved state. Finkel (2001) proposed the formula for package effect as Q*=a*/aS*, where Q* represents the package effect, a* represents the pigment absorbance of the in vivo cells and aS* represents the absorbance of pigments in solution. Lower Q* means more significant package effect. As shown in Fig. 3d, except for the larger quantity and greater variability in QFT/AceEx, the other three ratios were relatively stable. QFT/ HPLC ratio ranged from 20% to 60% (mean of~35%, std of ***), InVivo/HPLC ratio ranged from 5% to 20% (mean of~13%, std of ***) and InVivo/AceEx ratio ranged from 10% to 40% (mean of~24%, std of ***). In the red (i.e., 675 nm or 665 nm), the corresponding ratios of QFT/HPLC, InVivo/HPLC, and InVivo/AceEx were 46%, 29%, and 64%, respectively. In conclusion, the package effect in the blue was significantly greater than that in the red, indicating that the package effects of accessory pigments (e.g., carotenoids and Chl) were significant. During the growth cycle of Heterosigma akashiwo, variation of the package effect was small. Results for the other three algal species were similar (data not shown). We also noticed from the definition of the package effect that it was not clear about which method should be used in absorption measurement either for in vivo cell or for dissolved pigments. With the advancement of theory and technology, studies of the package effect based on the measured data should pay more attention to differences among methods and careful selection of appropriate methods.

|
| Figure 3 Absorption coefficients of Heterosigma akashiwo in sampling period measured by different methods (a and b); absorption coefficient ratio between blue and red wavelengths (c); and absorption coefficient ratio of different methods (d) Similar results were found in the other three algal species (data not shown). Of all methods, algal sampling of AceEx was started on the 8th day according to the previous described procedures. Wavelength used for the measurement of absorption coefficients using HPLC and AceEx was 665 nm. |
In this study, two methods for absorption measurements of particulate pigments (QFT and InVivo) and two methods for dissolved pigments (AceEx and HPLC) were used to obtain the optical absorption coefficient spectra from the laboratory cultures of four typical algal species. This study showed that (1) all four methods could be used to measure the absorption coefficients of pigments present in phytoplankton. The absorption peaks in the blue and in the red were obvious with significant difference between 450 nm and 500 nm among different methods. Physical separation of pigments used in the HPLC method was assumed as the most accurate method for pigment absorption measurement and also the best way to analyze the contribution from different types pigments (e.g., chlorophyll, photosynthetic carotenoid, and photoprotective carotenoid). The AceEx method, which also measured dissolved pigment absorption, had an interruption effect in the absorption of the pigment solution. It concealed the absorption of different carotenoids between 450 nm and 500 nm. Between 500 nm and 600 nm, absorption coefficients of particulate pigments measured by the QFT and InVivo methods were affected by other substances; (2) the optical absorption coefficient spectra measured by the four methods showed different peak positions in the blue and in the red. The HPLC and AceEx methods measured the absorption of dissolved pigments, which reflected absorption of pigments. In the HPLC and AceEx methods, the absorption peaks in the blue were located between 430 nm and 440 nm, and the absorption peaks in the red were located between 660 nm and 670 nm. These absorption peak positions varied among different algal species. The QFT and InVivo methods measured the absorption coefficient of particulate pigments in phytoplankton, including the amplification effect of optical path-length and the distribution of particle diameter. In the QFT and InVivo methods, the absorption peaks in the blue were located between 430 nm and 440 nm, and the absorption peaks in the red were located between 670 nm and 680 nm; (3) during the culture period, the values of absorption coefficients in different algal species measured by the four methods were significantly different. The results measured by the HPLC were significantly larger than the other three methods. According to the principles of various methods, the QFT and InVivo methods had an inhibiting effect in the measurement of absorption coefficient values and a leveling effect in absorption coefficient spectra (package effect).
In conclusion, the QFT, InVivo, HPLC, and AceEx methods were convenient and effective methods to determine the absorption coefficients of pigments in phytoplankton and each had their advantages in different applications. In addition, these methods also showed large variations, therefore requiring careful selection. We believed that (1) the HPLC was the most accurate methodology to obtain absorption coefficient spectra. The spectral patterns accurately reflected the contributions from different pigments; (2) in QFT and InVivo, the absorption peaks of particulate pigments in the red were located between 670 nm and 680 nm, while in HPLC and AceEx, the absorption peaks of dissolved pigments in the red were located between 660 nm and 670 nm. The peaks positions measured by the latter two methods showed deviation of approximately 10 nm; (3) except for HPLC, the other three methods had leveling effects in absorption coefficients.
| Abramowitz A, Segun I A. 1968. Handbook of Mathematical Functions. Dover, New York. |
| Akima H, 1970. A new method of interpolation and smooth curve fitting based on local procedures. Journal of the ACM, 17(4): 589–602. Doi: 10.1145/321607.321609 |
| Allali K, Bricaud A, Babin M, Morel A, Chang P, 1995. A new method for measuring spectral absorption coefficients of marine particles. Limnology and Oceanography, 40(8): 1 526–1 523. Doi: 10.4319/lo.1995.40.8.1526 |
| Bidigare R R, Morrow J H, Kiefer D A, 1989. Derivative analysis of spectral absorption by photosynthetic pigments in the western Sargasso Sea. Journal of Marine Research, 47(2): 323–341. Doi: 10.1357/002224089785076325 |
| Bidigare R R, Ondrusek M E, Morrow J H, et al, 1990. In-vivo absorption properties of algal pigments.In:Proceedings of SPIE, Ocean Optical X. SPIE, Orlando, FL, United States, 1302: 290–302. |
| Bricaud A, Babin M, Morel A, et al, 1995. Variability in the chlorophyll-specific absorption coefficients of natural phytoplankton analysis and parameterize:analysis and parameterization. Journal of Geophysical Research, 100(C7): 13 321–13 332. Doi: 10.1029/95JC00463 |
| Bricaud A, Claustre H, Ras J et al. 2004. Natural variability of phytoplanktonic absorption in oceanic waters:influence of the size structure of algal populations. Journal of Geophysical Research Oceans, 109(C11), http://dx.doi.org/10.1029/2004JC002419. |
| Bricaud A, Mejia C, Blondeau-Patissier D, et al, 2007. Retrieval of pigment concentrations and size structure of algal populations from their absorption spectra using multilayered perceptrons. Appl. Opt., 46(8): 1 251–1 260. Doi: 10.1364/AO.46.001251 |
| Bricaud A, Stramski D, 1995. Spectral absorption coefficients of living phytoplankton and non-algal biogenous matter:a comparison between the Peru upwelling area and the Sargasso Sea. Limnology and Oceanography, 35(3): 562–582. |
| Chavez F, Buck K R, Bidigare R R, Karl D M, Hebel D, Latasa M, Campbell L, Newton J, 1995. On the chlorophyll a retention properties of glass-fiber GF/F filters. Limnology and Oceanography, 40(2): 428–433. Doi: 10.4319/lo.1995.40.2.0428 |
| Cleveland J S, 1995. Regional models for phytoplankton absorption as a function of chlorophyll a concentration. Journal of Geophysical Research, 100(C7): 13 333–13 344. Doi: 10.1029/95JC00532 |
| Ferrari G M, Tassan S, 1996. Use of the 0.22 μm Millipore membrane for light-transmission measurements of aquatic particles. Journal of Plankton Research, 18(7): 1 261–1 267. Doi: 10.1093/plankt/18.7.1261 |
| Ferrari G M, Tassan S, 1999. A method using chemical oxidation to remove light absorption by phytoplankton pigments. Journal of Phycology, 35(5): 1 090–1 098. Doi: 10.1046/j.1529-8817.1999.3551090.x |
| Finkel Z V, 2001. Light absorption and size scaling of lightlimited metabolism in marine Diatoms. Limnology and Oceanography, 46(1): 86–94. Doi: 10.4319/lo.2001.46.1.0086 |
| Jeffrey S W, Vesk M. 1997. Introduction to marine phytoplankton and their pigment signatures. In:Jeffrey S W, Mantoura R F C, Wright S W eds. Phytoplankton Pigments in Oceanography:Guidelines to Modern Methods. UNESCO, Paris, France. |
| Lan W L, Li M M, Li T S, 2013. Phytoplankton community structure based on pigment composition in Qinzhou bay during average water period. Acta Ecologica Sinica, 33(20): 6 595–6 603. Doi: 10.5846/stxb |
| Lohrenz S E, Weidemann A D, Tuel M, 2003. Phytoplankton spectral absorption as influenced by community size structure and pigment composition. Journal of Plankton Research, 25(1): 35–61. Doi: 10.1093/plankt/25.1.35 |
| Lorenzen C J, 1967. Determination of chlorophyll and pheopigments:spectrophotometric equations. Limnology and Oceanography, 12(2): 343–346. Doi: 10.4319/lo.1967.12.2.0343 |
| Marra J, Trees C C, O'Reilly J E, 2007. Phytoplankton pigment absorption:a strong predictor of primary productivity in the surface ocean. Deep Sea Research Part I:Oceanographic Research Papers, 54(2): 155–163. Doi: 10.1016/j.dsr.2006.12.001 |
| Maske H, Haardt H, 1987. Quantitative in vivo absorption spectra of phytoplankton:detrital absorption and comparison with fluorescence excitation spectra. Limnology and Oceanography, 32(3): 620–633. Doi: 10.4319/lo.1987.32.3.0620 |
| Millán-Núñez E, Lara-Lara J R, Cleveland J S, et al, 1998. Variations in specific absorption coefficients and total phytoplankton in the gulf of california. California Cooperative Oceanic Fisheries Investigations Reports, 39(10): 159–168. |
| Mitchell B G, Kiefer D A, 1988a. Chlorophyll a specific absorption and fluorescence excitation spectra for lightlimited phytoplankton. Deep Sea Research Part A.Oceanographic Research Papers, 35(5): 639–663. Doi: 10.1016/0198-0149(88)90024-6 |
| Mitchell B G. 1990. Algorithms for determining the absorption coefficient of aquatic particulates using the quantitative filter technique. In:Proceedings of SPIE, Ocean Optics X.SPIE, Orlando, FL, United States. 1302:137-148. |
| Mitchell G, Bricaud A, Carder K et al. 2000. Determination of spectral absorption coefficients of particles, dissolved material, and phytoplankton for discrete water samples.In:Fargion G S, Mueller J L eds. Ocean Optics Protocols for Satellite Ocean Color Sensor Validation, Revision 2.NASA/TM-2000-209966, NASA, Goddard Space Flight Center, Greenbelt, MD. p.125-153. |
| Morel A, Bricaud A, 1981. Theoretical results concerning light absorption in a discrete medium, and application to specific absorption of phytoplankton.Deep Sea Research Part A. Oceanographic Research Papers, 28(11): 1 375–1 393. |
| Ras J, Claustre H, Uitz J, 2008. Spatial variability of phytoplankton pigment distributions in the Subtropical South Pacific Ocean:comparison between in situ and predicted data. Biogeosciences, 5(2): 353–369. Doi: 10.5194/bg-5-353-2008 |
| Ruivo M, Amorim A, Cartaxana P, 2011. Effects of growth phase and irradiance on phytoplankton pigment ratios:implications for chemotaxonomy in coastal waters. Journal of Plankton Research, 33(7): 1 012–1 022. Doi: 10.1093/plankt/fbr019 |
| Sathyendranath S, Lazzara L, Prieur L, 1987. Variations in the spectral values of specific absorption of phytoplankton. Limnology and Oceanography, 32(2): 403–415. Doi: 10.4319/lo.1987.32.2.0403 |
| Suzuki K, Kishino M, Sasaoka K, Saitoh S I, Saino T, 1998. Chlorophyll-specific absorption coefficients and pigments of phytoplankton off Sanriku, northwestern north Pacific. Journal of Oceanography, 54(5): 517–526. Doi: 10.1007/BF02742453 |
| Tassan S, Ferrari G M, Bricaud A, Babin M, 2000. Variability of the amplification factor of light absorption by filterretained aquatic particles in the coastal environment. Journal of Plankton Research, 22(4): 659–668. Doi: 10.1093/plankt/22.4.659 |
| Tassan S, Ferrari G M, 1995a. An alternative approach to absorption measurements of aquatic particles retained on filters. Limnology and Oceanography, 40(8): 1 358–1 368. Doi: 10.4319/lo.1995.40.8.1358 |
| Tassan S, Ferrari G, 1998. Measurement of the light absorption by aquatic particles retained on filters:determination of the optical pathlength amplification by the 'transmittancereflectance' method. Journal of Plankton Research, 20(9): 1 699–1 709. Doi: 10.1093/plankt/20.9.1699 |
| van de Hulst H C. 1957. Light Scattering by Small Particles.John Wiley & Sons, New York, US. |
| Wang G F, Cao W X, Xu D Z, et al, 2007. Effects of size structure and pigment composition of algal population on phytoplankton absorption coefficients in the South China Sea. Acta Oceanologica Sinica, 29(1): 38–48. |
| Wright S W, Jeffrey S W, Mantoura R F C, Llewellyn C A, Bjørnland T, Repeta D, Welschmeyer N, 1991. Improved HPLC method for the analysis of chlorophylls and carotenoids from marine phytoplankton. Mar. Ecol. Prog.Ser., 77(2-3): 183–196. |
| Yentsch C S, Phinney D A, 1989. A bridge between ocean optics and microbial ecology. Limnology and Oceanography, 34(8): 1 694–1 705. Doi: 10.4319/lo.1989.34.8.1694 |
| Yentsch C S, 1960. The influence of phytoplankton pigments on the colour of sea water. Deep Sea Research, 7(1): 1–9. Doi: 10.1016/0146-6313(60)90002-2 |
| Yentsch C S, 1962. Measurement of visible light absorption by particulate matter in the ocean. Limnology and Oceanography, 7(2): 207–217. Doi: 10.4319/lo.1962.7.2.0207 |
| Zhou H L, Zhu J H, Han B, et al, 2010. Comparison of spectral absorption characteristics of several typical algae. Journal of Ocean Technology, 29(3): 78–81. |
| Zhou H L, Zhu J H, Yang A A, et al, 2011. Analysis of prorocentrum donghaiense lu absorb spectral characteristic. Journal of Ocean Technology, 30(1): 65–67. |
| Zhu J H, Li T J, 2004. Relationship research of phytoplankton pigments absorption and chlorophyll a concentration in in the East China Sea and Yellow Sea. Journal of Ocean Technology, 23(4): 117–122. |
| Zhu J H, Wu H M, Zhou H L, et al, 2005. Phytoplankton pigments concentration of Qinghai Lake by HPLC. Journal of Ocean Technology, 24(2): 46–49. |
| Zhu J H, 2003. Measurement of the ocean phytoplankton pigments concentration by HPLC. Journal of Ocean Technology, 22(1): 14–19. |
| Zhuang Y P, Jin H Y, Li H L, et al, 2014. Phytoplankton composition and its ecological effect in subsurface cold pool of the northern Bering Sea in summer as revealed by HPLC derived pigment signatures. Acta Oceanologica Sinica, 33(6): 103–111. Doi: 10.1007/s13131-014-0495-5 |