 2017, Vol. 35
Institute of Oceanology, Chinese Academy of Sciences
Article Information
- YUAN Yongquan(袁涌铨), YU Zhiming(俞志明), SONG Xiuxian(宋秀贤), CAO Xihua(曹西华)
- Temporal and spatial characteristics of harmful algal blooms in Qingdao Waters, China
- Chinese Journal of Oceanology and Limnology, 35(2): 400-414
- http://dx.doi.org/10.1007/s00343-016-5279-7
Article History
- Received Oct. 13, 2015
- accepted in principle Dec. 15, 2015
- accepted for publication Feb. 23, 2016


2 Laboratory of Marine Ecology and Environmental Science, Qingdao National Laboratory for Marine Science and Technology, Qingdao 266001, China;
3 University of Chinese Academy of Sciences, Beijing 100049, China
As a type of ecological disaster, harmful algal blooms (HABs) have been recorded for several decades in different watersheds worldwide. Within most records, in recent decades, there was an apparent improving trend of not only the frequency and scale but also the diversity of dominating species all over the world (Hallegraeff, 1993; Anderson et al., 2008).
Qingdao waters, including Jiaozhou Bay (JB) and the adjacent water out of JB (OJB), are areas in the Yellow Sea that are typically affected by HABs. Between 1990 and 2009, over 35% of records of HABs in the western Yellow Sea (west of 124°E) occurred in Qingdao waters (Bulletin of Marine Disaster of China, 1990-2009, SOA). Among these events, many in JB were recorded and further investigated in detail, including the Skeletonema costatum bloom that took place Jul. 3rd-8th, 1999 (Liu et al., 2005a), the Eucampia zoodiacus bloom that occurred June 8-15, 1999 (Huo et al., 2001; Zhang et al., 2002), and the blooms co-dominated by Eucampia zoodiacus and Skeletonema costatum that were present July 23-24, 1999 (Lu et al., 2001). Furthermore, the succession of dominating species and their connection to environmental factors in these records were also discussed. As a result, nutrient shifts, including the amount of increasing and structural variation, which were evidenced by sediment geochemical records (Dai et al., 2007; Liu et al., 2010) and environmental capacity calculation (Han et al., 2011), were believed to be the primary causes for inducing HAB occurrences in JB. Such hypotheses were supported by additional field observations (Nov. 2003-Oct. 2004, Yao et al., 2010) as well as long-term series analysis (Shen, 2001; Liu et al., 2008) and were further explained by climate change (Liu et al., 2008). Responding to the environmental changes in JB, the phytoplankton species structure shifted as the large-diatom richness and abundance declined (Shen, 2001), resulting in a greater dominance of smaller species (Shen et al., 2006; Yao et al., 2010), and the frequent adaption of nano-phytoplankton as well as pico-phytoplankton (Shen et al., 2001).
However, insufficient attention was directed towards HAB occurrences and the related environmental background in the OJB, where there are several small bays along the eastern coast of Qingdao, such as Tuandao Bay, Fushan Bay, and Shazikou Bay among others. In these watersheds, Shi et al. (2007) evaluated the water quality according to a field investigation implemented March 28, 2003. Xu et al. (2006) simulated pollutant discharge, advection and distribution based on a 2-year seasonal observation. However, few results on HAB occurrences in the OJB have been published to this day because of the difficulty in obtaining accessible data and insufficient data mining. As a result, it is difficult to develop a reliable description and reasonable explanation for the HAB occurrences and their effects on Qingdao waters in recent decades.
In this paper, 2 major themes are discussed: (1) to what extent have HAB occurrences varied in all Qingdao waters since 1990? (2) are there any reasonable explanations for such variation? Available data for this research were collected from multiple resources, including different bulletins, investigations, and relevant publications. In addition, geo-statistical analysis in geographic information system (GIS) was utilized for data mining and visualization. Such technologies have proven to be effective in environmental (Oguchi et al., 2000) and epidemiological (Lai et al., 2004) studies, and have previously been specifically employed in HAB studies (Wang and Wu, 2009; Wu et al., 2013). Provided technological improvements, it is possible to describe the temporal and spatial characteristics of HAB occurrences in Qingdao waters more reliably than before. Consequently, the results of this research should improve the current understanding on the patterns and trends in the variation of HAB occurrences in Qingdao waters, and also benefit the implementation of HAB monitoring and the development of a control strategy in China.
2 MATERIAL AND METHOD 2.1 Study areaThe city of Qingdao is located in northern China along the Yellow Sea (at 35°35′-37°09′N and 119°30′-121°00′E, Zhang and Rasiah, 2013). Within the Qingdao territory, JB is the major watershed. In addition, JB’s adjacent waters, the OJB, were also considered in this research (Fig. 1).

|
| Figure 1 HABs that occurred in Qingdao waters from 1990 to 2009 Each point denotes an individual HAB occurrence; colored isobaths denote different water depths. |
JB is a semi-enclosed bay with an average depth of 7 m. It connects to the Yellow Sea through a narrow mouth (up to 2.5 km). More than 10 small seasonal rivers enter the bay (Liu et al., 2005b); most of them discharge industrial and domestic wastes from Qingdao, thus becoming major external sources of nutrients entering the bay (Shen, 2001; Liu et al., 2005b). In the OJB, there are several small and shallow bays with an individual average depth no greater than 5 m, such as Tuandao Bay, Fushan Bay, and Shazikou Bay among others. Because of extensive anthropogenic activities, this area has suffered from a gradual increase in nutrients, such as DIN and DIP, which are primarily emitted by an excessive discharge of sewage in recent years (SOA, 2001-2009).
2.2 Data collection and managementIn this research, both the HAB occurrences and the potential HAB events were considered to reasonably evaluate the effects of the HABs in the entire area. In terms of the potential HAB events, the maximum density of the dominant species approached the critical threshold (at the same magnitude as the threshold or one magnitude below) closely. Therefore, these species were capable of potentially causing harmful side effects.
HAB data were collected from different bulletins. In China, HAB occurrences are recorded in 2 main types of annual bulletins, entitled the "Bulletin of Marine Environmental Quality" and the "Bulletin of Marine Disasters", which are issued by the SOA and the coastal provincial civic agencies with which it is affiliated. These events were recorded based on a HAB monitoring network that encompassed national, provincial, regional, and country-level monitoring stations affiliated with the SOA, following the technical protocols for red tide monitoring (HY/ T069-2005; SOA, 2005). Ship-tracking was the major tool for monitoring, whereas remote sensing and cruising aircraft were also useful in confirming HAB occurrences. Whenever an HAB event occurred, the location was recorded by the Global Positioning System (GPS), and the dominant species and its abundance were immediately identified by microscope analysis onboard the monitoring vessel. Additional information was compiled further for each record, including the start time, end time and scale (area extent). Provided such a monitoring framework, HABs with a scale greater than 0.5 km2 and a duration greater than 1 day could be recorded. In this research, HAB records in Qingdao waters from 1990 to 2009 were combined from different bulletins, including the "Bulletin of Marine Disasters of China" (SOA, 1991-2010), the "Bulletin of Marine Environmental Quality of China" (SOA, 1998-2010), the "Bulletin of Marine Environmental Quality of Shandong Province" (SOA, 2004-2010) and the "Bulletin of Marine Environmental Quality of Qingdao City" (SOA, 2002-2010).
In addition, the HAB data in this paper were collected from some reports issued by local monitoring frameworks. specifically, a local shipboard HAB monitoring program was implemented by the North China Sea Environment Monitoring Center (NCSEMC) for Qingdao waters from 2005-2008, focusing on the water quality variation of the area used for the Olympic sailing regatta in 2008. Therefore, the HAB information, including the start time, end time, location, scale (area extent), dominant species and its abundance, was documented in a daily report entitled the "Monitoring and warning report of HABs along the Qingdao coast" (NCSEMC, 2005-2008) for further evaluation of the HAB effects during July and August of those years. Such records were also accessible as a type of data source for this research. In addition, collective records were collaborated and evaluated with published data in previous literature on the HABs in Qingdao waters.
In terms of the environmental data, there were also different data accessed. Nutrient data were collected from the "Bulletin of Environmental Quality of Coastal Areas" issued by the Ministry of Environmental Protection of China (MEP, 2002-2008). Data on population and waste discharge of Qingdao were collected from the "Annuals of Qingdao (Qingdao Statistic Agency, 1989-2008). Furthermore, other literature on the environmental conditions of the Qingdao coast was referenced as a type of data source.
GIS tools were employed for HAB data management and spatial geography processing. HABs that occurred in the same year were presented in one layer, which was created according to the geographic coordinates of each HAB occurrence in that particular year, supplemented by individual information (e.g., location, scale) presented in a relevant attribute table for each fi le layer. Although the shape of a single HAB event was typically a polygon, a central point rather than a polygon was used to present each HAB occurrence, which presented both a challenge in terms of the shape irregularity description for the HAB occurrence and the convenience of point pattern analysis in GIS (Wang and Wu, 2009; Wu et al., 2013). In addition, a base-map of Qingdao waters was acquired from the ESRI website (http://www.esri.com). The Geographic Coordinate Systems-World Geodetic System of 1984 (GCS-WGS-1984) was employed as the projection for all layers; this system typically serves as a reference coordinate system for GPS and has been frequently used in global GIS maps. ArcMap version 9.3 (ESRI, Redlands, California) was applied to conduct the analysis.
2.3 Frequency analysisThe frequency of HAB occurrences was analyzed using kernel density estimation (KDE) tools in GIS. Independently proposed by Rosenblatt (1956) and Parzen (1962), KDE was originally a non-parametric statistic method to estimate the probability density function of a random variable. In GIS, KDE tools were employed to identify and map certain "hotspots" in the overlapped layer that combined multiple point coordinates of each layer, according to the principle that the "more frequently points occurred, a higher density appeared". In application, a kernel was represented initially as a circle by taking the value of a specific point in the layer and spreading it across a pre-defined area with a constant radius or bandwidth (Gatrell et al., 1996). Each point was then weighted by evaluating the distance between the center of the circle and each point-location. An occurrence near the center is highly weighted and vice versa (Spencer and Angeles, 2007). Consequently, the density of points would be estimated as the kernel moves across the layer. By adjusting the constant radius, a smoothed continuous field density map of the layer would be generated ultimately. According to this method, multiple layers of HAB occurrences were overlaid chronologically in this research, several values were tested; and a 62.44-m radius was ultimately chosen. In terms of the generated density map, the frequency was classified into 5 categories, according to Jenks natural breaks classification method (Jenks, 1967), indicating the frequency of HAB occurrences from low to high.
2.4 Spatial and temporal analysisNearest Neighbor Analysis (NNA) was executed in analyzing the spatial pattern of HABs during different periods. This method, which was proposed by Clark and Evan (1954), was designed to discriminate the spatial pattern of a set of points S in a metric space M, whether dispersed, random or clustered. Distances, to which Euclidean or Manhattan measurements were both optional, between the random point q (qϵM) and other points in set S were measured in pairs, thus an average nearest distance could be calculated. Given the ratio of the average nearest distance to the prospective nearest distance, a Nearest Neighbor Index (NNI) of set S could be calculated. As NNA followed the null hypothesis that points in set S were supposedly distributed randomly, a default value of 1 was set for the prospective nearest neighbor distance. While NNI exceeded 1, the points in set S were dispersed; conversely, they were clustered. In the GIS application, the NNA was executed using the average nearest neighbor function in the spatial statistic toolbox. Within this function, an additional Z statistical analysis was applied to further determine the points of the spatial pattern in set S. Provided with the results of such analysis, a positive Z score indicated a dispersed pattern and a negative Z score indicated a clustered pattern (Getis, 1964). The Z score was calculated as follows:
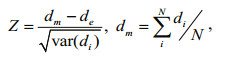
where dm denotes the average nearest neighbor distance, de denotes the prospective nearest neighbor distance, N denotes the number of points in set S, di denotes the nearest neighbor distance from a random point q, and var (di) denotes the variation of di.
In this research, set S was constituted by all HAB occurrences in Qingdao waters from 1990-2009, and a spatial boundary of NNA was established as the proposed study area. The analysis was executed in different periods. Furthermore, the variation of the distribution pattern of HAB occurrences in the target waters was further investigated using the visualized KDE results.
Additionally, to express an explicit description of the temporal variation of HAB occurrences in Qingdao waters and explore any possible pattern of such variation, temporal records of all occurrences were statistically analyzed. As a result, the duration and dominant season of HAB occurrences in JB and the OJB were illustrated and compared with each other. The inter-annual variations of HAB occurrences in 2 watersheds were also analyzed.
2.5 Evaluation of effectsWithin the scope of comprehensively evaluating the effects of each HAB event in Qingdao waters, a simple model was proposed according to the HAB’s risk assessment in ECS (Wang and Wu, 2009) and the HAB’s threat assessment in the Bohai Sea (Wu et al., 2013). As a result, the effects of the individual HAB occurrences were evaluated. The evaluation model is as follows:

where AH denotes the effects of each HAB occurrence. Within each specific HAB occurrence, T denotes the toxicity, C denotes the maximum density of the dominant species (cells/L), A denotes the scale of the area’s extent (km2), D denotes the duration (day), and L denotes the distance (km) between the central point and the coastline.
The effects of each HAB occurrence were assumed to be positively correlated with the toxicity and maximum density of the dominant species, the duration of the occurrence, and the scale of the affected area. The effects were also assumed to be negatively correlated with the distance off shore. In this research, T was assigned as 1 if the dominating species was toxic; otherwise, T was assigned as 0.5. A and D were recorded in the attached attribute table of each layer in GIS. L was measured using GIS tools. C was described as the log transformation of the original value. In case of any missing parameters, the default values of A and D were 1 km2 and 1 day, respectively, whereas the default value of C was distinctively assigned relevant to the size of the dominant species, according to Adachi’s HABs criterion (Adachi, 1973). After the AH value of each HAB occurrence was calculated, it was further classified into five categories from low to high, according to Jenks natural breaks classification method (Jenks, 1967).
3 RESULT AND DISCUSSION 3.1 Frequency of HAB occurrencesFrom 1990 to 2009, there were 35 HAB events recorded in Qingdao waters; 15 of those occurred in JB, whereas the other 20 occurred mostly in shallow bays in the OJB, particularly in Fushan Bay (Fig. 1). Considering that limited observations were conducted in the OJB before 2000, HAB occurrences in this area were difficult to identify during that time. Therefore, the current estimated frequency of HAB occurrences in the OJB during the entire period might be underestimated.
By using KDE analysis, each point representing a single HAB event in Fig. 1 was further combined to show the point density that indicated the frequency of the HAB occurrences in different watersheds (Fig. 2a). As a result, it was noted that the highest density was in the OJB; thus, HABs occurred most frequently in this area throughout the study interval. However, there were also 2 hotspots in the eastern section of JB, and the category of frequency in these 2 areas both approached a moderate high level.

|
| Figure 2 The frequency of HAB occurrences in Qingdao waters during different periods a. entire period; b. 1990s; c. around 2000; d. 2000s. |
However, in varied periods, the hotspots were in completely different locations. During the 1990s (1990-1998), five HAB events occurred in JB, and four out of these occurred in the northeastern corner of JB (Fig. 1). Therefore, this area experienced the most frequent HAB events in Qingdao waters during the 1990s (Fig. 2b). Around 2000 (1999-2002), the HAB occurrences in the northeastern corner were not as dense or frequently observed as they were during the 1990s. Instead, the HABs were frequently observed along the east coast of JB, at the mouth of JB and in Fushan Bay in the OJB (Fig. 2c). While approximately 60% of the HABs occurred during the 2000s (2003-2009), 75% of them were recorded in shallow bays in the OJB, particularly in Fushan Bay. Consequently, the HABs occurred most frequently in Fushan Bay and the adjacent waters in the OJB during the 2000s (Fig. 2d).
3.2 Spatial pattern of HABsAs further investigated by NNA, a strong clustered pattern for the spatial distribution of all HAB events in the entire period was revealed, with a NN index of 0.65, Z score of -4.02 SD (standard deviation), and a significant level at 0.01 (Table 1).
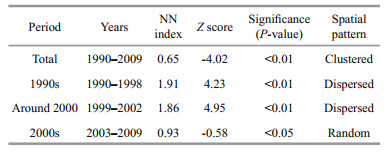
Such distribution patterns by NNA analysis coincided with the visualization of KDE in the same period (Fig. 2a). HABs were distributed and clustered in the eastern part of JB and the shallow bays in the OJB, particularly in Fushan Bay and its adjacent waters.
However, spatial patterns in different periods varied from each other. As shown in Table 1, the value of NNI during the "1990s" period and the "around 2000" period was greater than 1. Each period exhibited a similar dispersed distribution of HAB occurrences. The KDE results also showed the dispersed distribution of hotspots in Qingdao waters during these 2 periods. In the "1990s", the hotspot area was limited in scale, whereas there were still some HAB occurrences in other parts of the JB area and in some parts of the OJB (Fig. 2b). In the "around 2000"period, there were 3 hotspots with the same frequency category, located in 3 dispersed areas (Fig. 2c). However, a much clustered spatial distribution, or socalled "random" pattern, was exhibited in the "2000s" period, with a NNI of 0.93, Z score of -0.58 SD, and a signifi cance at the 0.05 level (Table. 1). Such random distribution was further described by the KDE in Fig. 2d, as a high level hotspot was distributed in Fushan Bay and its adjacent waters with an extraordinary expansion for its scale after 2002. The scale of such a hotspot could reach Tuandao Bay to the west and Shazikou Bay to the east, covering the majority of the OJB. The frequency category in other parts was much lower than in the hotspot area. As a result, the spatial pattern of the HAB occurrences in the "2000s" was random and it was much more clustered than in other periods (Fig. 2d). The OJB became the major area for HAB occurrences in Qingdao waters.
Identifying the spatial patterns of HAB occurrences is useful for improving HAB monitoring and management plans in coastal areas. China's coastline is extensive, and it is impossible to monitor all coastal areas. However, targeted monitoring of certain locations where HAB events are clustered in space and time is a cost effective way to optimize public resources. The results of this study showed that the OJB should be designated as a regular key monitoring area for HAB occurrences in addition to the traditional monitoring framework in JB.
3.3 Temporal characteristics of HABs 3.3.1 Duration of HAB occurrencesCompared with the HABs in JB, the duration of the HAB occurrences in the OJB often lasted for a shorter period in the study interval according to the topographic differences between these two watersheds. As shown in Fig. 3, the average duration of the HABs in the OJB was only 2.84 days, whereas the HABs averaged 4.73 days in JB. Furthermore, 42.11% of the records in the OJB lasted only for 1 day, whereas the percentage in JB was only 27.23%. There were several factors that may influence the formation and the declination of a HAB occurrence, including the topography, the hydrodynamic condition, the nutrient status, the dominant species type and so on. In case of the Qingdao waters, the topography and the hydrodynamic condition would be one of the factors influencing the HAB occurrences in JB and OJB. In the great part of the JB, there was little changes in the water depth (Fig. 1). The residual current was as low as 5cm/s below (Sun et al., 1994; Yan et al., 2001). The average water residence time could be more than 80 days (Zhao et al., 2002). As a result, the hydrodynamic condition of JB was relatively firm, that would benefit the gathering and proliferation of dominant species. In contrast to JB, the OJB was open to the Yellow Sea in the south with gradually increasing isobaths (Fig. 1). The residual current in the OJB was much faster than in the JB. As an example, the mean residual current in the Fushan Bay could reach 12 cm/s (Yuan et al., 2016), with a range from 5.34 cm/s to 19.13 cm/s due to a 30 hours continuous observation in Aug, 2007 (Yang et al., unpublished data). Such hydrodynamic has few advantages for gathering dominant species together and maintaining their proliferation.

|
| Figure 3 Duration of HABs in Qingdao waters between 1990 and 2009 |
During the study interval, the HAB occurrences in both JB and the OJB varied seasonally. Among all events, the summer time, from June to August, was the most frequent season for HAB occurrences in both of the watersheds, denoted by 27 out of 35 records in total. However, there was a difference for the monthly range of HAB occurrences in JB and the OJB (Fig. 4a). HABs in JB, which occurred most frequently in June and July, were observed in all seasons except for autumn (between October and December), whereas HABs in the OJB occurred solely in spring and summer, from April to September. 70% of the records were observed in July and August.

|
| Figure 4 Annual and inter-annual variation of HAB occurrences in Qingdao waters between 1990 and 2009 a. annual variation of HAB occurrences; b. inter-annual variation of HAB occurrences. |
Differing with JB, the topography of the OJB discouraged the presence of HABs. However, HAB occurrences in the OJB might be maintained by other suitable meteorological conditions, such as wind feather. According to the statistics from 1971 to 2007, the wind speed in Qingdao fluctuated throughout the entire year, with a peak in December and April and a minimum during the summer (Fig. 5a). Especially in August, the average wind speed would be as low as 4.5 m/s. Moreover, there was a strong correlation (R2=0.539, n=12, P < 0.005) between the monthly wind speed and the synchronous HAB frequency in the OJB. Provided a smooth wind speed, the proliferation of dominant species would be less disturbed in the shallow bays of the OJB than in the open water. Furthermore, the wind direction in the summer would also benefit HAB occurrences in the shallow bays of the OJB. According to its topography, these shallow bays are open to the Yellow Sea primarily in the south (Fig. 1). Southerly winds occurred with greater than 50% frequency on average, provided the wind rose of the low troposphere in August, based on 1981-2009 monitoring data (Fig. 5b, c). Therefore, such frequent southerly winds in the summer would benefit dominant species gathering together in coastal shallow bays.

|
| Figure 5 Wind feather in Qingdao a. monthly wind speed variation; b. wind rose of the low troposphere in Qingdao at 08:00 LST in August; c. wind rose of the low troposphere in Qingdao at 20:00 LST in August. Ray direction: wind direction; ray length: frequency of wind direction; calm wind frequency was 0.3 at 08:00 LST and 0.0 at 20:00 LST. Data on wind speed were collected from Ma et al., 2013; data on wind direction were collected from the dissertation of Wang, 2011. |
When considering the inter-annual variation, there was a remarkable increasing trend for annual HAB occurrences during the total period in both of the watersheds (Fig. 4b). Before 2000, only 10 HABs were recorded with a frequency as low as 0.91 events per year. The other 25 HABs both occurred after 2000, having a much higher frequency (2.78 events per year) compared with previous years. Nutrient shifts in Qingdao waters, including the amount of increasing and structure variation, are the main reasons of the increased frequency of HAB occurrences after 2000.
In separating the total records into different watersheds, the records of JB, which are denoted by the red bar, were found to have accounted for the majority of the records of the total area before 2000. However, the OJB accounted for the majority of the records after 2000 (Fig. 4b). During that period, 72% of the HAB events were recorded in the OJB with a combined scale greater than 750 km2, whereas only 7 HABs were recorded in JB with a combined 184.8 km2 in scale. The rapidly increasing HABs in the OJB became the root cause for the inter-annual development of HAB occurrences in Qingdao waters after 2000.
3.4 Dominant species shiftsDuring the study interval, 15 dominant species were documented in Qingdao waters, whereas there was no record of dominant species in the 3 records before 1997 (Table 2).
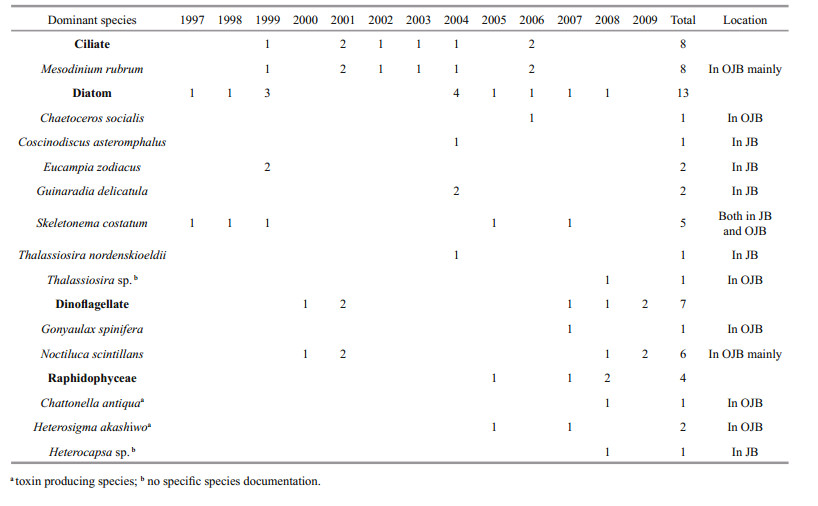
Among all species, Mesodinium rubrum was the most frequent dominant species. The HABs dominated by such species were reported globally, especially in low-turbulence enclosed bays, estuaries, and coastlines (Cloern et al., 1994; Villarino et al., 1995; Crawford et al., 1997; Herfort et al., 2011). In Qingdao waters, the species primarily bloomed in shallow bays of the OJB, such as Fushan Bay. Followed by Mesodinium rubrum, Skeletonema costatum and Noctiluca scintillans dominated the HABs that occurred in both JB and the OJB with equal frequency. The HABs dominated by Skeletonema costatum were believed to be extensively correlated with eutrophication (Borkman and Smayda, 2009). Additionally, Noctiluca scintillans also was connected to blooms along eutrophicated coasts and in estuaries (Cochin coast, Padmakumar et al., 2010; Changjiang river estuary, Xu, 2009). Therefore, the predominant species of HABs in Qingdao waters were typically neritic species that had an extensive connection with coastal eutrophication.
Considering the inter-annual variation of dominant species, there was diversity development throughout the entire period. From 1997 to 2000, HABs were primarily dominated by diatoms, especially Skeletonema costatum and Eucampia zodiacus. However, since dinoflagellate and ciliate species gradually dominated more HAB events than diatoms as more HAB occurrences were recorded in the OJB than there had been previously. As a result, HABs dominated by these 2 types of phytoplankton were recorded 15 times in total, and 13 of them occurred after 2000. Moreover, Raphidophyceae species also dominated several HAB events after 2001. Especially, 2 kinds of toxin-producing Raphidophyceae species, Chattonella antiqua (Haque and Onoue, 2002) and Heterosigma akashiwo (Bowers et al., 2006) dominated 3 events in the OJB in 2005 and 2007. These 2 species lead to many fish morality events worldwide (Tayler and Haigh, 1993; Lars-Johan et al., 2002; Rensel et al., 2010). As eutrophication linked to the pressures of increasing human activities in Qingdao waters was much intensified than before, the dominant species of the HABs in Qingdao waters has become very diversified since 2000.
3.5 effects of HABsAlthough each HAB occurrence posed its effects to coastal ecosystems, the severity or degree of the individual effects varied among the HAB event. To evaluate the extent of the effect of each HAB occurrence in the study interval, a simple model was built with consideration to scale, duration, distance off shore, maximum density and the toxin of the dominant species. Then, calculated results were visualized by overlapping the result of each occurrence together on a base-map of Qingdao waters in GIS. The results in different periods were aggregated separately, enabling a comparison of the effects of the HABs in varied periods and different watersheds, thus allowing a reasonable characterization of the effects of HABs in all Qingdao waters.
As a result, the effects with an AH level greater than the moderate category indicated serious negative effects distributed clustered in JB but randomly in the OJB throughout the entire period (Fig. 6a). While separating all records into 2 different periods (1999-2003 and 2004-2009), it was clearly indicated a much more impressive improvement of effects in the OJB when compared to that in JB (Fig. 6b, c). The highest AH level was present in the OJB for a Heterosigma akashiwo dominant HAB event in Shazikou Bay, with a scale of 70 km2 in 2007. Moreover, approximately all areas in the OJB were affected by HABs in the latter period. Although many HABs in Fushan Bay always occupied a low or moderate low level during this period, the aggregated effects of these extensive HAB occurrences in this limited area should not be omitted. Similarly, the affected area of the HABs in JB in the latter period was limited to the eastern part with restricted improvement compared to the previous period. Therefore, it could be illustrated that the OJB was much more significant when considering the effects of the HABs in Qingdao waters.

|
| Figure 6 Harmful assessment of HABs in Qingdao waters during different periods a: 1999-2009; b: 1999-2003; c: 2004-2009; each circle denotes the AH level of an individual HAB occurrence. |
To understand the effects of HABs is meaningful to controlling their occurrence in Qingdao waters. On the one hand, JB, which is believed in tradition to be the primary area affected by HABs in Qingdao, was limited in its effects compared with OJB in recent years. On the other hand, shallow bays in the OJB were supposed to attract more attention than it had previously, not only in terms of scientific interest but also in terms of economic and public consideration. This watershed, which was used as the yacht racing area for the Olympic sailing regatta in 2008, the annual international sailing regatta, and other related games since 2007, attracted extensive public attention regarding its water quality and potential ecological disaster in recent years. Therefore, a long-term comprehensive monitoring framework for HABs should be constructed in this area. Furthermore, emergency mitigation methods should be prepared for HABs that frequently occur. Additionally, the results of this research would also support the optimization of such a framework, thus improving the development of HAB mitigation strategies.
3.6 Relationship between HAB occurrences and nutrient shifts in the OJBGenerally speaking, enriched nutrients are considered to be the root cause of HAB occurrences (Anderson et al., 2008). Linkages between HAB occurrences and anthropogenic nutrient enrichment has been proven in very different global waters, not only in enclosed or semi-enclosed bays and harbors (Tango et al., 2005; Brand and Compton, 2007; Xu et al., 2011) but also in estuaries and open waters, such as Changjiang River estuary (Chai et al., 2006), the Mississippi River estuary (Rabalais et al., 1996) and the Black Sea (Bodeanu and Ruta, 1998).
In Qingdao waters, there was an obvious increasing trend in the DIN and DIP concentration in more recent decades (Fig. 7a). Provided data from the 2000s, the DIN was 22.46 μmol/L on average, over 3-fold greater than the previous records from the 1980s. Furthermore, the DIP in the 2000s was 0.79 μmol/L, 1.6-fold greater than the previous records from the 1980s. Rapidly increasing nutrients are the primary cause for the increasing HAB occurrences in Qingdao waters. Especially in recent years, the nutrients in the OJB increased much more rapidly than average (Fig. 7b). In 2001, the DIN in the OJB was only 10.35 μmol/L, which was close to its level in all Qingdao waters during the 1990s. Moreover, the DIP in the OJB was 0.26 μmol/L, which was close to the average value in the entire area during the 1960s. However, after a 7-year increase, the DIN was 26.50 μmol/L and the DIP was 0.66 μmol/L, as both approached the average value for all Qingdao waters during the 2000s. Such excessive nutrient input in recent years is the primary reason for the impressive increase in HAB occurrences in the OJB after 2000.

|
| Figure 7 Nutrient concentrations (μmol/L) of Qingdao waters in different periods and synchronous anthropogenic dynamics a. nutrients in JB+OJB from the 1960s to 2000s; b. nutrients in the OJB from 2001 to 2007; c. deposit wastewater and population variation in Qingdao from 1985 to 2007. The data of nutrients were collected from the dissertation of Li, 2010. |
Additionally, different species could proliferate and became dominant while the nutrient structure shifted. In the OJB, the nutrient structure also changed dramatically after 2001. When comparing the annual N/P ratio (DIN/DIP) variation in the OJB during the 2000s (2001-2007) with the contemporaneous average N/P ratio in Qingdao waters, the former ratio 39.81 to 82.79 and averaging 51.51 (Fig. 7a, b). As a result, the potential P limitation became much more serious in the OJB than in the entire area. Moreover, such an anomaly between the DIN and DIP in the OJB was highly related with human activity development. Anthropogenic discharge induced a nutrient structure variation that was much more effective on dominant species succession than flux shift (Glibert et al., 2006), thus inducing the domination and proliferation of different species (Scholz and Liebezeit, 2012). In the OJB, the discharge of deposit wastewater increased dramatically from 146.63×10⁶ ton/year in 1988 to 316.13×10⁶ ton/year in 2007, caused by the population growth in Qingdao during the same period (Fig. 7c). According to the correlation analysis of the data from 2001 to 2007, DIN enrichment in the OJB proved to be highly correlated with increasing population (R2=0.919, n=7, P < 0.005) and wastewater discharge (R2=0.775, n=7, P < 0.005). Provided with N-rich wastewater discharge, the N/P ratio in the OJB deviated extremely from the Redfield ratio. Therefore, the discharge of nutrients, especially anthropogenicinduced nitrogen increased dramatically in the OJB after 2000, and, consequently, the N/P ratio shifted far from the normal level. As a result of the changes in the nutrient amounts and structure, HABs occurred more frequently in the OJB after 2000 than they did before. The effects of the HABs in the OJB have become increasingly more significant in recent years.
4 CONCLUSIONIn this research, an analysis on HAB occurrences in Qingdao waters from 1990 to 2009 were approached by using GIS technology and statistical methods. It revealed that there’re two districts with higher frequency of HAB occurrences and clustered spatial distribution during the study interval. One of them is the northeast corner of the JB, and the other one is Fushan bay and the adjacent waters in the OJB. In particular, the HABs occurred much more frequently and more clustered in Fushan Bay and the adjacent waters in the OJB than in the JB since 2000. Temporally speaking, there was a remarkably increasing trend for HAB occurrences in Qingdao waters after 2000, and major of them occurred in the OJB. Meanwhile, the HAB occurrences showed distinguishable duration and seasonality between in the JB and the OJB. Additionally, the dominant species of the HABs in Qingdao waters has become much diversified since 2000. In particular, much dinoflagellate, ciliate, and some toxic Raphidophyceae species dominated HABs in the OJB after 2000. As a result of evaluating the effects of the HAB occurrences, it was clearly indicated a much more impressive improvement of side effects in the OJB when compared to that in JB since 2000. Moreover, rapidly enriched nitrogen caused by anthropogenic activities and a subsequent potential P-limitation in the OJB were believed essential for improving HAB occurrences in this area after 2000. Therefore, a long-term comprehensive monitoring framework for HABs should be developed in this area.
In the field of identifying the temporal and spatial characteristics of HABs in coastal area, GIS technology and statistical methods are promising tools, as they could approach visualizable description of the scale, distribution, and characteristics of each individual HAB occurrence in the target area. Therefore, they could provide useful information to support the optimization of HABs monitoring framework, thus improving the development of HAB mitigation strategies.
5 ACKNOWLEDGEMENTWe are appreciative of the monitoring data support by the NCSEMC and Mrs. Xiaotian HAN’s suggestion on dominating species taxonomy.
| Adachi R, 1973. Red tide organisms and red tide. Fisheries Engineering, 9: 31–36. |
| Anderson D M, Burkholder J M, Cochlan W P, Glibert P M, Gobler C J, Heil C A, Kudela R M, Parsons M L, Jack Rensel J E, Townsend D W, Trainer V L, Vargo G A, 2008. Harmful algal blooms and eutrophication:examining linkages from selected coastal regions of the United States. Harmful Algae, 8(1): 39–53. Doi: 10.1016/j.hal.2008.08.017 |
| Bodeanu N, Ruta G. 1998. Development of the planktonic algae in the Romanian Black Sea sector in 1981-1996. In:Reguera B, Blanco J, Fernandez M, Wyatt T eds. Harmful Algae. Proceedings of the 8th International Conference on Harmful Algae. Xunta de Galicia and I.O.C., Vigo, Spain.p.188-191. |
| Borkman D G, Smayda T J, 2009. Gulf Stream position and winter NAO as drivers of long-term variations in the bloom phenology of the diatom Skeletonema costatum"species-complex" in Narragansett Bay, RI, USA. Journal of Plankton Research, 31(11): 1407–1425. Doi: 10.1093/plankt/fbp072 |
| Bowers H A, Tomas C, Tengs T, Kempton J W, Lewitus A J, Oldach D W, 2006. Raphidophyceae. Journal of Phycology, 42(6): 1333–1348. Doi: 10.1111/jpy.2006.42.issue-6 |
| Brand L E, Compton A, 2007. Long-term increase in Karenia brevis abundance along the Southwest Florida Coast. Harmful Algae, 6(2): 232–252. Doi: 10.1016/j.hal.2006.08.005 |
| Chai C, Yu Z M, Song X X, Cao X H, 2006. The status and characteristics of eutrophication in the Yangtze River (Changjiang) estuary and the adjacent East China Sea, China. Hydrobiologia, 563(1): 313–328. Doi: 10.1007/s10750-006-0021-7 |
| Clark P J, Evans F C, 1954. Distance to nearest neighbor as a measure of spatial relationships in populations. Ecology, 35(4): 445–453. Doi: 10.2307/1931034 |
| Cloern J E, Cole B E, Hager S W, 1994. Notes on a Mesodinium rubrum red tide in San Francisco Bay (California, USA). Journal of Plankton Research, 16(9): 1269–1276. Doi: 10.1093/plankt/16.9.1269 |
| Crawford D W, Purdie D A, Lockwood A P M, Weissman P, 1997. Recurrent Red-tides in the southampton water estuary caused by the phototrophic ciliate Mesodinium rubrum. Estuarine, Coastal and Shelf Science, 45(6): 799–812. Doi: 10.1006/ecss.1997.0242 |
| Dai J C, Song J M, Li X G, Yuan H M, Li N, Zheng G X, 2007. Environmental changes reflected by sedimentary geochemistry in recent hundred years of Jiaozhou Bay, North China. Environmental Pollution, 145(3): 656–667. Doi: 10.1016/j.envpol.2006.10.005 |
| Gatrell A C, Bailey T C, Diggle P J, Rowlingson B S, 1996. Spatial point pattern analysis and its application in geographical epidemiology. Transactions of the Institute of British Geographers, 21(1): 256–274. Doi: 10.2307/622936 |
| Getis A, 1964. Temporal land-use pattern analysis with the use of nearest neighbor and quadrat methods. Annals of the Association of American Geographers, 54(3): 391–399. Doi: 10.1111/j.1467-8306.1964.tb00497.x |
| Glibert P M, Burkholder J M. 2006. The complex relationships between increases in fertilization of the earth, coastal eutrophication and proliferation of harmful algal blooms.In:Granéli E, Turner J T eds. Ecology of Harmful Algae.Springer, Berlin Heidelberg. p.341-354. |
| Hallegraeff G M, 1993. A review of harmful algal blooms and their apparent global increase. Phycologia, 32(2): 79–99. Doi: 10.2216/i0031-8884-32-2-79.1 |
| Han H Y, Li K Q, Wang X L, Shi X Y, Qiao X D, Liu J, 2011. Environmental capacity of nitrogen and phosphorus pollutions in Jiaozhou Bay, China:modeling and assessing. Marine Pollution Bulletin, 63(5-12): 262–266. Doi: 10.1016/j.marpolbul.2010.12.017 |
| Haque S M, Onoue Y, 2002. Variation in toxin compositions of two harmful raphidophytes, Chattonella antiqua and Chattonella marina, at different salinities. Environmental Toxicology, 17(2): 113–118. Doi: 10.1002/(ISSN)1522-7278 |
| Herfort L, Peterson T D, Campbell V, Futrell S, Zuber P, 2011. Myrionecta rubra (Mesodinium rubrum) bloom initiation in the Columbia River estuary. Estuarine, Coastal and Shelf Science, 95(4): 440–446. Doi: 10.1016/j.ecss.2011.10.015 |
| Huo W Y, Yu Z M, Zou J Z, Han X T, 2001. Analysis of dynamic process and the causes of Eucampia zoodiacus red tide in Jiaozhou Bay. Journal of Fisheries of China, 25(3): 222–226. |
| Jenks G F, 1967. The data model concept in statistical mapping. International Yearbook of Cartography, 7: 186–190. |
| Lai P C, Wong C M, Hedley A J, Lo S V, Leung P Y, Kong J, Leung G M, 2004. Understanding the spatial clustering of Severe Acute Respiratory Syndrome (SARS) in Hong Kong. Environmental Health Perspectives, 112(15): 1550–1556. Doi: 10.1289/ehp.7117 |
| Lars-Johan N, Einar D, Didrik D, 2002. A new bloom of Chattonella in Norwegian waters. Harmful Algae News, 23: 3–5. |
| Li Y H. 2010. The Study of Jiaozhou Bay Ecosystem Dynamic Change. Institute of Oceanology, Chinese Academy of Sciences, Qingdao. p.1-104. (in Chinese) |
| Liu D Y, Sun J, Zhang J, Liu G S, 2008. Response of the diatom flora in Jiaozhou Bay, China to environmental changes during the last century. Marine Micropaleontology, 66(3-4): 279–290. Doi: 10.1016/j.marmicro.2007.10.007 |
| Liu D Y, Sun J, Zou J Z, Zhang J, 2005a. Phytoplankton succession during a red tide of Skeletonema costatum in Jiaozhou Bay of China. Marine Pollution Bulletin, 50(1): 91–94. Doi: 10.1016/j.marpolbul.2004.11.016 |
| Liu S M, Zhang J, Chen H T, Zhang G S, 2005b. Factors influencing nutrient dynamics in the eutrophic Jiaozhou Bay, North China. Progress in Oceanography, 66(1): 66–85. Doi: 10.1016/j.pocean.2005.03.009 |
| Liu S M, Zhu B D, Zhang J, Wu Y, Liu G S, Deng B, Zhao M X, Liu G Q, Du J Z, Ren J L, Zhang G L, 2010. Environmental change in Jiaozhou Bay recorded by nutrient components in sediments. Marine Pollution Bulletin, 60(9): 1597–1599. |
| Lu M, Zhang L J, Li C, Zou L, Zhang J, 2001. Analysis of the ecological environment elements in the red tide generating and vanishing process in the eastern Jiaozhou Bay in July, 1999. Journal of Oceanography of Huanghai & Bohai Seas, 19(4): 43–50. |
| Ma Y, Gao R Z, Xue Y C, Yang Y Q, Wang X Y, Liu B, Xu X L, Liu X Z, Hou J W, Lin H, 2013. Weather support for the 2008 Olympic and paralympic sailing events. Advances in Meteorology, 2013: 289284. |
| MEP. 2002-2008. Bulletin of environmental quality of coastal area (2001-2007). The Ministry of Environmental Protection, Beijing. (in Chinese) |
| NCSEMC. 2005-2008. Monitoring and warning report of HAB events in coatal waters of Qingdao (2005-2008).NCSEMC, Qingdao. (in Chinese) |
| Oguchi T, Jarvie H P, Neal C, 2000. River water quality in the Humber catchment:an introduction using GIS-based mapping and analysis. Science of the Total Environment, 251-252: 9–26. Doi: 10.1016/S0048-9697(00)00411-3 |
| Padmakumar K B, SreeRenjima G, Fanimol C L, Menon N R, Sanjeevan V N, 2010. Preponderance of heterotrophic Noctiluca scintillans during a multi-species diatom bloom along the southwest coast of India. International Journal of Oceans and Oceanography, 4(1): 55–63. |
| Parzen E, 1962. On estimation of a probability density function and mode. Annals of Mathematical Statistics, 33(3): 1065–1076. Doi: 10.1214/aoms/1177704472 |
| Qingdao Statistic Agency. 1989-2008. Annual of Qingdao (1988-2007). The Qingdao Statistic Agency, Qingdao. (in Chinese) |
| Rabalais N N, Turner R E, Justić D, Dortch Q, Wiseman W J, Sen Gupta B K, 1996. Nutrient changes in the Mississippi River and system responses on the adjacent continental shelf. Estuaries, 19(2): 386–407. Doi: 10.2307/1352458 |
| Rensel J E J, Haigh N, Tynan T J, 2010. Fraser river sockeye salmon marine survival decline and harmful blooms of Heterosigma akashiwo. Harmful Algae, 10(1): 98–115. Doi: 10.1016/j.hal.2010.07.005 |
| Rosenblatt M, 1956. Remarks on some nonparametric estimates of a density function. The Annals of Mathematical Statistics, 27(3): 832–837. Doi: 10.1214/aoms/1177728190 |
| Scholz B, Liebezeit G, 2012. Screening for competition effects and allelochemicals in benthic marine diatoms and cyanobacteria isolated from an intertidal flat (southern North Sea). Phycologia, 51(4): 432–450. Doi: 10.2216/11-80.1 |
| Shen Z L, Liu Q, Wu Y L, Yao Y, 2006. Nutrient structure of seawater and ecological responses in Jiaozhou Bay, China. Estuarine, Coastal and Shelf Science, 69(1-2): 299–307. Doi: 10.1016/j.ecss.2006.04.014 |
| Shen Z L, 2001. Historical changes in nutrient structure and its influences on phytoplantkon composition in Jiaozhou Bay. Estuarine, Coastal and Shelf Science, 52(2): 211–224. Doi: 10.1006/ecss.2000.0736 |
| Shi X Y, Chen L L, Zhu C J, Wang X L, 2007. Preliminary discussion on the sea water quality status in the 2008 Olympic boat-sailing field and adjacent area. Marine Science Bulletin, 9(2): 90–96. |
| SOA. 1991-2010. Bulletin of marine disaster of China (1990-2009). SOA, Beijing. (in Chinese) |
| SOA. 1998-2010. Bulletin of marine environmental Quality of China (1997-2009). SOA, Beijing. (in Chinese) |
| SOA. 2002-2010. Bulletin of marine environmental quality of Qingdao City (2001-2009). SOA, Beijing. (in Chinese) |
| SOA. 2004-2010. Bulletin of marine environmental quality of Shandong Province (2003-2009). SOA, Beijing. (in Chinese) |
| SOA. 2005. HY/T069-2005 Technical specification for red tide minitoring. Standards Press of China, Beijing. (in Chinese) |
| Spencer J, Angeles G, 2007. Kernel density estimation as a technique for assessing availability of health services in Nicaragua. Health Services and Outcomes Research Methodology, 7(3-4): 145–157. Doi: 10.1007/s10742-007-0022-7 |
| Sun Y L, Sun C Q, Wang X C, Tian H, Chen S J, 1994. Forecast of impact of Qingdao bay bridge on tide, tidal current and residual current of Jiaozhou Bay I. Tidal current of Jiaozhou Bay and adjacent sea area. Journal of Ocean University of Qingdao(S1): 105–119. |
| Tango P J, Magnien R, Butler W, Luckett C, Luckenbach M, Lacouture R, Poukish C, 2005. Impacts and potential effects due to Prorocentrum minimum blooms in Chesapeake Bay. Harmful Algae, 4(3): 525–531. Doi: 10.1016/j.hal.2004.08.014 |
| Taylor F J R, Haigh R. 1993. The ecology of fish-killing blooms of the chloromonad flagellate Heterosigma akashiwo in the strait of georgia and adjacent waters. In:Smayda T J, Shimizu Y eds. Toxic Phytoplankton Blooms in the Sea. Elsevier, Amsterdam. p.705-771. |
| Villarino M L, Figueiras F G, Jones K J, Alvarez-Salgado X A, Richard J, Edwards A, 1995. Evidence of in situ diel vertical migration of a red-tide microplankton species in Ría de Vigo (NW Spain). Marine Biology, 123(3): 607–617. Doi: 10.1007/BF00349239 |
| Wang J H, Wu J Y, 2009. Occurrence and potential risks of harmful algal blooms in the East China Sea. Science of the Total Environment, 407(13): 4012–4021. Doi: 10.1016/j.scitotenv.2009.02.040 |
| Wu Z X, Yu Z M, Song X X, Yuan Y Q, Cao X H, Liang Y B, 2013. The spatial and temporal characteristics of harmful algal blooms in the southwest Bohai Sea. Continental Shelf Research, 59: 10–17. Doi: 10.1016/j.csr.2013.03.014 |
| Xu J, Lee J H W, Yin K D, Liu H B, Harrison P J, 2011. Environmental response to sewage treatment strategies:Hong Kong's experience in long term water quality monitoring. Marine Pollution Bulletin, 62(11): 2275–2287. Doi: 10.1016/j.marpolbul.2011.07.020 |
| Xu Y D, Lou A G, Tan H T, Long S Q, Shi X Y, 2006. Environment capacity predicted in the Olympic sailing games' district. Marine Sciences, 30(2): 38–42. |
| Xu Z L, 2009. The inter-annual variations in Noctiluca scintillans abundance and eutrophication in Changjiang Estuary. Oceanologia et Limnologia Sinica, 40(6): 793–798. |
| Yan J, Wang H, Bao X W, 2001. The simulation of 3D tidal and residual current in the Jiaozhou Bay. Advance in Earth Sciences, 16(2): 172–177. |
| Yao P, Yu Z G, Deng C M, Liu S X, Zhen Y, 2010. Spatialtemporal distribution of phytoplankton pigments in relation to nutrient status in Jiaozhou Bay, China. Estuarine, Coastal and Shelf Science, 89(3): 234–244. Doi: 10.1016/j.ecss.2010.07.003 |
| Yuan Y, Song D H, Wu W, Liang S K, Wang Y, Ren Z P. 2016.The impact of anthropogenic activities on marine environment in Jiaozhou Bay, Qingdao, China:a review and a case study. Regional Studies in Marine Science, http://dx.doi.org/10.1016/j.rsma.2016.01.004. |
| Zhang M, Rasiah R, 2013. Qingdao. Cities, 31: 591–600. Doi: 10.1016/j.cities.2012.06.021 |
| Zhang Y S, Wu Y L, Zou J Z, Yu Z M, Pu X M, 2002. A red tide caused by diatom Eucampia zoodiacus in the Jiaozhou Bay. Oceanologia et Limnologia Sinica, 33(1): 55–61. |
| Zhao L, Wei H, Zhao J Z, 2002. Numerical study on water exchange in Jiaozhou bay. Oceanologia et Limnologia Sinica, 33(1): 23–29. |