 2017, Vol. 35
Institute of Oceanology, Chinese Academy of Sciences
Article Information
- ZUO Xiuling(左秀玲), SU Fenzhen(苏奋振), ZHAO Huanting(赵焕庭), ZHANG Junjue(张君珏), WANG Qi(王琦), WU Di(吴迪)
- Regional hard coral distribution within geomorphic and reef flat ecological zones determined by satellite imagery of the Xisha Islands, South China Sea
- Chinese Journal of Oceanology and Limnology, 35(3): 501-514
- http://dx.doi.org/10.1007/s00343-017-5336-x
Article History
- Received Nov. 20, 2015
- accepted in principle Apr. 17, 2016


2 Collaborative Innovation Center of South China Sea Studies, Nanjing 210093, China;
3 University of Chinese Academy of Sciences, Beijing 100049, China;
4 Key Laboratory of Marginal Sea Geology, South China Sea Institute of Oceanology, Chinese Academy of Sciences, Guangzhou 510301, China;
5 Key Laboratory of Hydrography and Cartography of PLA, Department of Hydrography and Cartography, Dalian Naval Academy, Dalian 116018, China
Coral reefs contribute essential ecosystem services to millions of people in coastal areas worldwide (Moberg and Folke, 1999). However, coral cover and species diversity on coral reefs have experienced dramatic recent declines all over the world, owing to factors that include climate change and numerous other anthropogenic stressors (McWilliams et al., 2005; Lapointe et al., 2011; Hughes et al., 2012; Coles et al., 2015). A better understanding of coral distribution is needed for coral reef assessment and management in the context of global warming and ocean acidification.
Coral communities are widely distributed and dispersed over large distances of thousands of kilometers (Jokiel, 1984), yet biotic interactions, divergence from predominant regional species and variations following disturbances also occur upon local scales (1–10 km) (Connell et al., 1997; Karlson and Cornell, 1998; Cornell and Harrison, 2013; Evensen et al., 2015; Morri et al., 2015). As different physical and biological processes dominate at different scales, small-scale field studies or local experiments provide limited insights into regional (10–1 000 km) or global phenomena. Abundant information on variability within coral communities provides evidence for a high degree of spatial dynamics in community structure. However, coral comminities show much less variability and more predictability when examnied at >1 km scale (Hughes et al., 1999). Moreover, the predictability of coral distribution on a regional, rather than a local, scale is more applicable for regional reef ecosystems management.
Remote sensing is a tool that has great potential for monitoring and quantifying coral reef community structure and distribution over large areas. This technology has been demonstrated to be more costeffective than fieldwork and regular monitoring can be conducted using satellite sensors. Advances in coral reef remote sensing have enabled the mapping of coral reef geomorphic zones (Smith et al., 1975; Andréfouët and Guzman, 2005; Leon and Woodroffe, 2011) and benthic communities (Kobryn et al., 2013; Leiper et al., 2014; Velloth et al., 2014). Generally, geomorphic maps can be derived from moderateresolution images, such as Landsat TM. Highresolution images, such as IKONOS, Quickbird and hyper-spectral data, are required for mapping coral reef environments at benthic community scales. However, on their own, these do not enable accurate classification of benthos and substrate types (e.g., live coral, dead coral covered with turf algae, or macroalgae) even at a sub-meter scale, owing to the high degree of spatial heterogeneity of coral reef environments (Kobryn et al., 2013; Zapata-Ramírez et al., 2013; Leiper et al., 2014; Velloth et al., 2014). The coral composition and condition ascertained from field studies and/or high-resolution images within specific geomorphic zones can reflect the onsite ecological processes and exogenous disturbances (Stoddart, 1969) and is most commonly used by reef scientists and managers (Syms and Kingsford, 2008; Dalleau et al., 2009; Phinn et al., 2012).
The Xisha Islands (also known as the Paracel Islands in English) are located in the northern part of the South China Sea (SCS), and are one of four offshore archipelagoes in the SCS. The archipelago comprises ~36 atolls, and the recorded scleractinian corals number between 23 and 127 species and subspecies within 37–38 genera (Morton and Blackmore, 2001). These reefs support the livelihoods of large numbers of people, providing fisheries, coastal protection, and important ecological values.
Coral cover in this area was reported to be high (>70%) before 1984 (Li et al., 2008; Wu et al., 2011), and was still 50%–70% in 2005–2006 (Huang et al., 2011; Wu et al., 2011; Hughes et al., 2012). However, by 2009, live coral cover was reported to be < 10% following an outbreak of crown-of-thorns starfish, coral disease, overfishing, destructive fishing, and other disturbances in 2007–2008 (Huang et al., 2011; Wu et al., 2011). Until now, a small number of field studies focused on coral distribution solely within the geomorphic zones of Yongxing Island, the largest of the Xisha Islands (Shi et al., 2011; Shen et al., 2013). However, the regional scale general pattern of hard coral within geomorphic zones of Xisha Islands for management of these reefs is not well understood.
The objective of this study was to conduct a broadscale census of the hard coral communities within the detailed geomorphic zones and some ecological zones as quantified from moderate-resolution satellite images of the Xisha Islands. Live coral diversity, evenness and reef health (live versus dead coral cover) were examined to: 1) generate insights into the predictability of hard coral distribution in the Xisha Islands from broad-scale geomorphic and ecological mapping to guide regional management; and 2) identify the prevalent physical and biological processes affecting hard coral distribution at a regional scale.
2 DATA AND METHOD 2.1 Study areaThe Xisha Islands are located at 15°46′–17°08′N and 111°11′–112°47′E (Fig. 1), 260 km southeast of the Hainan Island. Their sea area is 170 km along the E–W axis and 150 km along the N–S axis. Emergent islands and reefs include complex atolls, simple atolls and table reefs. Deep reefs are also present. According to observations from the Yongxing Island meteorological station, the annual average air temperature of the Xisha Islands region is 26.4℃ and annual rainfall is ~1 500 mm. Northeasterly winds prevail from October to March, whereas southwesterly winds dominate from May to August. April and September are the conversion months of the monsoon, with a variety of wind directions. As such, the wet season in this area ranges from June to November and the precipitation during this period accounts for ~87% of the total annual precipitation. The dry season is from December to May, with 13% of the total annual precipitation in these months (Xu et al., 2010). As the Xisha Islands are offshore, the seawater surrounding them is generally not influenced by the terrestrial processes or river plumes. The monthly mean salinity of the surface seawater is between 33.3 and 34.0 (Nie et al., 1997).

|
| Figure 1 Map of the Xisha Islands reef areas and the GF-1 true-color images derived on 30 May, 2014 showing reef surveys in June, 2014 Images were collected of Yuzhuo Reef (c), Panshi Islet (d), Huaguang Reef (e), Lingyang Reef (f), Ganquan Island (g), Quanfu Island (h), Yin Islet (i), Qilian Islet (j): the westernmost cay is Xi Cay and the island east of Xi Cay is Zhaoshu Island. Satellite images were overlaid with field survey video-transect sites (yellow dots). |
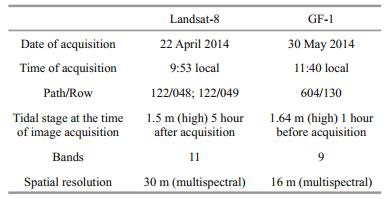
Satellite multispectral moderate spatial resolution image data, including two Landsat-8 images and one Chinese GF-1 image, were acquired for the study area as close as possible to the time of the field surveys. Table 1 presents details for each type of image data, along with the acquisition date, acquisition time in relation to tidal heights, and spatial resolution. Two Landsat-8 images of good quality (presence of clouds on few reefs) acquired 22 April 2014 were used for the field survey conducted in June 2014. To produce the final geomorphic and ecological map of Xisha Islands, a GF-1 image acquired 30 May 2014 of 16 m resolution was also examined. This image was obtained from the China Centre for Resources Satellite Data and Application (CRESDA) archive. It is equipped with two 2 m resolution panchromatic/8 m resolution multispectral cameras (P/MS), and four 16 m resolution multispectral cameras (WFV). At the time of study, only one image with 16 m resolution matching the survey time was available. It covered with excellent quality reefs that were not optimal on the Landsat-8 images.
For radiometric corrections, ENVI ver. 5.1 software was used to convert the digital values to at-sensor radiance according to the gain and offset values obtained from the Landsat-8 and GF-1 images data. The two images of Landsat-8 data were registered to each other adopting a first-order polynomial and nearest-neighbor re-sampling to preserve pixel values. Each band in the two Landat-8 images was normalized using an empirical line calibration approach of the pseudo-invariant features (sand and deep water) (Joyce et al., 2004). Overlap between the Landsat-8 and GF-1 data allowed for the correct geo-referencing of the GF-1 image.
2.3 Field data collection and coral community parametersLine transects at 54 sites on nine reefs (Fig. 1), were conducted by scuba from 1 to 7 June 2014. We surveyed different sites of interest selected from the Landsat-8 images. Sites were selected that represented the highest diversity in spectral characteristics (as a result of bottom types and depth variations) of different zones (Roelfsema and Phinn, 2010). For each transect, a 20 m tape measure was laid out perpendicular to the coastline and a snorkeler or diver swam over the bottom while taking videos of the benthos at a set height. Camera height above the substrate was set according to the water clarity and ranged from 0.5 to 1.5 m. Each observation was georeferenced using a small boat and a hand-held GPS (1 m precision) to record the start and end locations of each transect.
Benthic community structure was then quantitatively assessed. Digital video was converted to still frames and archived as JPEGs. Nonoverlapping images were selected for point counting, which was carried out using CPCe software to determine cover, composition and abundance. Each frame was assigned 10 randomly chosen coordinate points (Pante, 2005). Community structure lying underneath the line transect was classified using percentages of live hard coral, bleached coral, dead coral (with algae, with black disease), coral skeletal fragments, rock, sand, macroalgae and seagrass. To determine the community structure, hard corals were distinguished morphologically and taxonomically to genus and species levels (Veron, 2000).
Species or genus diversity were computed from the Shannon-Wiener index, according to Magurran (1988) for species and Done et al. (2010) for genus. This, along with the evenness of hard coral cover, calculated from the Pielou evenness for species (Magurran, 1988) and the Shannon evenness for genus (Done et al., 2010), was used to assess the diversity and spatial distribution of hard corals on the reef.
2.4 Satellite images mappingThe reef map was producted using three hierarchical levels of reef composition: (1) reef; (2) geomorphic zone; and (3) reef flat ecological zone (benthic community), as per the hierarchical scales of reefmapping categories for three western Pacific coral reefs (Phinn et al., 2012). A total of 11 intra-reef classes were defined based on the observed morphological units in the images across the study area. Descriptions for each class (Leon and Woodroffe, 2011) are presented in Table 2. The coarsest classes were emergent reef and deep reef based on the status at low tide. Eight coarse classes were based solely on geomorphology, whereas two finer reef flat classes incorporated substrate information. These geomorphic zones for hard coral were chosen as they exert a combined influence on the spectral information recorded by a remote sensing sensor, and can be identified realistically within a moderate-resolution remote sensing image. Ecological zones are assemblages of frequently co-occurring benthic communities such as coral, algae, rock, rubble and sand, and can be mapped by high-spatial-resolution multispectral images (Phinn et al., 2012). The spectral differences on the reef flat were significant in our moderate-resolution images. Dark areas of a reef were usually regarded as corals, dense algae or seagrass, while bright areas may be sand or clouds (Phinn et al., 2012). This enabled classification of ecological zones on the reef flat, based on brightness. After analyzing the benthic habitats, the bright areas of reef flat were referred to as the biotic sparse zone of reef flat with the dark areas of reef flat being the biotic dense zone of reef flat.
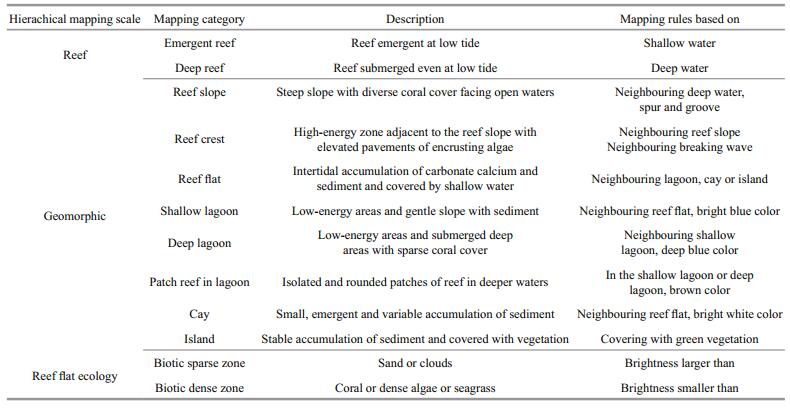
As our study area was not large, the geomorphic and ecological map was produced using a manual expert-driven segmentation. To obtain the best interpretation, the band combination of red, green, and blue was adopted as this enabled better spectral characterization of the classes. Membership rule sets developed for this moderate-resolution images (Table 2) were derived from our expert knowledge, field experience and understanding of geomorphology of coral reefs. As geomorphic zones are not fast changing, visual interpretation was conducted to confirm the classification of geomorphic zones by inspecting high-resolution images acquired 2013– 2015 available in Google Earth. The green band was chosen to segment the reef flat into a biotic sparse zone and a biotic dense zone, and the brightness threshold was set to 0.149 in Landsat-8 owing to the larger variance of reflectance values compared with other bands. The threshold of GF-1 green band was set by choosing points on the reef flat ecological zones of Landsat-8. The accuracy of reef zones was assessed with respect to topological rules between classes. These topological rules were inherent to the description of each geomorphic class. For instance, a "lagoon" is necessarily surrounded almost entirely by a "reef flat". A "reef slope" is necessarily connected to the deep water, a "reef crest" or a "reef flat". Consistency in topological rules was also based on manual verification of the classes as topological inconsistency can be detected by a human observer immediately (Suzuki et al., 2001). An accurate map depends upon its geomorphic classes being topologically correct.
2.5 Statistic and descriptive analysisBenthic sampling transects were located on the map. The geomorphic and reef flat ecological context of each sampling site was characterized at the geomorphic and reef flat ecological zones (e.g., reef slope, shallow lagoon). Independent-sample t tests were applied to test the difference of mean hard coral cover, diversity and evenness between different geomorphic zones and reef flat ecological zones. We analyzed the ecological relationships (low, moderate or high) between hard coral cover, and diversity and evenness of cover.
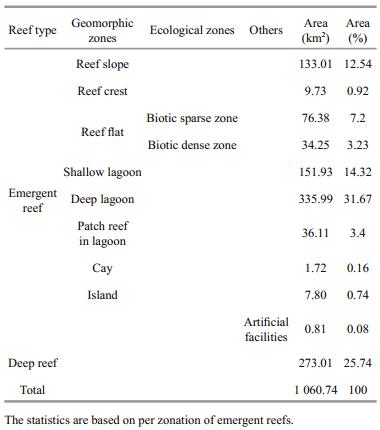
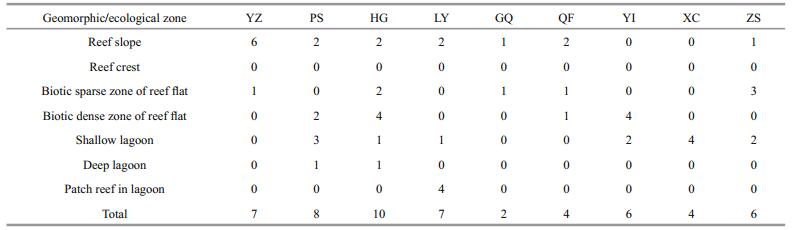
3 RESULT 3.1 Xisha Islands reef mappingEleven thematic layers are presented in Fig. 2, including seven geomorphic zone layers, two reef flat ecological zone layers, one artificial facilities layer of emergent reefs, as well as one deep reef layer. The detailed geomorphic and ecological structure shown in Fig. 2 is indicative of variation within reef structure throughout the Xisha Islands and also highlights the characteristics of reefs in the SCS. Table 3 contains the surface areas of each thematic class. A total reef area covering all the classes was 1 060.74 km2, including 787.73 km2 emergent reefs and 273.01 km2 deep reefs (Table 3). The lagoon was by far the largest zone, comprising nearly 62% of the emergent reefs. Reef slope accounted for 16.9% of the emergent reefs, and reef flat 14% (Table 3). The number of field transects for each geomorphic zone and ecological zone of reefs is shown in Table 4.

|
| Figure 2 Geomorphic map of Xisha Islands as derived from Landsat-8 and GF-1 imageries |
|
|
Mean live hard coral cover of the Xisha Islands reefs in 2014 was 12.5% (SE=3.31). Across the geomorphic and ecological zones, it was 30.34% on the reef slopes, 6.73% on the biotic sparse zones of reef flat, 44.37% on the biotic dense zones of reef flat, 4.07% on the shallow lagoons, 3.64% on the deep lagoons and 50.34% on the patch reefs in the lagoon (Fig. 3). Reef slopes, biotic dense zones of reef flat and patch reefs are all dominated by hard corals.

|
| Figure 3 Live hard coral, bleached coral and dead coral cover for all the 20 m transect sites surveyed in June 2014 |
The limit of visibility in Landsat-8 Band 2 and GF-1 Band 1 of reef slopes was to depths of approximately 10–20 m. Mean hard coral cover was high with smaller standard errors (SE=3.72) between sites (Fig. 3a). Montipora (45.5%) and Pocillopora (13.0%) dominated other genera on the reef slopes. Colonies are sub-massive, laminar or encrusting.
The biotic dense zone of the reef flat was usually in the inner reef flat, near shallow lagoon areas. Reef flats of table reefs exhibited mostly bright areas with few or no dark areas. In the reef flat biotic dense zone, hard coral cover was very high (44.37%), however, with larger standard errors (SE=7.26), with a range of 11.05%–87.86% (Fig. 3c). Branching Montipora (88.1%) dominated these areas, and branching Montipora digitata were most abundant. Coral genera Acropora exhibited a low abundance (3.46%). A striking feature shown in the map (Fig. 2) was that all the simple atolls in Xisha Islands had biotic dense reef flat zones. Moreover, this zonation was more likely to appear on the broader northern reef flat compared with the south reef flat (Fig. 2).
Patch reefs were isolated structures in the lagoon. Exposed patch reefs showed distinguishing growth patterns and clear, but narrow, zonations (slope, crest, patches flat) while sheltered patch reefs did not. Some parts of exposed patch reefs had hard coral distribution very similar to the biotic dense zone of the reef flat (Fig. 3f). They were also dominated by branching Montipora and Acropora. Some parts of exposed patch reefs had low hard coral cover (Fig. 3f). Sheltered patch reefs in the lagoon were 100% covered by slow-growing Porites (Fig. 3f, LY (5)).
Biotic sparse zones of reef flats (bright areas) were located near the reef crest. These areas were dominated by debris such as coral skeletal fragments. These zones were mostly exposed at low tide. Hard coral cover was generally low (6.73%), also with smaller standard errors (SE=2.74) (Fig. 3b). Acropora and Montipora were the dominant genera, representing 44.81% and 26.88% of corals, respectively. In contrast, turf algae had a high cover, occupying the debris. A large number of studies have shown that coral cover is extremely important in explaining the abundance of obligate coral-dwelling species (Munday, 2002), corallivorous fishes (Pratchett et al., 2006) or species dependent on coral habitat for recruitment (Komyakova et al., 2013). Therefore, bright areas of reef flat were referred to as the biotic sparse zone of the reef flat owing to the low hard coral cover, while dark areas of reef flat were referred to as the biotic dense zone of the reef flat.
Lagoon areas had consistently low live hard coral cover, and were dominated by carbonate sand and seagrass. Mean live hard coral cover for shallow lagoon and deep lagoon were low (1.09%) with smaller standard errors (3.64) (Fig. 3d, e). The common distributed genera on the shallow lagoon included Montipora (24.37%), Favia (19.86%), Acropora (18.87%), Porites (16.39%) and Pocillopora (8.31%).
The reef crest features in Yongxing Island have shown that the sediments were characterized by coral skeletal fragments and broken branches, interbedded with massive coral skeletal fragments from the reef flat (Shen et al., 2013). As such, the hard coraldominated areas in the Xisha Islands were limited to some reef slopes, the biotic dense zones of the reef flat and patch reefs in the lagoon areas. According to our survey, using the average hard coral cover 30.34% of reef slopes, 6.73% of biotic sparse zones of reef flat, 44.37% of biotic dense zones of reef flat, 4.07% of shallow lagoon, 3.64% of deep lagoon, and 50.34% of lagoon patches, we obtained 97.28 km2 of hard coral-dominated areas of the emergent reefs within the mapped areas (Table 3). To date, there is no knowledge about the hard coral distribution of deep reef ecosystems within the Xisha archipelago. However, compared with the field statistics of islands' areas (7.862 3 km2) (Nie et al., 1997), these numbers reflect accurately the extent of the Xisha Islands reef system (1 060 km2), emergent reefs (787.73 km2), and the surface area likely covered by hard corals of emergent reefs (97.28 km2). Our geomorphic and ecological map reflects the continuous spatial distribution of the reefs' hard corals (Fig. 2).
3.3 Live hard coral diversityHard coral diversity for all the 54 sites within six geomorphic and ecological zones is shown in Fig. 4. We observed a significantly higher species diversity (H'(s)) in reef slopes (70 species) than in lagoons (37), biotic dense zones of reef flat (29), biotic sparse zones of reef flat (26), and patch reefs (17) (independent-samples t test, P < 0.05). Coral species diversity was low on most of the biotic sparse zones of reef flat (H'(s)=1.1–1.36) and biotic dense zones of reef flat (H'(s)=0.48–1.18) (Fig. 4a). In some shallow lagoons, H'(s) was similar to that of the reef slopes, while many were zero as a result of the minimal hard coral cover (Fig. 4a). Statistical analysis indicated that hard coral species diversity of patch reefs was low and not statistically significant compared with that of the reef flat biotic dense zones (independent-samples t test, P>0.05). Moreover, genus diversity among geomorphic and reef flat ecological zones showed a similar trend with hard coral species diversity (Fig. 4b). Genus diversity (H'(g)) were significantly higher on the reef slopes (27 genera) than the shallow lagoons (12), biotic dense zones of the reef flat (12), biotic sparse zones of the reef flat (12) and patch reefs (10) (independent-samples t test, P < 0.05).

|
| Figure 4 Variations in diversity and evenness of sites within geomorphic and reef flat ecological zones a. Shannon diversity for species (H'(s)) and Pielou evenness for species (E(s)); b. Shannon diversity for genera (H'(g)) and Shannon evenness for genera (E(g)). |
There was also a zone pattern for evenness. The differences between species evenness and genus evenness were not significant between the reef flat biotic dense zones and lagoon patch reefs (independent-samples t test, P < 0.05). They showed a lower evenness compared with other zones, both in terms of species evenness (E(s) < 0.60) and genus evenness (E(g) < 0.54) (Fig. 4). These signatures suggested the dominance of a small number of species or genus, which corresponded to the dominance of branching Montipora and Acropora within these two zones. Despite the low species and genus diversity, E(s) and E(g) on the biotic sparse zones of the reef flat were a little higher than those on the reef flat biotic dense zones and patch reefs. The high average E(s) (0.76) and E(g) (0.69) reflects the evenly distributed species and genus at the reef slopes (Fig. 4). The noteworthy zones were the shallow lagoon and deep lagoon. E(s) and E(g) were close to 1 and the fluctuations were mild when live hard coral cover was more than 3%, suggesting the nearly equal distribution of species and genus when live hard coral cover was high in the lagoon.
3.4 Dead coral coverMean dead coral across all zones was 5.6% (Fig. 3) and 83% of the dead corals were covered with algae. Dead coral was present on the reef slope (14.82%), the biotic sparse zone of the reef flat (3.38%), the biotic dense zone of the reef flat (37.46%), within shallow lagoon areas (1.09%) and patch reefs (18.14%) (Fig. 3). The three zones dominated by hard coral cover—the biotic dense zone of reef flats, patch reefs and reef slopes—also had high percentages of dead coral cover. The noteworthy zone is the biotic dense zone of the reef flat. Currently, 64% of the survey sites had dead coral cover between 30% and 80% (Fig. 3c). We found a significant linear relationship (R2=0.819 6, P < 0.05) between live hard coral and local dead coral, with hard coral cover reaching >70% if there was no mortality (Fig. 5).

|
| Figure 5 Relationship between live hard coral and dead coral in the biotic dense zones of reef flat |
A black encrusting sponge (Terpios hoshinota) covering dead corals, called "black disease" (Rützler and Muzik, 1993), was observed at two sites on Panshi Islet at the time of survey, with the coverage of 59.47% at one location and 7.86% at the other site (Fig. 3c). This sponge rapidly overgrows and kills corals. This phenomenon was not found neither on other zones of Panshi Islet nor on other reefs. Scattered coral bleaching (1.76%) was found on Yin Islet (Fig. 3c).
4 DISCUSSION 4.1 Reef habitatDifferences in hard coral cover were observed among geomorphic zones and reef flat ecological zones throughout the Xisha Islands, but some consistent regional patterns emerged. Hard coral cover was generally high in sheltered habitats such as the lagoon patch reefs and the biotic dense zones of the reef flat. One or two genera heavily dominated in these areas, as in other atolls in the central Pacific such as Kingman and Palmyra (Williams et al., 2013). The intermediate disturbance hypothesis predicts that a climax community appears that becomes dominated by a small quantity of competitively superior species if disturbances are not frequent (Connell, 1978; Rogers, 1993). On the biotic dense zones of the reef flat and exposed patch reef flats, conditions may be stable enough to allow competitive dominance by M. digitata, most likely as a result of its rapid growth and high fragmentation (Shaish et al., 2010). However, considering the high hard coral cover and relatively low diversity in these zones, this habitat was still not in an equilibrium state. The high mortality in these zones highlighted the dynamic nature of this coral community, seemingly preventing monopolization of space by fast-growing Montipora and Acropora corals. The relationship between live and dead coral within the biotic dense zones of the reef flat (Fig. 5) showed an equilibrium between live and dead coral as opposed to coral and algae. As physical factors are regarded as the primary control in shallow water ( < 8 m) (Glynn, 1976), the possible mechanisms of mass mortality in the biotic dense zones of the reef flat and exposed patch reef flats may be physical disturbances such as crown-of-thorns starfish, or coral disease.
The monospecific dominance in sheltered patch reef areas by slow-growing Porites provided indirect evidence of competitive exclusion. As Porites are not rapid colonists following disturbance events, the sheltered patch reef represented a low disturbance environment. It has been said that live coral cover is a good proxy for coral species composition and coral richness on multiple spatial scales (Arias-González et al., 2011). However, the biotic dense zones of the reef flat and patch reefs confirmed that reef zones with high hard coral cover did not necessarily have high coral species diversity. The possible reason of the emergence of biotic dense zones within the reef flats in this region could be that the reef flats are generally broad and flat. This can prevent debris such as coral skeletal fragments being deposited in the biotic dense zone. If the reef flat was steep such as the Kingman in the central Pacific (Williams et al., 2013), the debris would reach deeper, resulting in much lower coral cover over the whole reef flat, with higher cover of turf algae causing a physical disturbance. This could also explain why the biotic dense zones were more apparent on the broader northern reef flats of simple atolls. The appearance of biotic dense zones of the reef flat on all simple atolls was an outstanding characteristic for coral reefs in the Xisha Islands. In some other atolls in the Pacific, the reef flats are totally dominated by algae or branching coral (Williams et al., 2013).
The Xisha Islands' reef slopes had similar hard coral cover as the sheltered biotic dense zones of the reef flats and lagoon patch reefs, but exhibit a higher diversity of coral species and genus. This is due to the efficient flushing of sediments along the steep slope, and wave disturbance provides high nutrient fluxes (Hall, 1999). In a study undertaken on the Hawaii Islands, Dollar (1982) found that the biological diversity of the coral reef is correlated with the frequency and energy of disturbances. Moderate wave energy can prevent a single species from booming to a climax community, resulting in a higher species diversity. The high diversity and evenness of hard coral reflected the moderate wave energy of the Xisha Islands. Wave-resistant Montipora and Pocillopora are dominant. Massive Montipora species are medium energy corals while Pocillopora sp. are high energy branching species (Storlazzi et al., 2002; Williams et al., 2013).
The Xisha Islands' reef flat biotic sparse zone had consistently lower hard coral cover than the patch reefs, the biotic dense zones of reef flats and reef slopes. The opening space was covered by coral skeletal fragments, transported from the reef slope over the reef crest and brought into the biotic sparse zone of the reef flat during large swell events. Turf algae are a rapid early colonist of bare space following disturbances (Grigg, 1983) and thus exhibit a higher cover. As most of the inhabited table reefs tended to reef flats dominated by biotic sparse zones with no biotic dense zones, these reef flats are characterized by a higher cover of algae.
Finally, the percentage of hard coral cover in lagoon areas was generally low, but this zone exhibited higher diversity, similar to that of the reef slope. Studies have found that calcareous substrates favor the growth and recruitment of coral, while sandy substrates reduce its development (Rodríguez-Zaragoza et al., 2012). As shallow and deep lagoons were dominated by sandy substrates, live hard coral cover was low. Seagrass typically requires environments of low wave energy and loose substrates such as sand (Zapata-Ramírez et al., 2013), conditions that are met in the lagoon areas. Unlike the high wave energy disturbance present on the reef slopes, disturbances in the lagoon are minimal. The high diversity and high evenness of hard coral in the lagoons was due to the water depth. Evidence suggests that diversity increases with depth regardless of the strength of any disturbances (Huston, 1985). Similar patterns of lagoon diversity have been noted in other atolls, such as the Chagos Atolls (Sheppard, 1980).
4.2 Hard coral statusTotal hard coral cover has been used as an indicator of overall reef health, as recruitment of other corals and many other associated species is reliant on the hard corals substrate (Arias-González et al., 2011; Rodríguez-Zaragoza et al., 2011). Mean live hard coral cover of the Xisha Islands in 2014 was 12.5% (SE=3.31). In the absence of any historical records prior to 2009 of hard coral cover at the survey sites, it is not possible to determine if the reefs are currently undergoing degradation or recovery. However, compared with the live coral cover data in 2009 for Zhaoshu Island ( < 10%), it suggests an increase in coral cover (Fig. 3).
In contrast to the typical levels of coral cover on the shallow slopes of the central Great Barrier Reef (~40% at 1–3 m and ~15% at 6 m) (Done et al., 1986), hard coral cover was 31.5% at 1–3 m and 25.3% at 4–6 m in the Xisha Islands in 2014. Many reef slopes and reef flat biotic dense zones sites exhibited hard coral cover >40% (Fig. 3a, c). These high rates of hard coral cover indicate that the coral reefs of the Xisha Islands may be in a recovery stage.
However, live coral cover on the biotic dense zones of reef flats and of exposed patches flat in the lagoon present a disequilibrium status, where despite the high coral cover, the areas exhibit low diversity and low evenness of branching coral as well as an inversely proportional amount of dead coral in the reef flat biotic dense zones. Zuo et al. (2015) found that thermal stress leading to mild bleaching may have occurred during 1982–2009 in the Xisha Islands. On June 5, no significant warming event in Xisha Islands was predicted by Administration's (NOAA)-Coral Reef Watch (CRW) satellite products. The coral bleaching seen on Yin Islet may not be trigged by thermal stress.
5 CONCLUSIONIn the present study, the regional live and dead hard coral distribution related to geomorphic and reef flat ecological zones was mapped by combining broad survey and moderate-resolution satellite images. Patch reefs in the lagoon, biotic dense zones of reef flats and reef slopes were zones dominated by hard coral. In a reef management context, these areas are in need of protection from issues such as ocean warming and acidification. Patch reefs and biotic dense zones of reef flat exhibited a low diversity and low evenness of coral species and genus and fluctuating amounts of hard coral cover. Reef slopes showed a high diversity, high evenness and equally distributed of hard coral. Comparison of the current coral cover within these hard coral-dominated zones and that of 2009, the coral reefs of the Xisha Islands may currently be in a recovery status. However, high percentages of dead coral were still documented in the three hard coraldominated zones, especially within the unstable biotic dense zones of the reef flat and exposed patch reefs in lagoon areas. The high cover, low diversity, low evenness of branching coral and inversely proportional local dead coral in the biotic dense zones of reef flat require further investigation.
Integrating this hard coral distribution map into reef management perspectives is expected to enable more informed and efficient planning as it more fully considers the distribution of coral biodiversity and percentages of coral cover. The distribution of biodiversity and hard coral cover as indicated by the map can be used to determine the location and size of management areas, to identify representative or distinctive habitats, and to evaluate their conservation status. Furthermore, this map can also assist field survey planning. This would maximize the possibilities of collecting a validation dataset and allow managers to investigate the full set of management choices in a time-efficient manner. Although the coral cover, coral morphology, species composition and abundance are not static through time as they vary with natural and anthropogenic activities, the relative diversity of corals between zones will remain if the underlying reef geomorphology processes do not change.
6 ACKNOWLEDGEMENTLI Junmin and ZHOU Guoliang are thanked for their essential assistance in the field investigation. Two anonymous reviewers also provided many useful comments that were incorporated into this report.
| Andréfouët S, Guzman H M, 2005. Coral reef distribution, status and geomorphology-biodiversity relationship in Kuna Yala (San Blas) archipelago, Caribbean Panama. Coral Reefs, 24(1): 31–42. Doi: 10.1007/s00338-004-0444-4 |
| Arias-González J E, Núñez-Lara E, Rodríguez-Zaragoza F A, Legendre P, 2011. Reefscape proxies for the conservation of Caribbean coral reef biodiversity. Ciencias Marinas, 37(1): 87–96. Doi: 10.7773/cm |
| Coles S L, Looker E, Burt J A, 2015. Twenty-year changes in coral near Muscat, Oman estimated from manta board tow observations. Marine Environmental Research, 103: 66–73. Doi: 10.1016/j.marenvres.2014.11.006 |
| Connell J H, Hughes T P, Wallace C C, 1997. A 30-year study of coral abundance, recruitment, and disturbance at several scales in space and time. Ecological Monographs, 67(4): 461–488. Doi: 10.1890/0012-9615(1997)067[0461:AYSOCA]2.0.CO;2 |
| Connell J H, 1978. Diversity in tropical rain forests and coral reefs. Science, 199(4335): 1302–1310. Doi: 10.1126/science.199.4335.1302 |
| Cornell H V, Harrison S P, 2013. Regional effects as important determinants of local diversity in both marine and terrestrial systems. Oikos, 122(2): 288–297. Doi: 10.1111/more.2013.122.issue-2 |
| Dalleau M, Andréfouët S, Wabnitz C C C, Payri C, Wantiez L, Pichon M, Friedman K, Vigliola L, Benzoni F, 2009. Use of habitats as surrogates of biodiversity for efficient coral reef conservation planning in Pacific Ocean islands. Conservation Biology, 24(2): 541–552. |
| Dollar S J, 1982. Wave stress and coral community structure in Hawaii. Coral Reefs, 1(2): 71–81. Doi: 10.1007/BF00301688 |
| Done T J, DeVantier L M, Turak E, Fisk D A, Wakeford M, van Woesik R, 2010. Coral growth on three reefs: development of recovery benchmarks using a space for time approach. Coral Reefs, 29(4): 815–833. Doi: 10.1007/s00338-010-0637-y |
| Done T, Osborne K, Navin K. 1986. Recovery of corals postAcanthaster: progress and prospects. In: Proceedings of the 6th International Coral Reef Symposium. ICRS, Townsville, Australia, 2: 137-142. |
| Evensen N R, Edmunds P J, Sakai K, 2015. Effects of pCO2 on spatial competition between the corals Montipora aequituberculata and Porites lutea. Marine Ecology Progress Series, 541: 123–134. Doi: 10.3354/meps11512 |
| Glynn P W, 1976. Some Physical and biological determinants of coral community structure in the Eastern Pacific. Ecological Monographs, 46(4): 431–456. Doi: 10.2307/1942565 |
| Grigg R W, 1983. Community structure, succession and development of coral reefs in Hawaii. Marine Ecology Progress Series, 11: 1–14. Doi: 10.3354/meps011001 |
| Hall D B, 1999. The geomorphic evolution of slopes and sediment chutes on forereefs. Geomorphology, 27(3-4): 257–278. Doi: 10.1016/S0169-555X(98)00081-6 |
| Huang H, You F, Lian J S, Yang J H, Li X B, Dong Z J, Zhang C L, Yuan T, 2011. Species diversity and distribution of scleractinian coral at Xisha Islands, China. Biodiversity Science, 19(6): 710–715. |
| Hughes T P, Baird A H, Dinsdale E A, Moltschaniwskyj N A, Pratchett M S, Tanner J E, Willis B L, 1999. Patterns of recruitment and abundance of corals along the Great Barrier Reef. Nature, 397(6714): 59–63. Doi: 10.1038/16237 |
| Hughes T P, Huang H, Young M A L, 2012. The wicked problem of China's disappearing coral reefs. Conservation Biology, 27(2): 261–269. |
| Huston M A, 1985. Patterns of species diversity on coral reefs. Annual Review of Ecology and Systematics, 16: 149–177. Doi: 10.1146/annurev.es.16.110185.001053 |
| Jokiel P L, 1984. Long distance dispersal of reef corals by rafting. Coral Reefs, 3(2): 113–116. Doi: 10.1007/BF00263761 |
| Joyce K E, Phinn S R, Roelfsema C M, Neil D T, Dennison W C, 2004. Combining Landsat ETM+ and Reef Check classifications for mapping coral reefs: a critical assessment from the southern Great Barrier Reef, Australia. Coral Reefs, 23(1): 21–25. Doi: 10.1007/s00338-003-0357-7 |
| Karlson R H, Cornell H V, 1998. Scale-dependent variation in local vs. regional effects on coral species richness. Ecological Monographs, 68(2): 259–274. |
| Kobryn H T, Wouters K, Beckley L E, Heege T, 2013. Ningaloo reef: shallow marine habitats mapped using a hyperspectral sensor. PLos One, 8(7): e70105. Doi: 10.1371/journal.pone.0070105 |
| Komyakova V, Munday P L, Jones G P, 2013. Relative importance of coral cover, habitat complexity and diversity in determining the structure of reef fish communities. PLos One, 8(12): e83178. Doi: 10.1371/journal.pone.0083178 |
| Lapointe B E, Thacker K, Hanson C, Getten L, 2011. Sewage pollution in Negril, Jamaica: effects on nutrition and ecology of coral reef macroalgae. Chinese Journal of Oceanology and Limnology, 29(4): 775–789. Doi: 10.1007/s00343-011-0506-8 |
| Leiper I A, Phinn S R, Roelfsema C M, Joyce K E, Dekker A G, 2014. Mapping coral reef benthos, substrates, and bathymetry, using compact airborne spectrographic imager (CASI) data. Remote Sensing, 6(7): 6423–6445. Doi: 10.3390/rs6076423 |
| Leon J, Woodroffe C D, 2011. Improving the synoptic mapping of coral reef geomorphology using object-based image analysis. International Journal of Geographical Information Science, 25(6): 949–969. Doi: 10.1080/13658816.2010.513980 |
| Li Y C, Huang H, Dong Z J, Lian J S, Zhou G W, 2008. Headway of study on coral reefs ecological restoration. Acta Ecologica Sinica, 28(10): 5047–5054. |
| Magurran A E, 1988. Ecological Diversity and Its Measurement. Princeton University Press, Princeton. |
| McWilliams J P, Côté I M, Gill J A, Sutherland W J, Watkinson A R, 2005. Accelerating impacts of temperature-induced coral bleaching in the Caribbean. Ecology, 86(8): 2055–2060. Doi: 10.1890/04-1657 |
| Moberg F, Folke C, 1999. Ecological goods and services of coral reef ecosystems. Ecological Economics, 29(2): 215–233. Doi: 10.1016/S0921-8009(99)00009-9 |
| Morri C, Montefalcone M, Lasagna R, Gatti G, Rovere A, Parravicini V, Baldelli G, Colantoni P, Bianchi C N, 2015. Through bleaching and tsunami: coral reef recovery in the Maldives. Marine Pollution Bulletin, 98(1-2): 188–200. Doi: 10.1016/j.marpolbul.2015.06.050 |
| Morton B, Blackmore G, 2001. South China Sea. Marine Pollution Bulletin, 42(12): 1236–1263. Doi: 10.1016/S0025-326X(01)00240-5 |
| Munday P, 2002. Does habitat availability determine geographical-scale abundances of coral-dwelling fishes?. Coral Reefs, 21(1): 105–116. Doi: 10.1007/s00338-001-0200-y |
| Nie B F, Chen T G, Liang M T, Wang Y Q, Zhong J L, Zhu Y Z, 1997. Relationship between coral growth rate and sea surface temperature in the Northern part of South China Sea during the past 100 a. Science in China Series D: Earth Sciences, 40(2): 173–182. Doi: 10.1007/BF02878376 |
| Pante E. 2005. Temporal Variation in a Bahamian Patch Reef Community: The Decline of Rainbow Gardens Reef. College of Charleston, Charleston SC. |
| Phinn S R, Roelfsema C M, Mumby P J, 2012. Multi-scale, object-based image analysis for mapping geomorphic and ecological zones on coral reefs. International Journal of Remote Sensing, 33(12): 3768–3797. Doi: 10.1080/01431161.2011.633122 |
| Pratchett M S, Wilson S K, Baird A H, 2006. Declines in the abundance of Chaetodon butterflyfishes following extensive coral depletion. Journal of Fish Biology, 69(5): 1269–1280. Doi: 10.1111/jfb.2006.69.issue-5 |
| Rodríguez-Zaragoza F A, Cupul-Magaña A L, Galván-Villa C M, Ríos-Jara E, Ortiz M, Robles-Jarero E G, LópezUriarte E, Arias-González J E, 2011. Additive partitioning of reef fish diversity variation: a promising marine biodiversity management tool. Biodiversity and Conservation, 20(8): 1655–1675. Doi: 10.1007/s10531-011-0053-9 |
| Rodríguez-Zaragoza F A, Pérez-de Silva C V, Ruiz-Zárate M A, Cupul-Magaña A L, Ortiz M, Medina-Hernández A, Rico P, Priego-Arenas M R, Hernández-Flores Á, 2012. Spatial variation of hermatypic coral assemblages in Cayos Cochinos Archipelago, Honduras. Latin American Journal of Aquatic Research, 40(4): 992–1004. Doi: 10.3856/vol40-issue4-fulltext-15 |
| Roelfsema C, Phinn S, 2010. Integrating field data with high spatial resolution multispectral satellite imagery for calibration and validation of coral reef benthic community maps. Journal of Applied Remote Sensing, 4(1): 043527. Doi: 10.1117/1.3430107 |
| Rogers C S, 1993. Hurricanes and coral reefs: the intermediate disturbance hypothesis revisited. Coral Reefs, 12(3-4): 127–137. Doi: 10.1007/BF00334471 |
| Rützler K, Muzik K, 1993. Terpios hoshinota, a new cyanobacteriosponge threatening Pacific reefs. Scientia Marina, 57(4): 395–403. |
| Shaish L, Levy G, Katzir G, Rinkevich B, 2010. Employing a highly fragmented, weedy coral species in reef restoration. Ecological Engineering, 36(10): 1424–1432. Doi: 10.1016/j.ecoleng.2010.06.022 |
| Shen J W, Yang H Q, Wang Y, Fu F X, Zhao N, 2013. Coral community dynamics and shallow-water carbonate deposition of the reef-flat around Yongxing Island, the Xisha Islands. Science China Earth Sciences, 56(9): 1471–1486. Doi: 10.1007/s11430-013-4677-3 |
| Sheppard C R C, 1980. Coral cover, zonation and diversity on reef slopes of Chagos Atolls, and population structures of the major species. Marine Ecology Progress Series, 2: 193–205. Doi: 10.3354/meps002193 |
| Shi Q, Yan H Q, Zhang H L, Zhao M X, 2011. Spatial variations of stony coral cover on the reef slope of Yongxing Island, Xisha Islands. Journal of Tropical Oceanography, 30(2): 10–17. |
| Smith V, Rogers R, Reed L. 1975. Automated mapping and inventory of Great Barrier Reef zonation with LANDSAT data. In: Proceedings of OCEAN 75 Conference. IEEE, San Diego, CA. p. 775-780. |
| Stoddart D R, 1969. Ecology and morphology of recent coral reefs. Biological Reviews, 44(4): 433–498. Doi: 10.1111/brv.1969.44.issue-4 |
| Storlazzi C, Field M E, Dykes J D, Jokiel P L, Brown E, 2002. Wave control on reef morphology and coral distribution: Molokai, Hawaii. Ocean Wave Measurement and Analysis: 784–793. |
| Suzuki H, Matsakis P, Andréfouët S, Desachy J. 2001. Satellite image classification using expert structural knowledge: a method based on fuzzy partition computation and simulated annealing. In: Proceedings of the Annual Conference of International Association for Mathematical Geology. Cancun, Mexico. |
| Syms C, Kingsford M J. 2008. Coral reef habitats and assemblages. In: Hutchings P, Kingsford M, HoeghGuldberg O eds. The Great Barrier Reef: Biology, Environment and Management. CSIRO, Collingwood. |
| Velloth S, Mupparthy R S, Raghavan B R, Nayak S, 2014. Coupled correction and classification of hyperspectral imagery for mapping coral reefs of Agatti and Flat Islands, India. International Journal of Remote Sensing, 35(14): 5544–5561. Doi: 10.1080/01431161.2014.926410 |
| Veron J E N. 2000. Corals of the World. Australian Institute of Marine Science and CRR Ald Pty Ltd, Townsville, Australia. |
| Williams G J, Smith J E, Conklin E J, Gove J M, Sala E, Sandin S A, 2013. Benthic communities at two remote Pacific coral reefs: effects of reef habitat, depth, and wave energy gradients on spatial patterns. PeerJ, 1: e81. Doi: 10.7717/peerj.81 |
| Wu Z J, Wang D R, Tu Z G, Li Y C, Chen J R, Zhang G X, 2011. The analysis on the reason of hermatypic coral degradation in Xisha. Acta Oceanologica Sinica, 33(4): 140–146. |
| Xu L Q, Liu X D, Sun L G, Yan H, Liu Y, Luo Y H, Huang J, Wang Y H, 2010. Distribution of radionuclides in the guano sediments of Xisha Islands, South China Sea and its implication. Journal of Environmental Radioactivity, 101(5): 362–368. Doi: 10.1016/j.jenvrad.2010.02.004 |
| Zapata-Ramírez P A, Blanchon P, Olioso A, Hernandez-Nuñez H, Sobrino J A, 2013. Accuracy of IKONOS for mapping benthic coral-reef habitats: a case study from the Puerto Morelos Reef National Park, Mexico. International Journal of Remote Sensing, 34(9-10): 3671–3687. Doi: 10.1080/01431161.2012.716922 |
| Zuo X L, Su F Z, Wu W Z, Chen Z K, Shi W, 2015. Spatial and temporal variability of thermal stress to China′s coral reefs in South China Sea. Chinese Geographical Science, 25(2): 159–173. Doi: 10.1007/s11769-015-0741-6 |