 2017, Vol. 35
Institute of Oceanology, Chinese Academy of Sciences
Article Information
- RAZZAGHI Marzieh, MASHJOOR Sakineh, KAMRANI Ehsan
- Mean trophic level of coastal fisheries landings in the Persian Gulf (Hormuzgan Province), 2002–2011
- Chinese Journal of Oceanology and Limnology, 35(3): 528-536
- http://dx.doi.org/10.1007/s00343-017-5311-6
Article History
- Received Nov. 19, 2015
- accepted in principle Mar. 3, 2015


2 Young Researchers Club, Bandar-e-abbas Branch, Islamic Azad University, Bandar-e-abbas, Iran;
3 Young Researchers Club, Ahvaz Branch, Islamic Azad University, Ahvaz, Iran
World-wide, over 60% of the most important fish stocks are either overexploited or at the limit of becoming overexploited by current fishing severity (Vasconcellos and Gasalla, 2001). The failure of traditional stock assessment and management of fisheries (Pauly et al., 2002), has led to an increasing trend in world catches (FAO, 2002), overfishing, and, in some cases, to stock collapse (Botsford et al., 1997). In addition, intensive exploitation of commercial fish communities often results in substantial declines in the abundance of target species and changes in species composition (Gulland, 1987). The key factors proposed to explain these changes are selective fishing pressure on more highly valued species of fish or stocks (Gulland, 1987; Haedrich and Barnes, 1997). Therefore, both e mean trophic level (MTL) of landings in any particular area and aquatic production have been proposed as indicators of fishery impact on the food web level (Pauly et al., 1998, 2001, 2002; Rochet and Trenkel, 2003) or on ecosystems, notably by testing whether marine food webs are fished down or farmed up (Perez et al., 1996; Treganza et al., 1997; Morizur et al., 1999). It is well known that high trophic-level fishes, which are made up of large and slow-growing species with late maturity, decline in abundance more rapidly than low trophic-level species, which are smaller and faster growing (Greenstreet and Hall, 1996). The marine trophic indicator (MTI) from catches, is intended to detect shifts from high-trophic-level predators to lowtrophic-level invertebrates and plankton-feeders (Branch et al., 2010). Based on this indicator, explanation of observed patterns in human impacts use a conceptual typology to classify the declining MTL in ecosystems into 4 types: firstly, when, predators collapse ("fishing down"); secondly, when low-trophic-level fisheries expand ("fishing through"); thirdly addition of new and high-TL species to catches over time ("fishing up"); and fourthly, general expansion of fisheries leading to "ecosystem overfishing" or "fisheries expansion") (Shannon et al., 2014). The assumption is that catch MTL measures changes in ecosystem MTL and biodiversity (Pauly et al., 1998; Pauly and Watson, 2005). Pauly et al. (1998) attested that the mean trophic level of fisheries landings around the world has been declining since the onset of industrialized fishing. According to estimation by Pauly et al. (1998), the average transfer efficiency between trophic levels in aquatic ecosystems is 10%, thus, a fall of 1 in the level at which a fishery functions would lead to a 10-fold increase in potential catches, and this effect has resulted in introduction of the "fishing-inbalance" (FiB) index (Pauly et al., 2000a, b).
Since the Persian Gulf has a strategic position and an important commercial fishery resource, it is more subject to overfishing, over-capitalization of fisheries technology, unregulated fishing gears, marine environmental contamination and unbalanced fisheries management. Therefore, marine capturefi sheries of the Persian Gulf in line with these global trends are in a state of crisis. Based on reports of the Iranian Fisheries Research Organization (IFRO) (2005), all seafood resources in the Persian Gulf are believed to be in an entirely exploited or overexploited condition, e.g. shrimp stocks, are at much lower levels of abundance than in the past, small pelagic fish stocks are lightly exploited and could sustain increased harvests, demersal fish stocks have declined over the past five-ten years. This has resulted in a decline in landings in the Iranian area, from around 147 000 tons in 1996 to 95 000 tons in 2001. In this connection, the present study was undertaken to determine and compare the impact of fishing in Hormuzgan waters of the Persian Gulf and to test the MTL of its landings during a period of ten years.
2 MATERIAL AND METHOD 2.1 Landing data collectionLandings and fisheries data of Hormuzgan Province coastal waters, Persian Gulf, Iran (Fig. 1), are detailed by species, in term of quantity (103 tonnes) for the last decade (2002–2011) were collected from the Iranian National Organization of Fisheries. These species comprised about 90%–95% of the total annual landings in the study period.

|
| Figure 1 Map of study area, the Persian Gulf and location of the Hormozgan inshore water |
Trophic level is defined as the position of an organism in the food chain. The Marine Trophic Index (MTI) or the Mean trophic level (MTL) is calculated from a combination of fisheries landings and diet composition data of the landed fish species. MTI expresses the position of organisms within the food webs that largely define aquatic ecosystems. Their values are set as a defining TL of 0 for Primary producers, TL of 1 for microscopic plants and detritus, TL of 2 for herbivores and detritivores (first level consumers), TL of 3–5 for second-level consumers and higher order carnivores, and animals that feed from more than one trophic level have trophic omnivory or non-integer trophic levels. So, real consumers, which tend to have general diets, do not usually have TL with integer values (Christensen and Pauly, 1992). The equation corresponding to TL for any consumer species i is:
 (1)
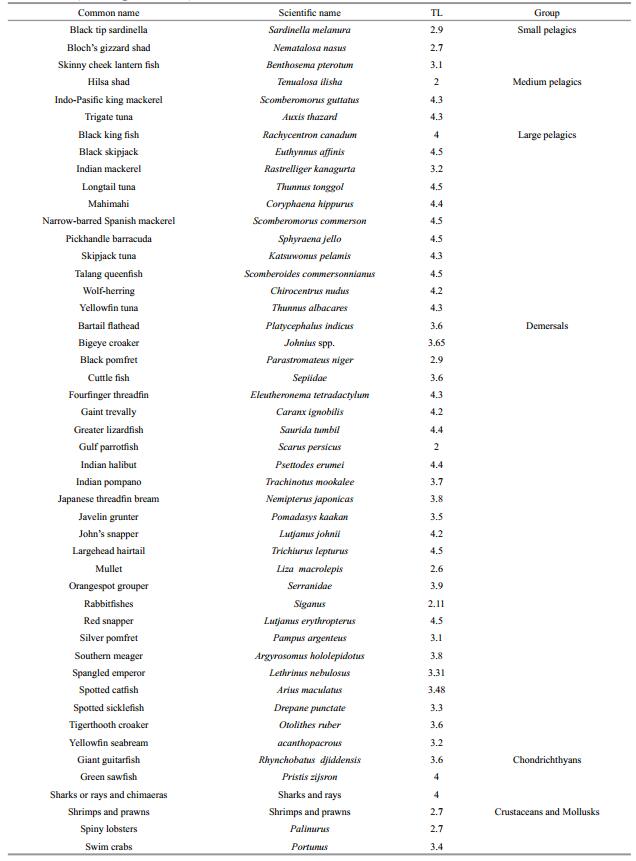
(1)where TLj is the "fractional" (i.e., non-integer) trophic level of the prey j, and DCij represents the fraction of j in the diet of i (Christensen and Pauly 1992). In this study, trophic level estimates for 49 species, based on their diet composition, were found in FishBase (www.fishbase.org), the global online database on fish, and in the Sea Around Us (see www.seaaroundus.org) database (Table 1). As described by Pauly et al. (1998), estimates of the mean trophic level of the catch (MTI) for each year of period (2002–2011) were calculated as:
|
 (2)
(2)where MTIj is the mean trophic level of landing in the total year of the period, Yij the landing of species i in year j and TLi is the trophic level of species i.
2.3 The Fishing-in-Balance (FiB) indexThe fishing-in-balance (FiB) index (Pauly et al., 2000b) was used to indicate whether fisheries in Hormuzgan coastal waters are balanced in ecological terms. According to Pauly et al. (2000b) and Christensen (2000), the FiB index for any year i in a series was estimated as follows:
 (3)
(3)where Yi is landings during year i, TLi the mean TL of the landings during year i, TE the trophic efficiency (here set at 0.10), and Y0 and TL0 are the landings and mean TL during the first year of the series (Pauly et al., 2000b).The FiB index remains constant (FiB=0) if the TL-changes match 'ecologically appropriate' changes in landings. When the FiB index decreases (FiB < 0) this may indicate that fisheries withdraw so much biomass from the ecosystem that its functioning is impaired. An increase in FiB (FiB>0) indicates expansion of a fishery beyond the initial ecosystem to stocks not previously exploited or only lightly exploited, or else that bottom-up effects have occurred. Spearman's rank correlation (rs) was used to show the relationships between MTI and year, and MTI and landings.
2.4 Determination the changes in the landing profiles over timeVariation in the landing profiles (LP) over time (one decade) were defined by two statistical techniques: cluster analysis and non-metric multidimensional scaling (nMDS) using PRIMER v5 software that allow significant patterns in the data to be recognized (Clarke and Warwick, 2001). These methods were performed using the Bray-Curtis similarity index. So that prior to calculation, the landing catches (Yi) were log (x+1) transformed to reduce the contribution of the more abundant species to Yt (Jaureguizar and Milessi, 2008). Significant differences in catch profiles over time, between year groups identified by cluster and NMDS analysis, were tested by One-Way Analysis of Similarity: ANOSIM (Clarke and Warwick, 2001), whose null hypothesis is no changes in landing profiles between year groups. Based on ANOSIM, significance level and R-statistic values for pair-wise comparisons were derived, and the dissimilarity between year groups detected [R-statistic values near 1 indicate significant differences in species composition and when near 0 indicate no significant difference] (Clarke and Warwick, 2001). Eventually, to observe the changes in landing profiles over time, we performed an analysis of similarity percentages (SIMPER; Clarke, 1993) to identify the species in the landings that are most responsible for these differences using the BrayCurtis similarities between samples. Then by the similarity percentage procedure (SIMPER) the species that on average contributed strongly to any year group were quantified and ranked. For this purpose, the species that is most abundant within a group is that which contributes the most to the intragroup similarity, while a useful discriminating species is one with a consistently high contribution to the dissimilarity between groups (Clarke and Warwick, 2001). Therefore, in each year group, we categorized target species as common (if they contributed to the top 50% of the average similarity within the year group (Ⅰ, Ⅱ)), or discriminators (if they contributed to the top 70% of dissimilarity between year groups, and had a low ratio of average dissimilarity to its standard deviation) (Clarke, 1993; Clarke and Warwick, 2001; Jaureguizar and Milessi, 2008). This procedure uses the standard deviation of the Bray-Curtis dissimilarity matrix attributed to a species for all species pairs, compares it with the average contribution of a species to the dissimilarity and it allows the average contribution to be measured of a species to dissimilarity between year groups (Clarke and Warwick, 2001; Jaureguizar and Milessi, 2008). In order to observe changes in the contribution of each group to the total landings of the defined period (2002–2011), the exploited species were also categorized into crustaceans and mollusks, chondrichthyan fishes, demersal fishes, small and medium pelagic fishes, and large pelagic fishes.
3 RESULTFigure 2 shows the annual landings in the Persian Gulf, Hormuzgan province. It can be seen from the figure that, apart from a slight decrease in 2003, the total of fishing increased gradually to about 170×103 tonnes in 2011 (R=0.88, P < 0.001). Landings of crustaceans and mollusks (R=0.82, P>0.05) show two sharp peaks in 2005 and 2009, but their landings showed no marked decline. However, landings of small and medium pelagic fishes (R=0.93, P < 0.05) and large pelagic fishes (R=0.63, P < 0.051) rose significantly from 2002 to 2011. As the figure illustrates, the landings of chondrichthyes (R=0.48, P>0.05) and demersal fishes (R=0.46, P>0.05) showed a non-significant upward trend. The analysis of landings by fish groups showed that at the beginning of the time series, total landings were dominated by large demersal fishes and landings of small and medium pelagic fishes while landings of chondrichthyans, as well as mollusks and crustaceans, were less important (Fig. 2). At the end of the time series (2002–2004; Fig. 2b–f), landings of small pelagic fishes and then demersal groups represented a higher fraction of total landings (Fig. 2d, e). There was a significant decrease in MTI of the fish caught in Iranian province Hormuzgan from from 2002 to 2011 (R=-0.69, P < 0.05) (Fig. 3). The average rate of trophic level decline was around 0.11 per decade. The lowest value for MTI (3.87) was observed in 2008 that happened at the same time as the sharp peaks in landings of crustaceans and chondrichthyans. The maximum value of MTI (3.98) was recorded at the beginning of the time series, which coincided with the observed peak of large pelagic and demersal fish landings.

|
| Figure 2 Annual landings (ton 103) in Hormuzgan inshore water of Persian Gulf a. total fishing; b. crustaceans and mollusks; c. chondrichthyan fishes; d. demersal fishes; e. small and medium pelagic fishes; and f. large pelagic fishes. |

|
| Figure 3 MTL of landings in the Persian Gulf, Hormuzgan inshore water (a), long-term variation in the MTL landings (b) during the period 2002–2011 |
The FiB index showed negative values from 2002 to 2009 (Fig. 4) and positive values from 2009 to the end of the time series. The decreases in the FiB index from 2002 to 2005 and from 2006 to 2009 were driven by the decrease in MTI during this period (Fig. 4). After reaching a minimum value of-0.15 in 2005, the FiB index increased to 0.15 in 2011.

|
| Figure 4 The Persian Gulf, Hormuzgan fishing in balance index (FiB) between 2002 and 2011 |
Two main year groups were characterized using the Bray-Curtis similarity index at a high similarity level (83.5%) in the cluster analysis in the landing profile for Persian Gulf (Hormuzgan Province). The first group includes 4 years of the last decade (2008– 2011) and the second group was the rest of the years of study (Fig. 5). However, in the second group on the basis of similarity level (87%), the first year of the decade (2002) has been isolated from the rest of the years (Fig. 5). The nMDS displayed a low stress (0.02), which was sufficient to provide a useful exhibition of the data. In two dimensions, it gave the same picture as the dendrogram (Fig. 5). The agreement in the results of these two methods (cluster analysis and nMDS) confirms the validity of year groups Ⅰ and Ⅱ as defining a clear temporal trend in the landing composition from 2002 to 2011 (Fig. 5). Based on ANOSIM, the species composition was significantly different between two-year groups (P=0.005) and the R-statistic values (R=0.88) calculated by analysis of similarity indicated a relatively different species composition. Group Ⅰ defined the period from 2008 to 2011 (Fig. 5), and showed a landing composition average similarity of 90.37% (SIMPER, Table 2), and an average MTL of 3.93 (Fig. 3a). In this group, the diagnostic species that most contributed to the similarity of catch landing composition were Thunnus tonggol, Sardinella melanura and Thunnus albacores (Table 2). Group Ⅱ, (2002–2007) (Fig. 5), had an average similarity of 91.55% (Table 2) and an average MTL of 3.90 (Fig. 3a). The species that most contributed to the similarity of catch landing composition were T. tonggol, S. melanura, Benthosema pterotum (Table 2). The results of the SIMPER test to determine the species contributing the most to dissimilarity between groups Ⅰ and Ⅱ were B. pterotum (lantern fishes) with an average dissimilarity of 2.34% and maximum frequency in year groups Ⅰ (Av=6.94), and T. albacores (tuna) with an average dissimilarity of 1.44% and maximum frequency in group Ⅱ (Av=9.08).

|
| Figure 5 Dendrogram of the cluster analysis and nMDS two dimensional diagram showing resulting time blocks By Cluster and nMDS analysis, were tested using the analysis of similarity (ANOSIM, Clarke and Warwick, 2001), the significant differences in catch profiles over time, between year groups identified. |

|
The Persian Gulf is a semi-enclosed, shallow sea adjoining ocean waters through the Strait of Hormuz. Historically has been vulnerable to pollution, mainly because of its unique oceanographic characteristics. The present study clearly indicates that there have been significant changes in the structure of the fish communities and fishery landings in the Persian Gulf (Hormuzgan Province) over the past decade (2002– 2011) by an increase in the landings, FiB and decline in MTL. Pauly et al. (2000a) also found major changes in the fish communities and landings to have occurred in the northeast Atlantic, where trophic level plunged from a peak of nearly 3.7 in 1965 to only 2.8 in 1997. The increase we found in the landings data, from 122 160 t in 2002 to 169 192 t in 2011 was slightly stronger than the increase recorded by Milessi et al. (2005) for Uruguayan landings during the period 1990–2001. The increased total landings may be related in part to technical innovation and the development of new fishing gear designs. We can observe that the MTI has shown a fluctuating decline since 2005 (Fig. 3a), terminating in a moderate decline in MTI (3.98 to 3.87) over the time periods concerned. This may be, due to variation in species-group landing composition within the total landings, as, for example, the high-level carnivores and large pelagic fishes (e.g., tuna: T. tonggol) made higher contributions to the total landings than detritivores and mid-level carnivores during the time period concerned (Fig. 2a–f). The moderate decline in MTL (∆MTL=0.11 trophic level per decade) in Hormuzgan Province waters of the Persian Gulf is similar to the rate (∆MTL=0.10) reported by Pauly et al. (1998) at a global scale. Top predators and high-level carnivores such as tuna (TL=4 < ) have been largely replaced by small, fast-growing forage fish and invertebrates (TL=2.0–3.0). In marine ecosystems, the removal of large predators has cascade effects on the food webs (Jackson et al., 2001). The moderately decline of the MTI provides evidence of probable fishing down of the marine food web in this ecosystem, and its relation to technical issues (data availability and fishing behavior or extent of fishing) (Shannon et al., 2014). The development of technology and the demand of the fisheries during this decade have led to overexploitation of marine resources, particularly of the small, medium and large pelagic fishes, with the subsequent result that MTI has declined. Nonetheless, it is unclear whether this general decrease in MTI of landings and the lower TL species fished is caused by selection or by alteration of the marine food web (ecosystem collapse), although fishing activities are not the only factor that can influence the total biomass or the structure of an ecosystem. Environmental changes, modifications of some migration patterns, epidemic diseases, and economic factors also have a major impact on distribution and abundances of fish species (Hannesson, 1999). In spite of the fact that a decrease in the abundance of high trophic level species will eventually have a negative economic outcome, a reduction in MTI of the fish community may allow the system to sustain higher fishery yields overall (Hannesson, 1999). In the Persian Gulf despite the growth of the oil industry, there is no coordinated and effective regulatory framework in force to control oil pollution (Turgut, 1993). Scientists believe that under these conditions of the Persian Gulf, fish, particularly high trophic level fish, can survive, but they become inedible (Haedrich and Barnes, 1997). The low trophic-level fishes seem to be more sensitive and vulnerable to this condition. Heavy contamination, of course, will cause the death of low and high trophic levels fish directly. The effect of oil pollution on the fisheries will also cause great suffering for several fishing communities (Gulland, 1987). Our results show that the decreases in the FiB index from 2002 to 2005 were driven by the decrease reported in MTL over the 10-year time series and indicate that the fishery is unbalanced in ecological terms. After reaching its minimum value in 2005, the FiB index increased up until 2011 due to increases in landings, which suggests that the fisheries were spatially expanding into stocks previously not, or only lightly, exploited or due to the evidence of an increased possibility of the destroyed health of fisheries in this area is that by-catch species (mollusks, crustaceans and chondrichthyan fishes), which were previously discarded by traditional fisheries, are now being retained on board, increasing their importance in total landings (Milessi and Defeo, 2002). This finding is similar to that of Bhathal and Pauly (2008), who observed that the FiB index for India decreased during 1956–1968 but that it has subsequently increased. This may represent geographic over-aggregation in the sense of Pauly and Palomares (2005), although it could be argued that tuna (e.g., T. tonggol) in these analyses include a wide range of neritic fishes, overaggregate species in a taxonomic sense, rather than in a bio-geographic sense (Pauly and Palomares, 2005). The relationship between the fisheries landing composition over time and the fishery behavior allows us to assess specific causes for the observed trend in the MTL and FiB indexes (Jaureguizar and Milessi, 2008). The number of species that are distinctly identified during different fishery time periods from 2002–2011, define a clear landing profile trend. These time periods (year groups Ⅰ and Ⅱ) have shown high similarity in species composition (i.e. T. tonggol, S. melanura) and species have been identified as discriminator species (i.e. T. albacares, B. pterotum) (Tables 2 & 3). Hence, the result shows that changes in the fisheries landing composition between yeargroups Ⅰ and Ⅱ during this period (2002–2011) were more affected by these two species than by the other species. In this study, the number of species assigned to B. pterotum had significantly increased in the yeargroup Ⅰ. In contrast, T. albacores had decreased by the last years of the period. The results indicate that changes in MTL reflect changes in the community, supported by Pauly et al.'s (1998) hypothesis that showed that the landing data can be used as ecosystem indicators at a local scale. As noted by Caddy et al. (1998), by Caddy and Garibaldi (2000), a decline in MTL of the landings could in some cases result from a bottom-up effect due to an increase in nutrients in marine production systems and biomass resulting in catches of lower trophic-level (e.g., lantern fishes and shrimps) and small pelagic fishes (e.g., sardinella). Such a decline would lead to lower-TL fishes, and a decrease in the computed mean TL, even if all levels of the food web are being exploited at a constant rate (Jaureguizar and Milessi, 2008). Furthermore, MTL could be sensitive not only to fishery-induced changes at the ecosystem level but also to economic and technological factors. So, based on the provided evidence (MTI, FBI, and LP), it is probable that a long-term fishing down trend is occurring in this area, and that this trend may continue into the future. Therefore, an ecosystem-based approach and conservation programs should be prioritized for the Persian Gulf (Hormuzgan inshore waters).
5 CONCLUSIONThis study contributes to other studies within our project particularly those dealing with interactions between marine trophic levels and fisheries economics, as well as estimates of biomass for longterm environmental and sustainable fisheries management. Due to the significant and decreasing trend in MTI, our analysis concludes that fishing down marine food webs has influenced the fish community in the Persian Gulf (Hormuzgan Province).
6 ACKNOWLEDGEMENTWe are grateful to the Iranian National Organization of Fisheries through which annual landings data (2002–2011). The authors wish to thank Dr. Mohammad Momeni, Hadi Raeisi and Ehsan Ebraahimi for their help and comments.
| Bhathal B, Pauly D, 2008. Fishing down marine food webs' and spatial expansion of coastal fisheries in India, 1950-2000. Fisheries Research, 91(1): 26–34. Doi: 10.1016/j.fishres.2007.10.022 |
| Botsford L W, Castilla J C, Peterson C H, 1997. The management of fisheries and marine ecosystems. Science, 277(5325): 509–515. Doi: 10.1126/science.277.5325.509 |
| Branch T A, Watson R, Fulton E A, Jennings S, McGilliard G R, Pablico G T, Ricard D, Tracey S T, 2010. The trophic fingerprint of marine fisheries. Nature, 468(7322): 431–435. Doi: 10.1038/nature09528 |
| Caddy J F, Csirke J, Garcia S M, Grainger R J L, 1998. How pervasive is 'Fishing down marine food webs'?. Science, 282(5393): 1383. Doi: 10.1126/science.282.5393.1383a |
| Caddy J F, Garibaldi L, 2000. Apparent changes in the trophic composition of world marine harvests: the perspective from the FAO capture database. Ocean & Coastal Management, 43(8-9): 615–655. |
| Christensen V, Pauly D, 1992. ECOPATH II-a software for balancing steady-state ecosystem models and calculating network characteristics. Ecological Modelling, 61(3-4): 169–185. Doi: 10.1016/0304-3800(92)90016-8 |
| Christensen V, 2000. Indicators for marine ecosystems affected by fisheries. Marine & Freshwater Research, 51(5): 447–450. |
| Clarke K R, Warwick R M. 2001. Change in Marine Communities: an Approach to Statistical Analysis and Interpretation. 2nd edn. PRIMER-E Ltd, Plymouth. |
| Clarke K R, 1993. Non-parametric multivariate analyses of changes in community structure. Australian Journal of Ecology, 18(1): 117–143. Doi: 10.1111/aec.1993.18.issue-1 |
| FAO. 2002. Estadısticas mundiales de pesca. http://www.fao.org. |
| Greenstreet S P R, Hall S J, 1996. Fishing and the ground-fish assemblage structure in the north-western North Sea: an analysis of long-term and spatial trends. Journal of Animal Ecology, 65(5): 577–598. Doi: 10.2307/5738 |
| Gulland J A, 1987. The effect of fishing on community structure. South African Journal of Marine Science, 5(1): 839–849. Doi: 10.2989/025776187784522225 |
| Haedrich R L, Barnes S M, 1997. Changes over time of the size structure in an exploited shelf fish community. Fisheries Research, 31(3): 229–239. Doi: 10.1016/S0165-7836(97)00023-4 |
| Hannesson R, 1999. Globalisation of seafood prices: some examples. ACP-EU Fisheries Research Report, 5: 15–16. |
| IFRO. 2005. http://en.ifro.ir/portal.aspx. |
| Jackson J B C, Kirby M X, Berger W H, Bjorndal K A, Botsford L W, Bourque B J, Bradbury R H, Cooke R, Erlandson J, Estes J A, Hughes T P, Kidwell S, Lange C B, Lenihan H S, Pandolfi J M, Peterson C H, Steneck R S, Tegner M J, Warner R R, 2001. Historical overfishing and the recent collapse of coastal ecosystems. Science, 293(5530): 629–637. Doi: 10.1126/science.1059199 |
| Jaureguizar A J, Milessi A C, 2008. Assessing the sources of the fishing down marine food web process in the Argentinean-Uruguayan Common Fishing Zone. Scientia Marina, 72(1): 25–36. |
| Milessi A C, Arancibia H, Neira S, Defeo O, 2005. The mean trophic level of Uruguayan landings during the period 1990-2001. Fisheries Research, 74(1-3): 223–231. Doi: 10.1016/j.fishres.2005.02.002 |
| Milessi A C, Defeo O, 2002. Long-term impact of incidental catches by tuna longlines: the black escolar (Lepidocybium flavobrunneum) of the Southwestern Atlantic Ocean. Fisheries Research, 58(2): 203–213. Doi: 10.1016/S0165-7836(01)00365-4 |
| Morizur Y, Berrow S D, Tregenza N J C, Couperus A S, Pouvreau S, 1999. Incidental catches of marine-mammals in pelagic trawl fisheries of the northeast Atlantic. Fisheries Research, 41(3): 297–307. Doi: 10.1016/S0165-7836(99)00013-2 |
| Pauly D, Christensen V, Dalsgaard J, Froese R, Torres Jr F, 1998. Fishing down marine food webs. Science, 279(5352): 860–863. Doi: 10.1126/science.279.5352.860 |
| Pauly D, Christensen V, Froese R, Palomares M, 2000a. Fishing down aquatic food webs. American Scientist, 88(1): 46–51. Doi: 10.1511/2000.1.46 |
| Pauly D, Christensen V, Guénette S, Pitcher T J, Sumaila U R, Walters C J, Watson R, Zeller D, 2002. Towards sustainability in world fisheries. Nature, 418(6898): 689–695. Doi: 10.1038/nature01017 |
| Pauly D, Christensen V, Walters C, 2000b. Ecopath, Ecosim, and Ecospace as tools for evaluating ecosystem impact of fisheries. ICES Journal of Marine Science, 57(3): 697–706. Doi: 10.1006/jmsc.2000.0726 |
| Pauly D, Palomares M L, Froese R, Saa P, Vakily M, Preikshot D, Wallace S, 2001. Fishing down Canadian aquatic food webs. Canadian Journal of Fisheries and Aquatic Sciences, 58(1): 51–62. Doi: 10.1139/f00-193 |
| Pauly D, Palomares M L, 2005. Fishing down marine food web: it is far more pervasive than we thought. Bulletin of Marine Science, 76(2): 197–212. |
| Pauly D, Watson R, 2005. Background and interpretation of the 'Marine Trophic Index' as a measure of biodiversity. Philosophical Transactions of the Royal Society B: Biological Sciences, 360(1454): 415–423. Doi: 10.1098/rstb.2004.1597 |
| Perez N, Trujillo V, Pereda P. 1996. Discards of the trawl and long line Spanish fleets in ICES Subarea Ⅶ in 1994. ICES CM 1996/Mini: 8. international Council for the Exploration of the Sea. Copenhagen, Denmark. |
| Pinnegar J K, Jennings S, O'Brien C M, Polunin N V C, 2002. Long-term changes in the trophic level of the Celtic Sea fish community and fish market price distribution. Journal of Applied Ecology, 39(3): 377–390. Doi: 10.1046/j.1365-2664.2002.00723.x |
| Rochet M J, Trenkel V M, 2003. Which community indicators can measure the impact of fishing? A review and proposals. Canadian Journal of Fisheries and Aquatic Sciences, 60(1): 86–99. Doi: 10.1139/f02-164 |
| Shannon L, Coll M, Bundy A, Gascuel D, Heymans J J, Kleisner K, Lynam C P, Piroddi C, Tam J, Travers-Trolet M, Shin Y, 2014. Trophic level-based indicators to track fishing impacts across marine ecosystems. Marine Ecology Progress Series, 512: 115–140. Doi: 10.3354/meps10821 |
| Treganza N J C, Berrow S D, Hammond P S, Leaper R, 1997. Harbour porpoise (Phocoena phocoena L. ) by-catch in set gillnets in the Celtic Sea. ICES Journal of Marine Science, 54(5): 897–904. |
| Turgut N, 1993. Environmental legal protection and the Persian gulf war. Ankara Üniversitesi Hukuk Fakultesi Dergisi, 42(1): 81–90. |
| Vasconcellos M, Gasalla M A, 2001. Fisheries catches and the carrying capacity of marine ecosystems in southern Brazil. Fisheries Research, 50(3): 279–295. Doi: 10.1016/S0165-7836(00)00217-4 |