 2017, Vol. 35
Institute of Oceanology, Chinese Academy of Sciences
Article Information
- SUN Yanhong(孙艳红), LI Qing(李清), WANG Guiying(王贵英), ZHU Dongmei(祝东梅), CHEN Jian(陈见), LI Pei(李佩), TONG Jingou(童金苟)
- Polymorphisms in the Myostatin-1 gene and their association with growth traits in Ancherythroculter nigrocauda
- Chinese Journal of Oceanology and Limnology, 35(3): 597-602
- http://dx.doi.org/10.1007/s00343-017-5317-0
Article History
- Received Nov. 13, 2015
- accepted in principle Mar. 3, 2016


2 State Key Laboratory of Freshwater Ecology and Biotechnology, Institute of Hydrobiology, Chinese Academy of Sciences, Wuhan 430072, China
Growth, one of the most important determinants of economic value in aquaculture species, is always of primary concern during breeding (Hayes et al., 2007). To improve and develop high-quality strains, markerassisted selection (MAS) is a powerful method. Compared with traditional methods used in animals, MAS accelerates genetic improvement and the achievement of breeding goals (De-Santis and Jerry, 2007). The identification and elucidation of candidate major genes and associated markers can reveal their molecular breeding potential (Tong and Sun, 2015). Because of their abundance, single nucleotide polymorphisms (SNPs)-especially those falling within coding regions-have been widely exploited in molecular marker development and genome mapping (Liu and Cordes, 2004). A SNP marker typically involves two possible nucleotides at a given position, with the presence of a particular nucleotide possibly affecting gene expression and protein function (Vignal et al., 2002). SNPs from candidate genes are becoming important and efficient molecular markers for MAS (Spelman et al., 1999).
Myostatin (MSTN), also called GDF-8, belongs to the TGF-β superfamily. Its encoded protein is a growth factor, mainly expressed in muscle, that regulates development and growth by inhibiting cell cycle progression. Previous studies have shown that MSTN-1 has a conserved gene structure, with three exons and two introns, in both fish and mammals (McPherron and Lee, 1997; Garikipati et al., 2006; Liu et al., 2012). McPherron et al. (1997) have found that MSTN-1 negatively regulates skeletal muscle growth. Because of its role in regulating muscle development and growth, MSTN-1 has been selected as an important candidate gene in MAS for productivity and growth performance in domestic animals, including pig (Yu et al., 2007), sheep (Boman et al., 2009), chicken (Zhang et al., 2011), and rabbit (Fontanesi et al., 2011), and in some aquaculture species, such as bay scallop (Guo et al., 2011). MSTN-1 also potentially represents an important target gene for growth improvement of cultured fish (Tang et al., 2010).
Ancherythroculter nigrocauda, which belongs to subfamily Culterinae, family Cyprinidae, and order Cypriniformes (Luo, 1998), is a fish endemic to the upper reaches of the Changjiang (Yangtze) River in China. In recent years, the culture of this species has continuously expanded in China. As a consequence, the breeding of strains and varieties with excellent growth performance is desirable. Although information about genetic markers associated with growth traits may be used to identify and select individuals carrying desired traits in breeding programs, MSTN-1 polymorphisms and their possible association with growth traits have not been studied in A. nigrocauda.
In the present study, novel SNPs in MSTN-1 were identified from A. nigrocauda commercial hatchery populations. The aim of this study was to explore possible associations of MSTN-1 polymorphisms with growth traits in the cultured populations. The results of this study should be informative for the evaluation of MSTN-1 as a target gene with candidate molecular markers for MAS in A. nigrocauda.
2 MATERIAL AND METHOD 2.1 Sample collection and preparationA mixed population of A. nigrocauda was generated by crossing 10 males and 10 females that were hormonally induced during the spawning season at the Wuhan Aquaculture Science Research Institute, Hubei Province, China. Juveniles were raised under the same conditions as adults. We randomly sampled 300 individuals, including 148 fish at the 6-month stage and 152 at the 18-month stage, and measured and recorded traits such as body weight (BW), total length (TL), body length (BL), and body height (BH) at the Wuhan Aquaculture Science Research Institute. To represent fish weight, BW was measured on an electronic balance. TL was measured from the front of the head to the tip of the caudal fin. BL was measured from the front of the head to the front of the caudal fin, while BH was recorded at the tallest point on the body. Correlation coefficients among these measured traits ranged from 0.888 (TL vs. BH in the 18-month-old population) to 0.988 (TL vs. BL in the 6-month-old population). Tissues were collected from fin clips and preserved in anhydrous alcohol for DNA isolation.
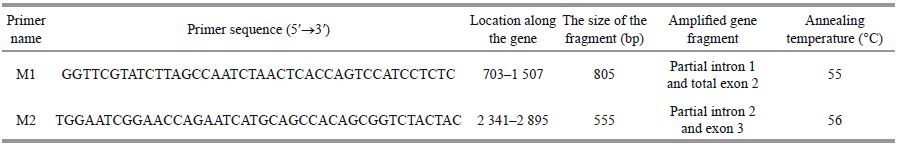
2.2 PCR conditions and SNP identificationBased on the complete MSTN-1 sequence of Culter alburnus (topmouth culter) in GenBank (accession number KC583257.1), two primer pairs were designed to amplify partial regions of the A. nigrocauda MSTN-1 gene, including partial intron 1+total exon 2 and partial intron 2+exon 3 (Table 1). PCR amplifications were performed in 25-μL reaction volumes containing 50-100 ng genomic DNA, 2.5 μmol/L of each primer, 10 mmol/L dNTPs, 10× Taq buffer (including 15 mmol/L MgCl2), and 0.5 unit Taq polymerase (TaKaRa, Japan). The amplifications were carried out using the following protocol: 95℃ for 5 min, followed by 35 cycles of 94℃ for 30 s, an optimized annealing temperature (Table 1) for 30 s, and 72℃ for 30 s, with a final extension of 72℃ for 10 min. SNP discovery and genotyping were performed by direct sequencing of the PCR products.
 |
Association analyses between MSTN-1 genotypes or combined genotypes and growth traits were performed in SPSS 13.0 under the General Linear Model (GLM), given as: Y=u+G+e, where Y is the phenotypic value of each trait, u is population mean value of the four growth traits, G corresponds to the fixed effects of genotypes of each SNP, and e is the random error effect. Because all fish were reared in the same pond and growth traits were measured at the same age, factors such as breed, site, and generation were not considered in this model. Significant differences were tested by Duncan's multiple range test using the GLM program, with P < 0.05 and P < 0.01 considered statistically significant and extremely significant, respectively. Popgene 32 software was used to calculate allelic and genotypic frequencies, to test for Hardy-Weinberg equilibrium, and to calculate observed and expected heterozygosities.
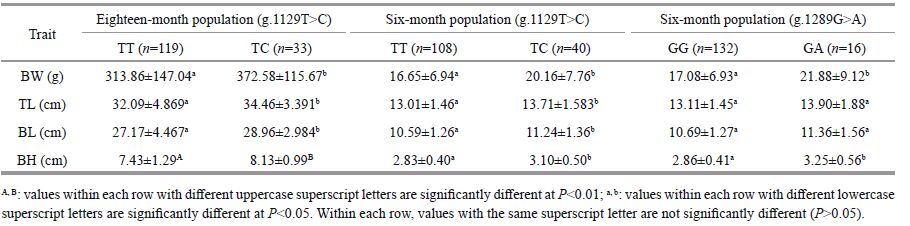
3 RESULT 3.1 Allele and genotype distributions of SNPs in the partial MSTN-1 geneAmong the 300 A. nigrocauda individuals sequenced for intron 1 and exon 2 of MSTN-1, a total of five SNPs were identified: two in intron 1 (g.935A>T and g.958A>G) and three in exon 2 (g.1129T>C, g.1289G>A, and g.1336T>C). The g.1289G>A SNP is a non-synonymous mutation causing an amino acid change (Val to Ile) at position 180. Observed and expected heterozygosities of the two populations are shown in Table 2. Homozygous genotypes for sites g.1129T>C and g.1289G>A were not detected in the two populations. In addition, g.935A>T, g.958A>G, and g.1336T>C were in complete linkage and were thus analyzed as a single locus (g.935+958+1336AAT>TGC). The generated A. nigrocauda MSTN-1 sequence was deposited at NCBI (GenBank accession number KU356181).
 |
The association analyses between genotypes of the three SNPs in MSTN-1 and growth traits TL, BL, BH, and BW in the two A. nigrocauda populations indicated that g.1129T>C was significantly associated with all four traits. For g.1129T>C, the frequency of the T allele was higher than that of the C allele (Table 2), and fish with the TC genotype had better growth values than those possessing the TT genotype (P < 0.05 or P < 0.01; Table 3, Figs. 1, 2). These results suggest that allele C had a positive effect on growth traits in the two tested populations. In addition, g.1289G>A was significantly associated with BH and BW in the 6-month-old population (Table 3, Fig. 3).
 |

|
| Figure 1 Significant differences in growth traits observed between different g.1129T>C genotypes in an 18-month-old population of Ancherythroculter nigrocauda Significant differences in BW between different genotypes g.1129T>C; significant differences in TL between different genotypes g.1129T>C; significant differences in BL between different genotypes g.1129T>C; significant differences in BH between different genotypes g.1129T>C. |

|
| Figure 2 Significant differences in growth traits observed between different g.1129T>C genotypes in a 6-monthold population of Ancherythroculter nigrocauda Significant differences in BW between different genotypes g.1129T>C; significant differences in TL between different genotypes g.1129T>C; significant differences in BL between different genotypes g.1129T>C; significant differences in BH between different genotypes g.1129T>C. |

|
| Figure 3 Significant differences in growth traits observed between different g.1289G>A genotypes in a 6-monthold population of Ancherythroculter nigrocauda Significant differences in BW between different genotypes g.1289G>A; significant differences in BH between different genotypes g.1289G>A. |
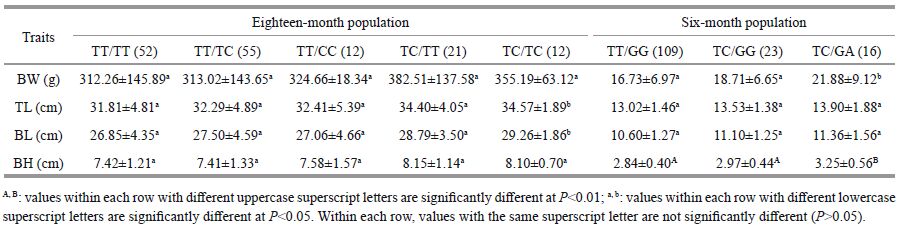
A total of five genotype combinations based on the two SNP loci were found in the 18-month-old population. With respect to some growth traits, individuals with genotype combinations TC/TC exhibited a better performance (P < 0.05, Table 4). In the 6-month-old population, we found that three genotype combinations and individuals with genotype combinations TC/GA had superior growth (P < 0.05 or P < 0.01, Table 4).
 |
In our study, all SNPs in MSTN-1 were in HardyWeinberg equilibrium (P>0.05), thus indicating that the number of individuals examined was sufficient to demonstrate a true event and that gametes combined freely (Tian et al., 2014). The absence of homozygous genotypes for g.1129T>C and g.1289G>A may be because fish with some particular genotypes may have lower survival rates (Wang et al., 2014).
Although the MSTN-1 sequence of topmouth culter has been published in GenBank, the effects of MSTN-1 SNPs on growth traits in culter have not been reported. Our study is the first to demonstrate the presence of MSTN-1 SNPs in A. nigrocauda. To our knowledge, our investigation is also the first to uncover significant associations of these polymorphisms with growth traits in commercial culter. We found that a SNP in exon 2 of MSTN-1 may have a positive impact on growth traits of A. nigrocauda at two different growth stages, with fish harboring the genotype TC showing 18.7% and 21.1% increases in body weight at the two respective stages. Those fish exhibiting superior growth performance should be retained for further selective breeding studies. An association between SNPs in exon 2 of MSTN-1 and growth traits has been also reported in some other species, such as Takifugu rubripes (Wang et al., 2014) and Chlamys farreri (Wang et al., 2010). Synonymous mutations in exons may indirectly affect gene functions via alternative splicing, messenger RNA turnover, and altered gene expression, or alternatively may be in linkage disequilibrium with one or more nearby quantitative trait loci (QTLs) for growth traits (Sun et al., 2012). In a recent study in Atlantic salmon, MSTN-1b was linked to markers mapping to chromosome 25, where a QTL for body weight has been identified (Østbye et al., 2007; Gutierrez et al., 2012; Peñaloza et al., 2013). QTL mapping and candidate gene studies need to be integrated to understand the mechanism underlying regulation of muscle growth in aquacultured fish.
According to our results, a single SNP in exon 2 of MSTN-1 may have a positive impact on growth traits in A. nigrocauda. However, a single mutation may provide limited information about the association between SNP polymorphisms and economic traits. Some association studies have demonstrated that genotypes involving two or more linked SNPs are more informative (He et al., 2008, 2010). Our analyses revealed that fish with the genotype combination TC/ TC exhibited higher TL and BL values at the 18-month stage, while fish possessing the genotype combination TC/GA had larger BW and BH values at the 6-month stage. This superior growth performance may be because of the presence of favorable C or A alleles. Those individuals with favorable alleles should be retained for further breeding studies. The allelic interactions of different SNPs and their effects on gene expression and growth traits in A. nigrocauda will be elucidated in future genetic studies.
An advantage of genic SNP markers is their location in the somatotrophic axis of protein-encoding DNA regions; in other words, they are more likely to be near QTLs that affect growth (Tao and Boulding, 2010; Peñaloza et al., 2013). The use of molecular markers linked to QTLs can provide an accurate estimation of breeding values in animals prior to acquisition of phenotypic information (Hayes et al., 2007). Without controlling for family structure, however, it may be difficult to distinguish between true SNP-trait associations and false positives. Before any application can be made to selective breeding, however, further study is needed to assess the robustness of any association between MSTN and the desired traits at the population level.
5 CONCLUSIONIn this study, five novel SNPs were identified in A. nigrocauda MSTN-1, two of which had positive effects on growth traits. Our results provide further evidence for the association of MSTN-1 polymorphisms with various growth traits. These findings should be valuable for candidate gene identification and for the use of MSTN-1 for MAS in A. nigrocauda, an economically important freshwater fish species in China.
6 ACKNOWLEDGMENTWe thank W. LI for assisting with sample preparation.
| Boman I A, Klemetsdal G, Blichfeldt T, Nafstad O, Våge D I, 2009. A frameshift mutation in the coding region of the myostatin gene (MSTN) affects carcass conformation and fatness in Norwegian white sheep (Ovis aries). Anim. Genet., 40(4): 418–422. Doi: 10.1111/age.2009.40.issue-4 |
| De-Santis C, Jerry D R, 2007. Candidate growth genes in finfish-where should we be looking?. Aquaculture, 272(1-4): 22–38. Doi: 10.1016/j.aquaculture.2007.08.036 |
| Fontanesi L, Scotti E, Frabetti A, Fornasini D, Picconi A, Russo V, 2011. Identification of polymorphisms in the rabbit (Oryctolagus cuniculus) myostatin (MSTN) gene and association analysis with finishing weight in a commercial rabbit population. Anim. Genet., 42(3): 339. |
| Garikipati D K, Gahr S A, Rodgers B D, 2006. Identification, characterization, and quantitative expression analysis of rainbow trout myostatin-1a and myostatin-1b genes. J. Endocrinol., 190(3): 879–888. Doi: 10.1677/joe.1.06866 |
| Guo L, Li L, Zhang S, Guo X, Zhang G, 2011. Novel polymorphisms in the myostatin gene and their association with growth traits in a variety of bay scallop, Argopecten irradians. Anim. Genet., 42(3): 339–340. |
| Gutierrez A P, Lubieniecki K P, Davidson E A, Lien S, Kent M602 P, Fukui S, Withler R E, Swift B, Davidson W S, 2012. Genetic mapping of quantitative trait loci (QTL) for bodyweight in Atlantic salmon (Salmo salar) using a 6.5 K SNP array. Aquaculture, 358-359: 61–70. Doi: 10.1016/j.aquaculture.2012.06.017 |
| Hayes B, Baranski M, Goddard M E, Robinson N, 2007. Optimisation of marker assisted selection for abalone breeding programs. Aquaculture, 265(1-4): 61–69. Doi: 10.1016/j.aquaculture.2007.02.016 |
| He F, Wen H S, Dong S L, Shi B, Chen C F, Wang L S, Yao J, Mu X J, Zhou Y G, 2008. Identification of single nucleotide polymorphism cytochrome P450-c19a and its relation to reproductive traits in Japanese flounder (Paralichthys olivaceus). Aquaculture, 279(1-4): 177–181. Doi: 10.1016/j.aquaculture.2008.03.057 |
| He X P, Xia J H, Wang C M, Pang H Y, Yue G H, 2010. Significant associations of polymorphisms in the prolactin gene with growth traits in Asian seabass (Lates calcarifer). Anim. Genet., 43(2): 233–236. |
| Liu L S, Yu X M, Tong J G, 2012. Molecular characterization of myostatin (MSTN) gene and association analysis with growth traits in the bighead carp (Aristichthys nobilis). Mol. Biol. Rep., 39(9): 1211–1221. |
| Liu Z J, Cordes J F, 2004. DNA marker technologies and their applications in aquaculture genetics. Aquaculture, 238(1-4): 1–37. Doi: 10.1016/j.aquaculture.2004.05.027 |
| Luo Y Y. 1998. Cultrinae. In: Chen Y Y ed. Fauna Sinica: Osteichthyes: Cypriniformes II. Sciences Press, Beijing, China. p.112-207. (in Chinese) |
| McPherron A C, Lawler A M, Lee S J, 1997. Regulation of skeletal muscle mass in mice by a new TGF-p superfamily member. Nature, 387(6628): 83–90. Doi: 10.1038/387083a0 |
| McPherron A C, Lee S J, 1997. Double muscling in cattle due to mutations in the myostatin gene. Proc. Natl. Acad. Sci. USA, 94(23): 1457–1461. |
| Østbye T K K, Wetten O F, Tooming-Klunderud A, Jakobsen K S, Yafe A, Etzioni S, Moen T, Andersen Ø, 2007. Myostatin (MSTN) gene duplications in Atlantic salmon (Salmo salar): evidence for different selective pressure on teleost MSTN-1 and-2. Gene, 403(1-2): 159–169. Doi: 10.1016/j.gene.2007.08.008 |
| Peñaloza C, Hamilton A, Guy D R, Bishop S C, Houston R D, 2013. A SNP in the 5' flanking region of the myostatin-1b gene is associated with harvest traits in Atlantic salmon (Salmo salar). BMC Genet., 14: 112. |
| Spelman R J, Garrick D J, Van Arendonk J A M, 1999. Utilisation of genetic variation by marker assisted selection in commercial dairy cattle populations. Livestock Production Science, 59(1): 51–60. Doi: 10.1016/S0301-6226(99)00003-2 |
| Sun Y H, Yu X M, Tong J G, 2012. Polymorphisms in Myostatin gene and associations with growth traits in the common carp (Cyprinus carpio L.). International Journal of Molecular Sciences, 13(12): 1956–1961. |
| Tang Y K, Li J L, Yu J H, Chen X F, Li H X, 2010. Genetic structure of MSTN and association between its polymorphisms and growth traits in genetically improved farmed tilapia (GIFT). Journal of Fishery Sciences of China, 17(1): 44–51. |
| Tao W J, Boulding E G, 2010. Associations between single nucleotide polymorphisms in candidate genes and growth rate in Arctic charr (Salvelinus alpinus L.). Heredity, 91(1): 60–69. |
| Tian C X, Yang M, Lv L Y, Yuan Y C, Liang X F, Guo W J, Song Y, Zhao C, 2014. Single nucleotide polymorphisms in Growth Hormone gene and their association with growth traits in Siniperca chuatsi (Basilewsky). Int. J. Mol. Sci., 15(4): 1029–1036. |
| Tong J G, Sun X W, 2015. Genetic and genomic analyses for economically important traits and their applications in molecular breeding of cultured fish. Science China Life Sciences, 58(2): 178–186. Doi: 10.1007/s11427-015-4804-9 |
| Vignal A, Milan D, Sancristobal M, Eggen A, 2002. A review on SNP and other types of molecular markers and their use in animal genetics. Genet. Sel. Evol., 34(3): 275–305. Doi: 10.1186/1297-9686-34-3-275 |
| Wang X L, Meng X Y, Song B, Qiu X M, Liu H Y, 2010. SNPs in the myostatin gene of the mollusk Chlamys farreri: association with growth traits. Comparative Biochemistry and Physiology Part B: Biochemistry and Molecular Biology, 155(3): 327–330. Doi: 10.1016/j.cbpb.2009.12.001 |
| Wang Y, Wang X L, Meng X Y, Wang H D, Jiang Z Q, Qiu X M, 2014. Identification of two SNPs in myostatin (MSTN) gene of Takifugu rubripes and their association with growth traits. Molecular and Cellular Probes, 28(4): 200–203. Doi: 10.1016/j.mcp.2014.03.006 |
| Yu L Z, Tang H, Wang J Y, Wu Y, Zou L L, Jiang Y L, Wu C X, Li N, 2007. Polymorphisms in the 5' regulatory region of myostatin gene are associated with early growth traits in Yorkshire pigs. Science in China Series C: Life Sciences, 50(5): 642–647. Doi: 10.1007/s11427-007-0075-4 |
| Zhang G X, Zhao X H, Wang J Y, Ding F X, Zhang L, 2011. Effect of an exon 1 mutation in the myostatin gene on the growth traits of the Bian chicken. Anim. Genet., 43(4): 458–459. |