 2017, Vol. 35
Institute of Oceanology, Chinese Academy of Sciences
Article Information
- LUO Congqiang(罗丛强), YI Chunlong(易春龙), NI Leyi(倪乐意), GUO Longgen(过龙根)
- Characterization of dominant and cellulolytic bacterial communities along the gut of silver carp Hypophthalmichthys molitrix during cyanobacterial blooms
- Chinese Journal of Oceanology and Limnology, 35(3): 624-633
- http://dx.doi.org/10.1007/s00343-017-5253-z
Article History
- Received Oct. 8, 2015
- accepted in principle Mar. 3, 2016


2 University of Chinese Academy of Sciences, Beijing 100049, China
The gastrointestinal tract of fish generally coexists with a diverse, large, and dynamic microbiota (Roeselers et al., 2011). Gut microbiota is regarded as an integral component due to long-term co-evolution with the host and provides important services to the host, such as immune defense, digestion of complex carbohydrates, and production of enterocytes (Weimer et al., 1999; Ley et al., 2008). However, opportunistic pathogens hiding in the digestive tract can cause serious diseases for the host when the gut microbiota become imbalanced (Roeselers et al., 2011; Wu et al., 2012). Therefore, a comprehensive investigation of fish gut microbiota is needed, considering their importance in host health management. Although fish are the most diverse vertebrate group, knowledge of their gut microbiota is inadequate and lags compared with that of terrestrial vertebrates (Nayak, 2010).
Silver carp (Hypophthalmichthys molitrix) is cultured intensively in Chinese lakes and reservoirs and has been widely introduced into foreign countries due to its high culture yield and excellent role controlling algal blooms (Liang et al., 1981; Ke et al., 2007). Experiments conducted in Lake Taihu and Lake Donghu demonstrated that silver carp suppress cyanobacterial blooms effectively. In addition, silver carp exhibit a high growth rate (8.14 g/d) with a high ratio of Microcystis spp. in the gut (up to 84.4% of total phytoplankton) (Chen et al., 2006; Ke et al., 2007; Zhang et al., 2008). Cellulose is the most important component in the algal cell wall. It is assumed that bacteria in gut contents (allochthonous) and mucus (autochthonous) contribute to breakdown phytoplankton in the gut because silver carp lacks the complex enzymatic system or acid hydrolysis mechanism for digesting cellulose (Bitterlich, 1985). The gut of silver carp, which is 7-9 times longer than its body (Ke et al., 2008), provides many inhabitable microenvironments for microbes to decompose polysaccharides (e.g., cellulose, hemicelluloses, and xylan) into a usable form for the host. Therefore, understanding gut microbiota is of great importance to better manage productivity and health of silver carp. The silver carp gut microbiota has been surveyed based on conventional culture-dependent and modern molecular methods (Bairagi et al., 2002; Ye et al., 2013), and bacterial strains, such as Bacillus, Acinetobacter, Aeromonas, and Microbacterium, which secrete extracellular digestive enzymes, have been detected (Bairagi et al., 2002). Nevertheless, these groups represent only a small proportion of the gut microbiota, as most microbes cannot be cultured (Bairagi et al., 2002). In recent years, significant progress has been achieved in the field of gut microbiota with the development of cultureindependent methods, such as terminal restriction fragment length polymorphism, fluorescence in situ hybridization, clone libraries, and denaturing gradient gel electrophoresis (DGGE) (Langendijk et al., 1995; Roeselers et al., 2011; Niu et al., 2011; Wu et al., 2012). These methods have been used to identify predominant gut microbiota, and many novel sequences have been discovered. However, little is known about the bacterial community structure in silver carp gut contents and mucus during a cyanobacterial bloom.
Lake Taihu is the third largest freshwater lake in China (total area: 2 338 km2, mean depth: 2 m) and is located in the southern Changjiang (Yangtze) River Delta (Jin and Hu, 2003). Due to increases in the human population, industry, and agriculture in the surrounding area, Lake Taihu is undergoing rapid entrophication (Chang, 1996). During the past few decades, cyanobacterial blooms have occurred regularly in certain regions, and planktivorous silver carp (Hypophthalmichthys molitrix) has been widely used to control these blooms (Ke et al., 2007). The purpose of this study was to use polymerase chain reaction (PCR)-DGGE and quantitative polymerase chain reaction (qPCR) methods to evaluate the structure and diversity of the dominant and cellulolytic bacterial communities in the contents and mucus along the gut of silver carp during a cyanobacterial bloom. Moreover, bacteria in the fish-associated environment were also detected.
2 MATERIAL AND METHOD 2.1 Fish breeding and sample collectionSilver carp were cultured in a cage surrounding dense algal blooms in Meiliang Bay on Lake Taihu (31°47′N, 120°22′E) from March to August 2012. Thirty silver carp were collected from the cage with a net on August 12, 2012, transported immediately to the laboratory, an anesthetized with an appropriate dose of MS-222. Twelve fish (mean weight: 175 g; total length: 19.2 cm) were selected and divided randomly into three groups for subsequent experiments. All sampled fish were aseptically dissected with sterile anatomy tools on a clean bench. The gut was removed carefully from the abdominal cavity, and the spleen, gallbladder, liver, and fat deposits surrounding the gut were removed. The gut was divided into the foregut, midgut, and hindgut, based on morphological characteristics (Xie, 1999). Each segment was opened with sterile tools, and the contents and mucus were collected as described by Wu et al. (2010). Samples from four fish in the same group were pooled. Pooling samples is a reasonable way to study the gut bacterial community of fish, and pooled samples generally well represent the gut microbiota of an individual (Romero and Navarrete, 2006). The foregut contents were collected to examine food items using the method described by Xie (1999). In addition, samples to check particle-attached bacteria (PAB) in the water, free-living bacteria (FLB) in the water, and bacteria in sediment (BS) were collected according to the methods of Niu et al. (2011) with minor modifications. Briefly, water was collected in a 2.5 L Schindler sampler at depths of 50, 100, and 150 cm. The water samples were pooled (300 mL) and sieved through a 5 μm MFTM membrane filter (SMWP04700; Millipore, Billerica, MA, USA) to collect PAB, and all of the 5 μm filtrate was filtered through a 0.22 μm Nuclepore Track-Etched Membrane (111106; Whatman, Dassell, Germany) to collect the FLB fraction. Sediment samples were collected using a Petersen grab, and the unconsolidated surface sediment was gathered. All samples were stored at-80℃ until analysis.
2.2 DNA extraction and PCR amplificationDNA from all samples was extracted using a Bacterial DNA Kit (Omega stool DNA kit, D4015-02; Bio-tek, Winooski, VT, USA) according to the manufacturer's protocol. The QIAamp quick PCR purification kit (28104; Qiagen, Valencia, CA, USA) was used for purification. DNA purity and concentration were checked with a Nanodrop ND-1000 spectrophotometer (NanoDrop Technology, Wilmington, DE, USA). The purified DNA was used to amplify the variable V3 region of the bacterial 16S rRNA with the general 341F and 518R primers published by Muyzer et al. (1993). The PCR reactions were performed in 50 μL mixtures containing 180 μmol/L of each dNTP, 2 mmol/L MgCl2, 0.2 μmol/L of each primer, 5 U Taq DNA polymerase, 1× PCR buffer, and 50 ng template DNA. Touchdown PCR was carried out with a T100TM thermal cycler (Bio-Rad, Hercules, CA, USA) : initial incubation at 94℃ for 5 min, 35 cycles at 94℃ for 1 min, 1 min at annealing temperature (10 cycles at 67-58℃ and 25 cycles at 58℃), and 72℃ for 1 min; followed by a 10 min extension at 72℃. PCR products were checked by 1.5% agarose gel electrophoresis at 150 V for 30 min.
2.3 Denaturing gradient gel electrophoresisPCR products containing approximately equal amounts of DNA in each sample were identified by 8% polyacrylamide gel electrophoresis (acrylamide: biscarylamide 37.5:1) in 1×TAE buffer (20 mmol/L Tris, 10 mmol/L acetic acid, and 5 mmol/L EDTA, pH 8.0) in a 42%-58% denaturing gradient. DGGE was performed with a Decod system at 60℃ for 12 h at 85 V. After electrophoresis, the gel was stained with 1:1 000 GelRedTM (Biofilm, 41003; Biotium, Hayward, CA, USA) nucleic acid staining solution for 25 min, and the gel was photographed using the Bio Image System (Syngene, Cambridge, UK) under UV light.
2.4 DGGE band sequencingAll visible DGGE bands were excised with a sterile razor and immersed overnight at 4℃ in 40 μL sterile deionized water after mashing with a pipet tip. The supernatant was used as the template for PCR amplification with the 341F (without a GC clamp) and 518R primers following the procedure described above. PCR products were checked by 1.5% agarose gel electrophoresis and purified with a Gel Extraction Kit (Omega, D2500-01; Bio-Tek). The purified DNA was cloned directly into the PMD18-T plasmid vector system (D101A; TaKaRa Bio, Shiga, Japan) according to the manufacturer's instructions, and selected clones were sequenced by Beijing Yingjun Biotechnology (Beijing, China).
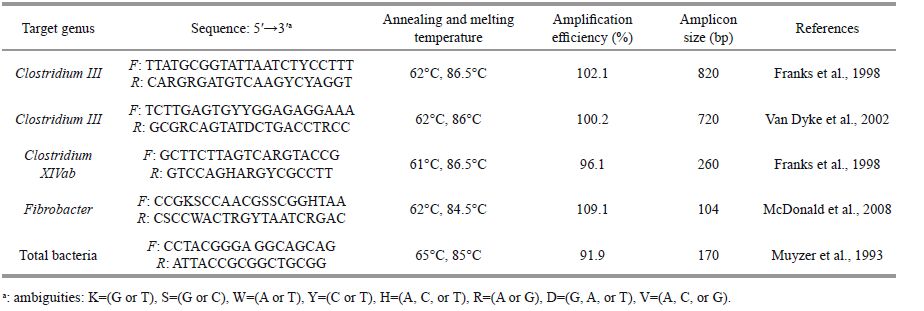
2.5 qPCR analysis of nucleic acids from gut contents and mucusqPCR was used to quantify the abundance of cellulolytic bacteria (Clostridium Ⅰ, Clostridium Ⅲ, Clostridium XIVab, and Fibrobacter) and total bacteria based on the 16S rRNA gene with genusspecific primer pairs (Table 1). Amplification was performed using the Step One PlusTM Real-time PCRsystem (Applied Biosystems, Foster City, CA, USA). Each system contained 40 ng DNA template, 12.5 μL of 1× SYBR real-time PCR premix (QPS-101B; Toyobo, Tokyo, Japan), 0.4 μL (10 μmol/L) of each primer, and sterile water added to a final volume of 25 μL. The cycling conditions were 95℃ for 10 min, followed by 43 cycles of 95℃ for 10 s, annealing at the temperatures displayed in Table 1 for 15 s, and 72℃ for 35 s. Specificity was evaluated based on melting curves obtained from continuous acquisition of fluorescence at 60-94℃ with 0.5℃ intervals after amplification. The purified plasmid DNAs were used as standards for the qPCR assays. Amplification efficiency was determined from the given slopes in the SDS software package (Applied Biosystems), and all values were 90%-110%. Plasmid copy number was calculated using the method described in Li et al. (2009).
 |
A DGGE fingerprinting profile was used to construct a binary matrix by assigning values for absence (0) or presence (1) of the bands to evaluate the bacterial communities in the different samples. Pairwise similarities between samples were quantified using the Dice similarity coefficient (SD). The SD values were used to construct a dendrogram with the unweighted pair group method with arithmetic average (UPGMA) using the NTSYS ver. 2.10e program (Exeter Software, Setauket, NY, USA) (Niu et al., 2011).
Relative band intensity in the DGGE profile was analyzed using Quantity-One ver. 4.6.2 software (Bio-Rad). Two indices were calculated to estimate changes in the bacterial community: (1) species richness (R) was calculated based on the total number of bands, and (2) the Shannon index (H′) was calculated based on a previous reference (Niu et al., 2011). Means of the diversity and richness values were compared using the independent t-test. Twoway analysis of variance was used to analyze the effects of sample type (contents vs. mucus) and gut region (foregut, midgut, and hindgut) on cellulolytic bacteria using SPSS 13.0 for Windows software (SPSS Inc., Chicago, IL, USA). A P-value < 0.05 was considered significant.
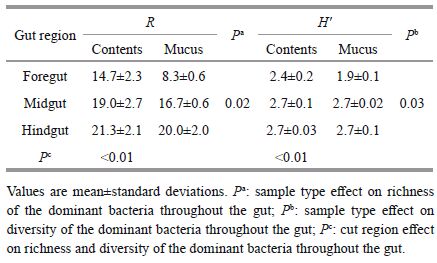
3 RESULT 3.1 Bacterial community structure in the gut and fish-associated environmentsThe dominant and cellulolytic bacteria communities in the gut of silver carp and fish-associated environments (PAB, FLB, and BS) during a cyanobacterial bloom were investigated. The guts of silver carp were green and full of algae. Moreover, microscopic observations revealed that the gut contents were composed primarily of Microcystis (up to 92.2%), followed by Melosira, detritus, and sporadic zooplankton. The DGGE patterns of the bacterial communities are shown in Fig. 1 and were composed of two independent DGGE profiles (A and B). Twentynine distinct bacterial bands were observed. Based on the DGGE patterns and subsequent statistical analysis, the bacterial communities among gut regions and ample types were significantly different (Table 2). Species richness (R) and diversity (H) increased significantly (P < 0.05) from the foregut to the hindgut, both in the gut contents and mucus samples. Species richness and diversity were higher in the contents than in the mucus within the same gut segment.

|
| Figure 1 Denaturing gradient gel electrophoresis (DGGE) profiles of the 16S rRNA gene fragments from the different silver carp gut segments and fish-associated environmental samples (A and B) Sample types: FC: foregut contents, FM: foregut mucus, MC: midgut contents, MM: midgut mucus, HC: hindgut contents, HM: hindgut mucus, PAB: particle-attached bacteria in water, FLB: free living bacteria in water, and BS: bacteria in sediment. Each sample type had three replicates. Sample HC1 was used as a marker for DGGE profiles A and B. |
 |
The cluster analysis showed that bacteria from the gut samples were clustered into one group, except the FM samples, whereas the adjacent gut regions clustered more closely than the segregated gut regions (Fig. 2). Moreover, the PAB showed higher similarity with gut samples than with the BS and FLB.

|
| Figure 2 Cluster analysis of the silver carp gut bacterial communities based on the denaturing gradient gel electrophoresis profiles |
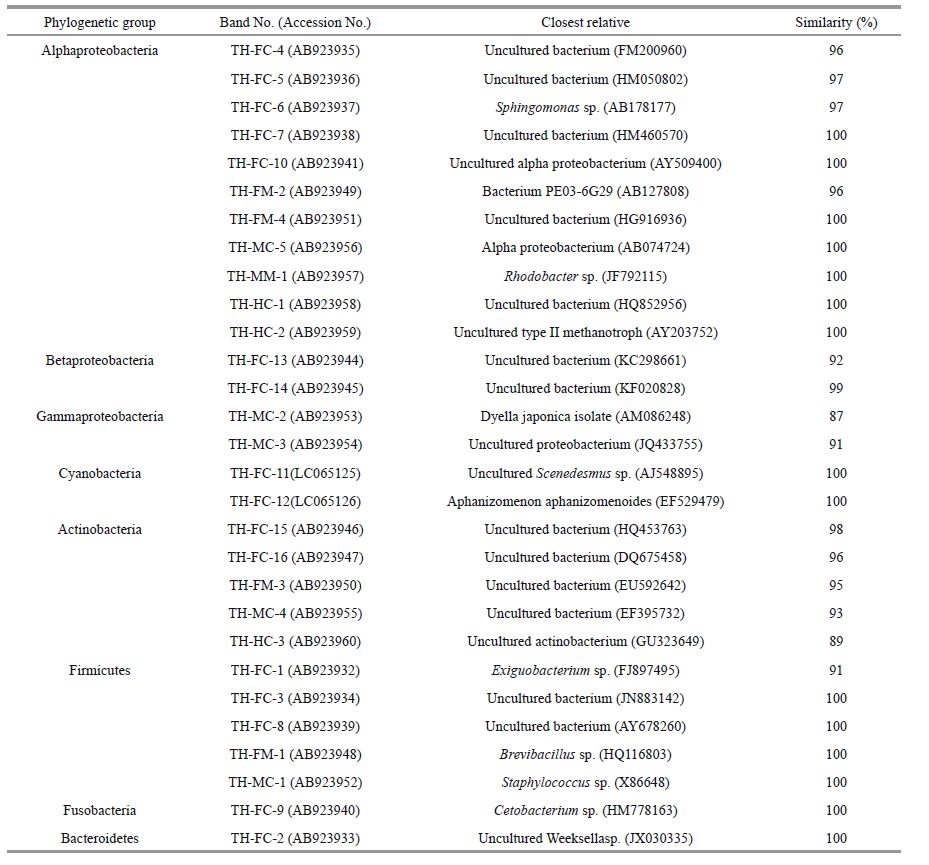
Twenty-nine sequences obtained from different gut samples in this study were blasted in GenBank. All samples were collected from Lake Taihu, so the first band from the foregut contents (FC) sample was labeled TH-FC-1, followed by TH-FC-2, and THFC-3; the other bands were named in a similar manner. The results show that the silver carp gut microbiota were closely related to the following eight groups: Alphaproteobacteria (11 bands), Betaproteobacteria (2 bands), Gammaproteobacteria (2 bands), Actinobacteria (5 bands), Firmicutes (5 bands), Cyanobacteria (2 bands), Fusobacteria (1 band), and Bacteroidetes (1 band) (Table 3). Most of the sequences (19 bands) were identified as unable to be cultured. The relative abundance of the phylotype in the DNA template mixture is positively correlated to the corresponding band intensity (Fromin et al., 2002). According to this correlation, Betaproteobacteria (band TH-FC-13) were more abundant in the contents than in the mucus throughout the gut, whereas Clostridium XI (TH-FC-8) dominated the mucus samples. Firmicutes (TH-MC-1), Gammaproteobacteria (TH-FC-3), and Actinobacteria (TH-FC-4) were uniquely detected in the midgut and hindgut samples. Furthermore, novel bands for Alphaproteobacteria (TH-HC-1 and TH-HC-2) and Actinobacteria (TH-HC-3) were detected in hindgut samples. The phylogenetic relationships of the bacteria retrieved from the gut are shown in Fig. 3.
 |

|
| Figure 3 Neighbor-joining phylogenetic tree showing the phylogenic relationships of the 29 partial 16S rRNA gene sequences obtained from the silver carp gut Bootstrap values based on 1 000 re-samplings display the significance of the interior nodes and are shown at the branch points; only bootstrap values >50 are given. Scale bar represents a 2% sequence variation. Different symbols represent sequences affiliated to different phylogenetic groups: solid circle: Alphaproteobacteria; hollow diamond: Bacteroidetes; solid diamond: Gammaproteobacteria; inverted triangle: Betaproteobacteria; hollow square: Fusobacteria; triangle: Actinobacteria; hollow circle: Cyanobacteria; solid square: Firmicutes. |
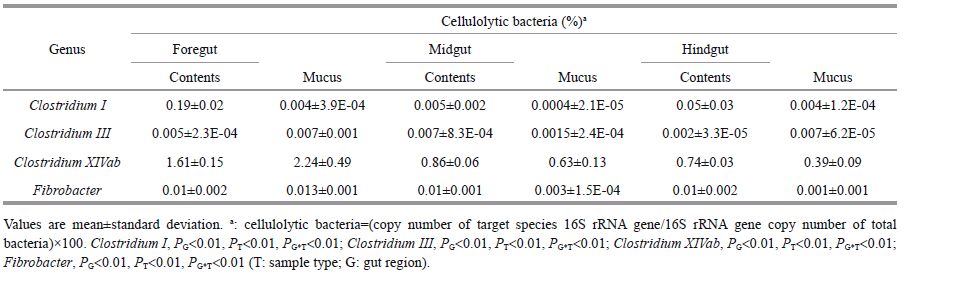
The qPCR results revealed that four cellulolytic bacterial genera (Clostridium Ⅰ, Clostridium Ⅲ, Clostridium XIVab, and Fibrobacter) showed the highest abundance in the silver carp gut, and they were significantly different among gut regions and sample types (Table 4). Clostridium XIVab was the most prevalent among the four cellulolytic species and was >0.39% of all gut bacteria at all sites. The percentages of Clostridium Ⅰ, Clostridium Ⅲ, and Fibrobacter were < 0.02% in most samples, except Clostridium Ⅰ in the foregut samples (0.19%). The highest proportions of Clostridium Ⅲ, Clostridium XIVab, and Fibrobacter were observed in FM, whereas the highest Clostridium Ⅰ proportion was in foregut contents.
 |
Although studies on silver carp gut microbiota have been sporadically reported, the microbial ecology of the silver carp gut during a cyanobacterial bloom is poorly understood. We found that silver carp maintain a dynamic and diverse microbiota throughout the gut and that sample types and gut regions had a pronounced effect on these bacterial communities.
The DGGE banding patterns and statistical analysis demonstrated that the composition of the bacterial community increased significantly in contents and mucus throughout the different gut regions. Additionally, all bacterial species that appeared in the foregut and midgut were found in the hindgut, suggesting that the hindgut might be the most ideal sampling region for further study of silver carp gut microbiota. Regulation of bacterial communities along the gut can be attributed to several factors, such as enzyme activities, nutrient concentrations, flow rate, and pH (Palframan et al., 2002; Nayak, 2010). The silver carp foregut contents were more heterogeneous and included intact phytoplankton and detritus from the diet, whereas the hindgut contents were more homogeneous and included well-digested material (Stevens and Hume, 1996). Moreover, pH in the silver carp gut increased continuously from the foregut to the hindgut, whereas digestive enzyme (e.g., trypsin and amylase) activities decreased (Bitterlich, 1985). Thus, differences in the microenvironment along the gut might lead to variations in gut microbiota. In the present study, samples of the same type (contents or mucus) between adjacent gut regions were more similar and clustered together in the phylogenetic analysis. However, the opposite results are obtained from animals with a complex digestive tract that is divided into a stomach, small intestine, caecum, and large intestine (Kohl et al., 2014; Malmuthuge et al., 2014). This finding suggests that this trait of silver carp is unique for stomachless fish because their digestive tract is simple, and the internal environment changes gradually along the gut (Bitterlich, 1985).
The bacterial community in the gut contents was quite different from that in the mucus, which is consistent with previous reports (Kim et al., 2007; Wu et al., 2010), in which content-associated bacterial communities were distinct from bacteria that adhered to the mucus. The bacterial communities in the contents and mucus samples were consistent at the taxonomic level, but differed in their abundance. For example, the representative sequence affiliated with Betaproteobacteria (band TH-FC-13) was more abundant in content samples, whereas Clostridium XI (band TH-FC-8) was dominant in mucus samples. In addition, bacterial diversity and richness were higher in contents than those in local mucus. The distribution of gut microbiota in the contents and mucus are determined by the host and the biological characteristics of the bacteria, as only bacteria than can resist the extreme conditions (e.g., low pH, fast flow, and digestive enzyme activity) in the gut can successfully colonize the gut's epithelial surface (Nayak, 2010).
In our study, Proteobacteria and Firmicutes were the dominant species in all gut samples; the same conclusion was reported for bighead carp, common carp, and grass carp (Ye et al., 2013; Li et al., 2015). Among the Firmicutes detected, two bands (TH-FC-3 and TH-FC-8) showed high similarity to Clostridium XI, which ferments polysaccharides and proteins (Lubbs et al., 2009). Actinobacteria has been reported to occupy only a small proportion of the fish gut (Li et al., 2015). However, we that more Actinobacteria than Firmicutes in the silver carp gut. PCR biases were excluded as a cause of this discrepancy, as the primers (F341/R518) used here are more sensitive for Firmicutes than for Actinobacteria (Wu et al., 2012). This finding confirms that Actinobacteria are naturally prevalent in the silver carp gut. The UPGMA analysis suggested that the Actinobacteria in the silver carp gut may have mainly originated from PAB.
It is well known that cyanobacteria are an important food source for silver carp (Ke et al., 2007). In our study, two clear bands associated with cyanobacteria were detected in the DGGE profiles and likely support their importance as food sources for silver carp. However, bright bands were also observed in the hindgut, indicating that digestion in the foregut might be incomplete. Kamjunke et al. (2002) reported that growth of silver carp continuing Microcystis was equal to that of starving fish. The photosynthetic activities of cyanobacteria fully recover after passing through the silver carp gut (Zeng et al., 2014). Incomplete digestion in the silver carp gut could be blamed for the lack of a complex enzyme system (Bitterlich, 1985). However, Zhu and Deng (1983) used a radioisotope tracer technique and reported that silver carp absorb some nutrients from Microcystis. Although it is unclear whether silver carp gain nutrition from consuming cyanobacteria, the ability to ingest cyanobacteria as a food resource is a competitive advantage for other species during cyanobacterial blooms.
The qPCR analysis showed that the abundance of Clostridium Ⅰ, Clostridium Ⅲ, Clostridium XIVab, and Fibrobacter varied along the silver carp gut. Empirically, Fibrobacter have been reported to only exist in the mammalian gastrointestinal tract (Kobayashi et al., 2008). However, the relatively high Fibrobacter copies detected in our study indicate that Fibrobacter may occupy a wider ecological distribution and their abundance suggests a potential role degrading cellulosic material in the silver carp gut. The four cellulolytic bacteria detected here not only regulate gut pH (Williams and Coleman, 1992) but also ferment polysaccharides to end-products that provide the host with additional nutrients (McDonald, 2002). Generally, the high ratio of short chain fatty acids (SCFAs) is in line with the high abundance of cellulolytic species (Mountfort et al., 2002). The copy numbers of the four cellulolytic bacteria were consistently higher in foregut samples, suggesting their function in cellulose breakdown and that SCFAs are mainly produced in the silver carp foregut.
The highest proportion of the four cellulolytic species examined here (Clostridium Ⅰ, Clostridium Ⅲ, Clostridium XIVab, and Fibrobacter) accounted for 1.8% of all bacteria in the foregut. This is much lower than that reported in the terrestrial vertebrate gastrointestinal tract. Stevenson and Weimer (2007) discovered that the bovine rumen contains >2% Fibrobacter, whereas other reports showed that members of Clostridium Ⅰ and Clostridium XIVab represent 29.7% of all sequences in the giant panda gut based on pyrosequencing (Zhu et al., 2011). According to Weimer et al. (1999), the abundance of cellulolytic bacteria depends on the concentration of cellulose in the diet. Cellulose is the major component of the terrestrial plant cell wall, representing 30% of the dry weight of a plant, whereas cellulose generally makes up only 1%-8% of marine plants and algae (Choat and Clements, 1998). Thus, the discrepancy in cellulose abundance between the digestive tract of terrestrial and aquatic vertebrates leads to the main difference in cellulolytic bacteria.
5 CONCLUSIONThe current study demonstrated that the dominant and cellulolytic bacteria communities were significantly different among the gut regions and between contents and mucus in the silver carp gut. In addition, some characteristics of bacterial structure may be unique for such stomachless fish. For example, the bacteria were more similar between adjacent gut regions and became more homogenous along the digestive tract. Although Microcystis is not an ideal food source for silver carp because of its poor digestibility, the high abundance of cellulolytic bacteria in the digestive tract could help silver carp obtain energy from Microcystis. Therefore, we conclude that the silver carp gut microbiota may be of help during times of low food availability, such as during cyanobacterial blooms.
| Bairagi A, Ghosh K S, Sen S K, Ray A K, 2002. Enzyme producing bacterial flora isolated from fish digestive tracts. Aquacult. Int., 10(2): 109–121. Doi: 10.1023/A:1021355406412 |
| Bitterlich G, 1985. Digestive enzyme pattern of two stomachless filter feeders, Silver carp, Hypophthalmichthys molitrix Val., and bighead carp, Aristichthys nobilis rich. J. Fish Biol., 27(2): 103–112. Doi: 10.1111/jfb.1985.27.issue-2 |
| Chang W Y B, 1996. Major environmental changes since 1950 and the onset of accelerated eutrophication in Taihu Lake, China. Acta Palaeontol. Sinica, 35(2): 155–174. |
| Chen J, Xie P, Zhang D W, Ke Z X, Yang H, 2006. In situ studies on the bioaccumulation of microcystins in the phytoplanktivorous silver carp (Hypophthalmichthys molitrix) stocked in Lake Taihu with dense toxic Microcystis blooms. Aquaculture, 261(3): 1026–1038. Doi: 10.1016/j.aquaculture.2006.08.028 |
| Choat J H, Clements K D, 1998. Vertebrate herbivores in marine and terrestrial environments: a nutritional ecology perspective. Annu. Rev. Ecol. Syst., 29(1): 375–403. Doi: 10.1146/annurev.ecolsys.29.1.375 |
| Franks A H, Harmsen H J M, Raangs G C, Jansen G J, Schut F, Welling G W, 1998. Variations of bacterial populations in human feces measured by fluorescent in situ hybridization with group-specific 16S rRNA-Targeted oligonucleotide probes. Appl. Environ. Microbiol., 64(9): 1336–1345. |
| Fromin N, Hamelin J, Tarnawski S, Roesti D, JourdainMiserez K, Forestier N, Teyssier-Cuvelle S, Gillet F, Aragno M, Rossi P, 2002. Statistical analysis of denaturing gel electrophoresis (DGE) fingerprinting patterns. Environ. Microbiol., 4(11): 634–643. Doi: 10.1046/j.1462-2920.2002.00358.x |
| Jin X C, Hu X Z, 2003. A comprehensive plan for treating the major polluted regions of lake Taihu, China. Lakes Reserv. Res. Manage., 8(3-4): 217–230. Doi: 10.1111/lre.2003.8.issue-3-4 |
| Kamjunke N, Schmidt K, Pflugmacher S, Mehner T, 2002. Consumption of cyanobacteria by roach (Rutilus rutilus): useful or harmful to the fish?. Freshwater Biol., 47(2): 243–250. Doi: 10.1046/j.1365-2427.2002.00800.x |
| Ke Z X, Xie P, Guo L G, Liu Y Q, Yang H, 2007. In situ study on the control of toxic Microcystis blooms using phytoplanktivorous fish in the subtropical Lake Taihu of China: a large fish pen experiment. Aquaculture, 265(1-4): 127–138. Doi: 10.1016/j.aquaculture.2007.01.049 |
| Ke Z X, Xie P, Guo L G, 2008. Phenotypic plasticity in gut length in the planktivorous filter-feeding silver carp (Hypophthalmichthys molitrix). The Scientific World Journal, 8: 169–175. Doi: 10.1100/tsw.2008.37 |
| Kim D H, Brunt J, Austin B, 2007. Microbial diversity of intestinal contents and mucus in rainbow trout (Oncorhynchus mykiss). J. Appl. Microbiol., 102(6): 1654–1664. Doi: 10.1111/jam.2007.102.issue-6 |
| Kobayashi Y, Shinkai T, Koike S, 2008. Ecological and physiological characterization shows that Fibrobacter succinogenes is important in rumen fiber digestionReview. Folia Microbiol., 53(3): 195–200. Doi: 10.1007/s12223-008-0024-z |
| Kohl K D, Miller A W, Marvin J E, Mackie R, Dearing M D, 2014. Herbivorous rodents (Neotoma spp.) harbour abundant and active foregut microbiota. Environ. Microbiol, 16(9): 1869–1878. |
| Langendijk P S, Schut F, Jansen G J, Raangs G C, Kamphuis G R, Wilkinson M H, Welling G M, 1995. Quantitative fluorescence in situ hybridization of Bifidobacterium spp. with genus-specific 16S rRNA-targeted probes and its application in fecal samples. Appl. Environ. Microbiol., 61(8): 1069–1075. |
| Ley R E, Lozupone C A, Hamady M, Knight R, Gordon J I, 2008. Worlds within worlds: evolution of the vertebrate gut microbiota. Nat. Rev. Microbiol., 6(10): 776–788. Doi: 10.1038/nrmicro1978 |
| Li M, Penner G B, Hernandez-Sanabria E, Oba M, Guan L L, 2009. Effects of sampling location and time, and host animal on assessment of bacterial diversity and fermentation parameters in the bovine rumen. J. Appl. Microbiol., 107(6): 1924–1934. Doi: 10.1111/jam.2009.107.issue-6 |
| Li T T, Long M, Gatesoupe F J, Zhang Q Q, Li A H, Gong X N, 2015. Comparative analysis of the intestinal bacterial communities in different species of carp by pyrosequencing. Microb. Ecol., 69(1): 25–36. Doi: 10.1007/s00248-014-0480-8 |
| Liang Y L, Melack J M, Wang J, 1981. Primary production and fish yields in Chinese ponds and lakes. Trans. Am. Fish. Soc., 110(3): 346–350. Doi: 10.1577/1548-8659(1981)110<346:PPAFYI>2.0.CO;2 |
| Lubbs D C, Vester B M, Fastinger N D, Swanson K S, 2009. Dietary protein concentration affects intestinal microbiota of adult cats: a study using DGGE and qPCR to evaluate differences in microbial populations in the feline gastrointestinal tract. J. Anim. Physiol. Anim. Nutr., 93(1): 113–121. Doi: 10.1111/jpn.2009.93.issue-1 |
| Malmuthuge N, Griebel P J, Guan L L, 2014. Taxonomic identification of commensal bacteria associated with the mucosa and digesta throughout the gastrointestinal tracts of preweaned calves. Appl. Environ. Microbiol., 80(6): 1021–1028. |
| McDonald J E, Lockhart R J, Cox M J, Allison H E, McCarthy A J, 2008. Detection of novel Fibrobacter populations in landfill sites and determination of their relative abundance via quantitative PCR. Environ. Microbiol., 10(5): 1310–1319. Doi: 10.1111/j.1462-2920.2007.01544.x |
| Mountfort D O, Campbell J, Clements K D, 2002. Hindgut fermentation in three species of marine herbivorous fish. Appl. Environ. Microbiol., 68(3): 1374–1380. Doi: 10.1128/AEM.68.3.1374-1380.2002 |
| Muyzer G, de Waal E C, Uitterlinden A G, 1993. Profiling of complex microbial populations by denaturing gradient gel electrophoresis analysis of polymerase chain reactionamplified genes coding for 16S rRNA. Appl. Environ. Microbiol., 59(3): 695–700. |
| Nayak S K, 2010. Role of gastrointestinal microbiota in fish. Aquac. Res., 41(11): 1553–1573. Doi: 10.1111/are.2010.41.issue-11 |
| Niu Y, Shen H, Chen J, Xie P, Yang X, Tao M, Ma Z M, Qi M, 2011. Phytoplankton community succession shaping bacterioplankton community composition in Lake Taihu, China. Water Res., 45(14): 1169–1182. |
| Palframan R J, Gibson G R, Rastall R A, 2002. Effect of pH and dose on the growth of gut bacteria on prebiotic carbohydrates in vitro. Anaerobe, 8(5): 287–292. Doi: 10.1006/anae.2002.0434 |
| Roeselers G, Mittge E K, Stephens W Z, Parichy D M, Cavanaugh C M, Guillemin K, Rawls J F, 2011. Evidence for a core gut microbiota in the zebrafish. ISME J., 5(10): 1595–1608. Doi: 10.1038/ismej.2011.38 |
| Romero J, Navarrete P, 2006. 16S rDNA-based analysis of dominant bacterial populations associated with early life stages of coho salmon (Oncorhynchus kisutch). Microb. Ecol.. |
| Stevens C E, Hume I D. 1996. Comparative Physiology of the Vertebrate Digestive System. 2nd edn. Cambrige University Press, Cambridge, UK. 400p. |
| Stevenson D M, Weimer P J, 2007. Dominance of Prevotella and low abundance of classical ruminal bacterial species in the bovine rumen revealed by relative quantification realtime PCR. Appl. Microbiol. Biotechnol., 75(1): 165–174. Doi: 10.1007/s00253-006-0802-y |
| Van Dyke M I, McCarthy A J, 2002. Molecular biological detection and characterization of Clostridium populations in municipal landfill sites. Appl. Environ. Microbiol., 68(4): 1049–1053. |
| Weimer P J, Waghorn G C, Odt C L, Mertens D R, 1999. Effect of diet on populations of three species of ruminal cellulolytic bacteria in lactating dairy cows. J. Dairy Sci., 82(1): 122–134. Doi: 10.3168/jds.S0022-0302(99)75216-1 |
| Williams A G, Coleman G S. 1992. The Rumen Protozoa. Springer, New York, USA. 719p. |
| Wu S G, Gao T H, Zheng Y Z, Wang W W, Cheng Y Y, Wang G T, 2010. Microbial diversity of intestinal contents and mucus in yellow catfish (Pelteobagrus fulvidraco). Aquaculture, 303(1-4): 1–7. Doi: 10.1016/j.aquaculture.2009.12.025 |
| Wu S G, Wang G T, Angert E R, Wang W W, Li W X, Zou H, 2012. Composition, diversity, and origin of the bacterial community in Grass carp intestine. PLoS One, 7(2): e30440. Doi: 10.1371/journal.pone.0030440 |
| Xie P, 1999. Gut contents of silver carp, Hypophthalmichthys molitrix, and the disruption of a centric diatom, Cyclotella, on passage through the esophagus and intestine. Aquaculture, 180(3-4): 295–305. Doi: 10.1016/S0044-8486(99)00205-7 |
| Ye L, Amberg J, Chapman D, Gaikowski M, Liu W T, 2013. Fish gut microbiota analysis differentiates physiology and behavior of invasive Asian carp and indigenous American fish. ISME J., 8(3): 541–551. |
| Zeng Q F, Gu X H, Mao Z G, 2014. In situ growth and photosynthetic activity of Cyanobacteria and phytoplankton dynamics after passage through the gut of silver carp (Hypophthalmichthys molitrix), bighead carp (Aristichthys nobilis), and Nile tilapia (Oreochromis niloticus). Hydrobiologia, 736(1): 51–60. Doi: 10.1007/s10750-014-1886-5 |
| Zhang X, Xie P, Huang X P, 2008. A review of nontraditional biomanipulation. The Scientific World Journal, 8: 1184–1196. Doi: 10.1100/tsw.2008.144 |
| Zhu H, Deng W J, 1983. Studies of the digestion of algae by fish:Ⅱ. Microcystis aeruginosa and Euglena sp. Digestion and absorbed by silver carp and bighead. Transactions of the Chinese Ichthyological Society(3): 77–91. |
| Zhu L F, Wu Q, Dai J Y, Zhang S N, Wei F W, 2011. Evidence of cellulose metabolism by the giant panda gut microbiome. Proc. Natl. Acad. Sci. USA, 108(43): 1714–1719. |