 2017, Vol. 35
Institute of Oceanology, Chinese Academy of Sciences
Article Information
- LIU Zenghong(刘增宏), CHEN Xingrong(陈幸荣), SUN Chaohui(孙朝辉), WU Xiaofen(吴晓芬), LU Shaolei(卢少磊)
- A comparison of Argo nominal surface and near-surface temperature for validation of AMSR-E SST
- Chinese Journal of Oceanology and Limnology, 35(3): 712-721
- http://dx.doi.org/10.1007/s00343-017-5330-3
Article History
- Received Nov. 18, 2015
- accepted in principle Feb. 16, 2016


2 Second Institute of Oceanography, State Oceanic Administration, Hangzhou 310012, China;
3 National Marine Environmental Forecasting Center, Beijing 100081, China
SST (sea surface temperature) is an important parameter for both ocean and climate studies. It is a key indicator of climate change and has been widely used in studies related to the El Niño Southern Oscillation (e.g., Suarez and Schopf, 1988; McPhaden, 1999; Wang and Weisberg, 2000; Chen and Cane, 2008). In the past few decades, satellite-measured SST has become a major data source because of global coverage and high temporal resolution. Infrared satellite sensors measure the "skin" of the ocean at depths on the order of 0.01 mm, whereas microwave sensors detect "subskin" temperatures corresponding to the top 1 mm of the ocean (Donlon et al., 2002; Donlon and GHRSST-PP Science Team, 2005). Infrared SST is affected by cloudy conditions, and its biases are mainly attributable to diurnal variability, water vapor attenuation, atmospheric aerosols, and incomplete removal of cloud contamination (Brown et al., 1985; McClain, 1989; Emery et al., 1994; Gohil et al., 1994). Regional SST analyses indicate that diurnal SST warming can exceed 6℃ (Flament et al., 1994; Gentemann and Minnett, 2008; Gentemann et al., 2008; Merchant et al., 2008). The magnitude of this warming depends on both solar insolation and wind speed (Gentemann et al., 2003). In contrast, microwave SST is unaffected by aerosols and can be retrieved in the presence of clouds simultaneously with wind speed, columnar water vapor, cloud water content, and rain rate (Wentz, 1998; Wentz et al., 2000).
For validation of satellite-retrieved SSTs, many studies have used buoy-measured SST and XBTs (expendable bathythermographs), which gives subsurface "bulk" SST (Pandey and Kniffen, 1991; Bhat et al., 2004; Gentemann et al., 2004; Muraleedharan et al., 2004; Parekh et al., 2007) from depths 1 to 5 m. In situ sensors are typically at depth 1 m. Skin temperatures are not easily measured in situ, and few skin observations are available from only dedicated radiometers (e.g., Minnett, 2003; Gentemann and Minnett, 2008). Below this thin skin layer, during daytime, weak wind speed and increased solar insolation can cause thermal stratification over several meters of the upper ocean (Price et al., 1986; Yokoyama et al., 1995). Udaya Bhaskar et al. (2009) compared the Advanced Microwave Scanning Radiometer for the Earth Observing System (AMSR-E) and TRMM Microwave Imager (TMI) SSTs with Argo nominal surface temperatures for the first time over the Indian Ocean. The results show a substantial spatial match and correlation between Argo foundation and satelliteretrieved SSTs. The former SST, used by Udaya Bhaskar TVS et al. (2009), is typically measured at depths 3-10 dbar, which might have a large difference relative to the skin or satellite-retrieved subskin SST. To avoid degrading salinity accuracy by ingesting sea surface contaminants, a CTD pump is turned off at ~5 dbar beneath the sea surface as the Argo float ascends. To meet Argo requirements of near-surface temperature (NST hereafter) for validation of satellite SST retrievals, many floats are now designed to sample NST without an extra sensor. This type of float can measure about 5~15 NSTs at depths 0-5 dbars without pumping water into the conductivity cell (this does not measure near-surface conductivity). In addition, Sea-Bird Electronics Inc. has developed a Surface Temperature Salinity (STS) sensor, which is a second, free-flushed, conductivity sensor used in conjunction with their main SBE-41 CP CTD installed on Argo floats (Larson et al., 2008). The STS sensor samples at 1 Hz concurrently with the SBE-41 CP CTD near the float park depth (960-980 dbar) and again in the upper ocean (3-20 dbar), just before the SBE-41 CP is turned off. After that, the STS sensor continues sampling through the ocean surface for ~500 s as the float prepares to transmit data.
In this paper, we compare AMSR-E retrieved SSTs with Argo nominal surface (~5 m) temperatures and non-pumped NSTs from Argo profiling floats over the global oceans, to evaluate the advantages of Argo NST data for validation of satellite-retrieved SST. The dataset used is described in Section 2. In Section 3, we compare Argo NSTs with Argo 5-m temperatures over the global oceans, and then compare AMSR-E SST/Argo 5-m and AMSR-E SST/Argo NST related to wind speed and columnar water vapor. Finally, a summary and discussion are given in Section 4.
2 DATA AND METHOD 2.1 AMSR-E microwave SSTsAMSR-E is a passive microwave sensor that was launched with the Aqua satellite in May 2002 (and failed in October 2011), with resolution of 5.4-56 km. The Aqua satellite had a sun synchronous orbit that crossed the equator at 13:30 local time on northward (ascending) passes and 01:30 on southward (descending) passes. The SST product from AMSR-E has been validated by in situ measurements from high-resolution XBTs, TSGs (hull-mounted thermosalinographs), and Argo profiling floats (Dong et al., 2006; Emery et al., 2006; Uday Bhaskar et al., 2009).
AMSR-E retrieved SST data are provided by Remote Sensing Systems, Santa Rosa, CA, USA (Wentz, 1998; Wentz and Meissner, 2000). These data are released on a 0.25°×0.25° grid of global extent (±89.875°). We used a daily-pass SST product of version 7 in this study. This updated version of product has been validated by Gentemann (2014) using in situ measurements from ships, moored and drifting buoys, meanwhile a vapor correction is suggested for all users prior to performing any analysis. AMSR-E also provides data of wind speed (measured in the 10.7 and 18.7 GHz channels), columnar water vapor, columnar cloud water, and rain rate. AMSR-E has an onboard two-point calibration system that continuously compensates for variations in radiometer gain and noise temperature. The two vital components of this calibration system are the cold mirror and hot reference load. Wentz et al. (2003) used coincident measurements from collocated observations from other satellites to develop a system for predicting the temperature of the hot reference. One limitation in this procedure is that in situ data for calibration of satellite data are more concentrated in the tropics than extratropics.
2.2 Argo near-surface temperaturesThe Argo NST data used are non-pumped temperatures collected from the APEX, PROVOR, and ARVOR profiling floats over the global oceans from October 2008 through March 2015. The data are assembled and available on the National Oceanography Centre (UK) ftp site (ftp://ftp.pol.ac.uk/pub/bodc/argo/NST/). These floats with the capacity to sample non-pumped NSTs are deployed or processed by the British Oceanographic Data Centre, Indian National Centre for Ocean Information Services, Japan Meteorological Agency, Scripps Institution of Oceanography, and University of Washington. We used a total of 497 such floats and 36 740 NSTs (Fig. 1). Of these floats, 69 floats are equipped with a STS sensor, which can sample through the ocean surface for ~500 s as the float prepares to transmit data. As a result, 10 024 NSTs are observed by floats with a STS sensor. Each non-pumped temperature profile usually contains several measurements at depths 0-5 dbars. In our analysis, the uppermost temperature above 1 dbar in each profile was selected for comparison with satellite-retrieved SST.

|
| Figure 1 Locations of Argo NSTs over the global oceans from October 2008 through March 2015 |
Each Argo NST was matched to AMSR-E measurements collected on the same day, 1 day prior, and 1 day after. A spatial window of 0.8°×0.5° was chosen to ensure more than one satellite SST retrieval to match a corresponding Argo profile location for each satellite pass. The selected AMSR-E observations measured by ascending and descending passes on each day were then linearly interpolated to the Argo NST location. To reduce temperature difference between Argo NST and AMSR-E SST, a temporal window of ±3 h was selected to pair Argo and AMSR-E observations following the study done by Gentemann (2014). If more than one interpolated AMSR-E retrieval fell into the temporal window, an average AMSR-E observation was computed; otherwise, the nearest SST was selected. As a result, 1 473 pairs (786 pairs for ascending passes and 687 for descending) were selected for our analysis. Figure 2 shows the geographic distribution of the AMSR-E/Argo data pairs used. Most of these pairs were (1) between 10°S and 45°S in the southern Pacific Ocean, (2) in the southern Indian Ocean, and (3) in the South Atlantic.

|
| Figure 2 Matchups between ascending/descending passes of AMSR-E and Argo NSTs Times of passes are indicated by color swaths. Locations of data pairs for ascending passes and descending passes are marked by blank triangles and filled dots, respectively. |
To evaluate the advantage of Argo NST against nominal Argo surface temperature (~5 m), the nearsurface and 5-m temperatures (all Argo pressure data have been converted to depth) were compared for each Argo temperature profile over the global oceans from October 2008 through March 2015. Figure 3 shows the temperature difference between Argo nearsurface and 5-m temperatures (interpolated from the corresponding non-pumped temperature profile), binaveraged per local time. A pronounced warming of average 0.04±0.26℃ was observed between 10:00 and 18:00 local time, with maximum warming ~0.08±0.36℃ during 14:00-15:00 local time. This is clearly attributable to diurnal surface warming effects. A slight cooling before 08:00 can also be observed, by an average ~0.04±0.21℃. By comparison between Argo NST and 5-m temperature, remarkable differences and a diurnal cycle are evidenced in Fig. 3, owing to solar radiation. A diurnal SST cycle is induced by the formation and destruction of nearsurface warm layers (Fairall et al., 1996; Kawai and Wada, 2007), and the reported amplitude of this cycle is typically as much as 4℃ (e.g., Stramma et al., 1986). Our analysis indicates depth-dependent diurnal stratifications even in the upper 5 m of the ocean, and the maximum warming and cooling can be as much as 4.5 and 4.3℃, respectively.

|
| Figure 3 Argo NSTs minus Argo 5-m temperatures, binaveraged based on local time Error bars are twice the standard error for each bin. |
Scatter plots between AMSR-E ascending (daytime) and descending (nighttime) pass SSTs and Argo NSTs/5-m temperatures are shown in Fig. 4. Overall, AMSR-E SSTs observed by ascending and descending passes show good agreement with Argo NST over the global oceans, with correlation coefficients 0.994 and 0.993, respectively. The root mean square error (RMSE) for AMSR-E daytime SST/Argo NST is 0.569℃, approximately 0.005℃ smaller than the nighttime SST. Both RMSEs are comparable to the results of other studies (Wentz et al., 2000; Uday Bhaskar et al., 2009) in which TAO/ TRITON, moored buoy, drifting buoy, and XBT data were used for validation. The RMSE for AMSR-E daytime SST/Argo 5-m temperature is 0.711℃ (~0.14℃ higher than that for daytime SST/Argo NST). The RMSE for nighttime SST/Argo 5-m temperature is very comparable to that of nighttime SST/Argo NST. It is evident that daytime warming can increase the temperature difference between Argo NST and Argo nominal surface temperature, and Argo NST is expected to be superior to that temperature for validation of satellite-retrieved SST.

|
| Figure 4 Scatterplots of Argo NSTs against AMSR-E (a) ascending and (b) descending pass SSTs, and Argo 5-m temperatures against AMSR-E (c) ascending and (d) descending pass SSTs, during October 2008-October 2011 Dashed line shows linear regression. |
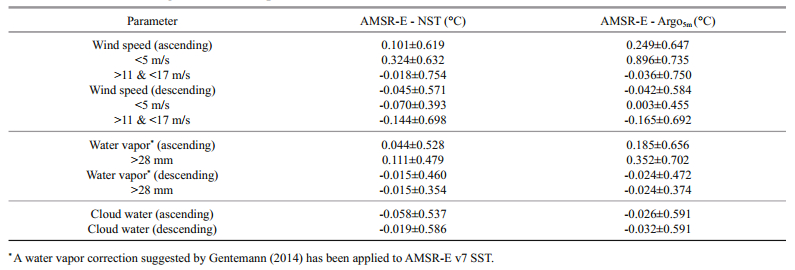
To evaluate improvement of Argo NST vs. Argo nominal surface temperature for validation of satellite-retrieved SST, temperature differences between AMSR-E SST and Argo 5-m/near-surface temperatures were bin-averaged for a range of physical parameters, including not only satelliteretrieved wind speed and columnar water vapor but also columnar cloud water. It is seen in Figure 5 that the greatest temperature differences were for weak wind speeds (10.7 GHz channel was used here) during ascending passes (daytime). For wind speeds < 5 m/s, AMSR-E SST is warmer than either the Argo 5-m temperature or NST, with greater warming when compared with the 5-m temperature. This warming bias increases with decreasing wind speed, reaching a maximum of about 2.5 and 1.1℃ at 1 m/s for AMSR-E SST/Argo 5-m and AMSR-E SST/Argo NST, respectively. Mean warming is 0.896±0.735℃ and 0.324±0.632℃, respectively (Table 1), for low wind speeds during daytime. In contrast, temperature differences for descending passes (nighttime) do not reveal a warming tendency at weak wind speeds. The temperature differences during nighttime are much smaller than during daytime for wind speeds < 5 m/s, with means about 0.003±0.455℃ and-0.070±0.393℃, respectively. Previous studies (Donlon et al., 2002; Gentemann et al., 2004; Dong et al., 2006) found that the temperature difference between skin and bulk had large variations at low wind speed. Under weak wind, especially during daytime with solar insolation, warming in the top 1-2 m of the ocean increases (Soloviev and Lukas, 1997; Gentemann et al., 2009). When winds are stronger than 5 m/s, both the AMSR-E SST/Argo 5-m temperature and AMSR-E SST/Argo NST differences decrease or become invisible, because wind-induced mixing homogenizes the upper few meters of ocean. Solar heating is greatest near the ocean surface, favoring near-surface thermal stratification, whereas wind-driven mixing erodes diurnal stratification (Merchant et al., 2008). When wind speeds are between 11 and 17 m/s, AMSR-E nighttime SST tends to be lower than Argo 5-m temperatures and NSTs by about 0.165±0.692℃ and 0.144±0.698℃ on average. Such a cool bias has also been revealed in the TMI SSTs at wind speed above 12 m/s (Wentz, 1996). In Southern Ocean, a cool bias was also found in the AMSR-E SSTs at higher wind speed (Dong et al., 2006). The cool bias could be explained by errors in the calibration at high latitudes (most high wind speed occurs at high latitudes). High wind speed is likely to affect surface roughness, and particularly to favor the formation of foam and spray, which, in turn, leads to high sea surface emissivity.

|
| Figure 5 AMSR-E (a) ascending and (b) descending SSTs minus Argo NSTs, and AMSR-E (c) ascending and (d) descending SSTs minus Argo 5-m temperatures, versus wind speed measured by AMSR-E (measured in 10.7 GHz channel) Bin-averaged temperature differences based on wind speed are marked by dashed lines. Error bars are twice the standard error for each bin. |
|
To minimize the effect of diurnal warming, we exclude matchups during 10:00-16:00 following Gentemann (2014). Figure 6 shows the temperature differences (daytime and nighttime SSTs are combined) after excluding the observations affected by diurnal warming events. The warming biases are invisible when wind speeds are < 5 m/s, furthermore, the temperature biases for both AMSR-E/Argo 5-m and AMSR-E/Argo NST are nearly centered on 0℃ varying with wind speed except for wind speeds between 12 and 16 m/s where a slightly cool bias is still visible.

|
| Figure 6 AMSR-E SST minus (a) Argo NST and (b) Argo 5-m temperature, versus wind speed after excluding the matchups during 10:00-16:00 Bin-averaged temperature differences based on wind speed are marked by dashed lines. Error bars are twice the standard error for each bin. |
Columnar water vapor is the next greatest effect on temperature differences, as found in some studies (Dong et al., 2006; Castro et al., 2008; Gille, 2012). Following the result from Gentemann (2014), a water vapor correction has been applied to all AMSR-E SSTs before validation. The correction has only a slight impact on the data at low water vapors. Figure 7 indicates that AMSR-E daytime SST is warmer than Argo 5-m temperature and NST when columnar water vapor is >28 mm, whereas nighttime SST is nearly consistent with both Argo 5-m and NST, regardless of change in columnar water vapor. The temperature difference for AMSR-E/Argo 5-m shows a greater warm bias than that of AMSR-E/Argo NST when columnar water vapor is >28 mm (with means about 0.352±0.702℃ and 0.111±0.479℃, respectively). This warm bias between AMSR-E SST and Argo 5-m temperature increases with increasing columnar water vapor at high atmospheric water vapor. Radiation is affected by the absorption and emission of water vapor and cloud liquid water in the atmosphere, so brightness temperatures measured by satellites differ from surface-measured brightness temperatures (Wentz and Meissner, 1999). With the increase of water vapor during daytime, especially at low latitudes, columnar water vapor is expected to have a greater impact on the calibration of AMSR-E SST retrievals. However, our analysis does not show a warming tendency for nighttime AMSR-E retrievals, as indicated by Gille (2012) using Argo 5-m temperatures under low columnar water vapor. This is clear evidence of the diurnal warming effect on the satellite observations. After excluding the matchups between 10:00 and 16:00, the temperature differences both for AMSR-E/Argo 5-m and AMSR-E/Argo NST are close to 0℃ (Fig. 8). It indicates that the diurnal warming events should be masked before validation of satellite SST retrievals.

|
| Figure 7 Same as Fig. 5 but against columnar water vapor measured by AMSR-E |

|
| Figure 8 Same as Fig. 6 but against columnar water vapor after excluding the matchups during 10:00-16:00 |
Finally, temperature differences between AMSR-E SST and Argo 5-m temperature/Argo NST and their relationships to columnar cloud water are analyzed after excluding the diurnal warming events. There are no obvious SST/Argo temperature differences across the entire range of cloud water (Fig. 9).

|
| Figure 9 Same as Fig. 6 but against columnar cloud water |
In this study, a first-time comparison of Argo nominal surface (5 m) and near-surface temperatures for validation of AMSR-E SST over the global oceans was made. Difference between Argo NST and 5-m temperature was examined before validation for AMSR-E SST retrievals. The difference between Argo NST and 5-m temperature indicates a diurnal cycle caused by solar radiation, with maximum warming occurred between 14:00 and 15:00. Comparisons between Argo NST/5-m temperature and AMSR-E SST indicate that the satellite-retrieved SSTs and in situ observations agree fairly well. However, the RMSE of temperature difference of AMSR-E SST/Argo 5-m temperature can be ~0.14℃ greater than that of AMSR-E SST/Argo NST owing to the effect of diurnal warming.
Subsequently, we compared Argo NST/Argo 5-m temperature and AMSR-E SST as related to wind speed, columnar water vapor, and columnar cloud water. An obvious warm bias owing to diurnal warming was observed only between AMSR-E daytime SST and Argo observations at low wind speed. This warm bias is more significant for AMSR-E SST/Argo 5-m matchups. For wind speeds between 11 and 17 m/s, a cool bias has been revealed from AMSR-E nighttime SST and Argo observations, which is related to surface roughness and the formation of foam and spray. For columnar water vapors are >28 mm, a warm bias was also observed only for daytime AMSR-E SST/Argo observations, with a greater bias between AMSR-E SST and Argo 5-m temperature. This warm bias is also caused by effect of diurnal warming. It is suggested that the effect of diurnal warming should be excluded before validation of satellite SST retrievals.
Our analysis implies that Argo NST data are superior to nominal Argo surface temperature for validation of satellite-retrieved SST, so the former might be used to calibrate microwave or infrared SST more effectively over the global oceans.
Data matchups were very sparse and not well distributed (most matchups were in the Southern Hemisphere), either because only a small proportion of the Argo floats have the capacity to sample NST data or because there were no NST data before October 2008 over the global oceans (the Aqua satellite was launched in May 2002 and failed in October 2011). Nevertheless, the advantages of Argo NST over Argo nominal surface temperature for validation of satellite SST retrievals have been demonstrated. The Argo real-time ocean observing array is expected to be maintained for a long period. Therefore, it should provide more accurate NST data for validation and calibration of satellite retrievals over the global oceans, if more floats with the capacity for near-surface sampling are deployed.
5 ACKNOWLEDGMENTThe Argo near-surface temperature data were collected and made freely available by the National Oceanography Centre. AMSR-E data were produced by Remote Sensing Systems and sponsored by the NASA Earth Science REASoN DISCOVER Project and AMSR-E Science Team. Data are available at www.remss.com.
| Bhat G S, Veechi G A, Gadgil S, 2004. Sea surface temperature of the Bay of Bengal derived from the TRMM Microwave Imager. J. Atmos. Ocean. Tech., 21(8): 1283–1290. Doi: 10.1175/1520-0426(2004)021<1283:SSTOTB>2.0.CO;2 |
| Brown O B, Brown J W, Evans R H, 1985. Calibration of advanced very high resolution radiometer infrared observations. J. Geophys. Res., 90(6): 11667–11677. |
| Castro S L, Wick G A, Jackson D L, Emery W J, 2008. Error characterization of infrared and microwave satellite sea surface temperature products for merging and analysis. J. Geophys. Res., 113(C3): C03010. Doi: 10.1029/2006JC003829 |
| Chen D K, Cane M A, 2008. El Niño prediction and predictability. J. Comput. Phys., 227(7): 3625–3640. Doi: 10.1016/j.jcp.2007.05.014 |
| Dong S F, Gille S T, Sprintall J, et al, 2006. Validation of the advanced microwave scanning radiometer for the earth observing system (AMSR-E) sea surface temperature in the Southern Ocean. J. Geophys. Res., 111(C4): C04002. Doi: 10.1029/2005JC002934 |
| Donlon C J, GHRSST-PP Science Team. 2005. The GHRSSTPP product user manual, GDS-v1. 5 report. International GHRSST-PP Project Office, Exeter, UK. |
| Donlon C J, Minnett P J, Gentemann C, Nightingale T J, Barton I J, Ward B, Murray M J, 2002. Toward improved validation of satellite sea surface skin temperature measurements for climate research. J. Clim., 15(4): 353–369. Doi: 10.1175/1520-0442(2002)015<0353:TIVOSS>2.0.CO;2 |
| Emery W J, Brandt P, Funk A, Böning C, 2006. A comparison of sea surface temperatures from microwave remote sensing of the Labrador Sea with in situ measurements and model simulations. J. Geophys. Res., 111(C12): C12013. Doi: 10.1029/2006JC003578 |
| Emery W J, Yu Y Y, Wick G A, Schluessel P, Reynolds R W, 1994. Correcting infrared satellite estimates of sea surface temperature for atmospheric water vapor attenuation. J. Geophys. Res., 99(C3): 5219–5236. Doi: 10.1029/93JC03215 |
| Fairall C W, Bradley E F, Rogers D P, Edson J B, Young G S, 1996. Bulk parameterization of air-sea fluxes for tropical ocean-global atmosphere coupled-ocean atmosphere response experiment. J. Geophys. Res., 101(C2): 3747–3764. Doi: 10.1029/95JC03205 |
| Flament P, Firing J, Sawyer M, Trefois C, 1994. Amplitude and horizontal structure of a large diurnal sea surface warming event during the Coastal Ocean Dynamics Experiment. J. Phys. Oceanogr., 24(1): 124–139. Doi: 10.1175/1520-0485(1994)024<0124:AAHSOA>2.0.CO;2 |
| Gentemann C L, Donlon C J, Stuart-Menteth A, Wentz F J, 2003. Diurnal signals in satellite sea surface temperature measurements. Geophys. Res. Lett., 30(3): 1140. Doi: 10.1029/2002GL016291 |
| Gentemann C L, Minnett P J, Le Borgne P, Merchant C J, 2008. Multi-satellite measurements of large diurnal warming events. Geophys. Res. Lett., 35(22): L22602. Doi: 10.1029/2008GL035730 |
| Gentemann C L, Minnett P J, Ward B, 2009. Profiles of ocean surface heating (POSH): a new model of upper ocean diurnal warming. J. Geophys. Res., 114(C7): C07017. Doi: 10.1029/2008JC004825 |
| Gentemann C L, Minnett P J, 2008. Radiometric measurements of ocean surface thermal variability. J. Geophys. Res., 113(C8): C08017. Doi: 10.1029/2007JC004540 |
| Gentemann C L, Wentz F J, Mears C A, Smith D K, 2004. In situ validation of Tropical Rainfall Measuring Mission microwave sea surface temperatures. J. Geophys. Res., 109(C4): C04021. Doi: 10.1029/2003JC002092 |
| Gentemann C L, 2014. Three way validation of MODIS and AMSR-E sea surface temperatures. J. Geophys. Res., 119(4): 2583–2598. Doi: 10.1002/2013JC009716 |
| Gille S T, 2012. Diurnal variability of upper ocean temperatures from microwave satellite measurements and Argo profiles. J. Geophys. Res., 117(C11): C11027. Doi: 10.1029/2012JC007883 |
| Gohil B S, Mathur A K, Pandey P C, 1994. An algorithm for sea surface temperature estimation from ERS-1 ATSR using moisture dependent coefficients: a simulation study. Int. J. Remote Sens., 15(5): 1161–1167. Doi: 10.1080/01431169408954151 |
| Kawai Y, Wada A, 2007. Diurnal sea surface temperature variation and its impact on the atmosphere and ocean: a review. J. Oceanogr., 63(5): 721–744. Doi: 10.1007/s10872-007-0063-0 |
| Larson N L, Janzen C D, Murphy D J. 2008. STS: an instrument for extending ARGO temperature and salinity measurements through the sea surface. In: Poster Presented at the 2008 Ocean Sciences Meeting. Orlando, Florida. |
| McClain E P, 1989. Global sea surface temperatures and cloud clearing for aerosol optical depth estimates. Int. J. Remote Sens., 10(4): 763–769. |
| McPhaden M J, 1999. Genesis and evolution of the 1997-98 El Niño. Science, 283(5404): 950–954. Doi: 10.1126/science.283.5404.950 |
| Merchant C J, Filipiak M J, Le Borgne P, Roquet H, Autret E, Piollé J F, Lavender S, 2008. Diurnal warm-layer events in the western mediterranean and european shelf seas. Geophys. Res. Lett., 35(4): L04601. Doi: 10.1029/2007GL033071 |
| Minnett P J, 2003. Radiometric measurements of the seasurface skin temperature: the competing roles of the diurnal thermocline and the cool skin. Int. J. Remote Sens., 24(24): 5033–5047. Doi: 10.1080/0143116031000095880 |
| Muraleedharan P M, Pankajakshan T, Harikrishnan M, 2004. Validation of multi-channel scanning microwave radiometer on-board Oceansat-Ⅰ. Curr. Sci., 87(3): 370–376. |
| Pandey P C, Kniffen S, 1991. Linear retrieval, validation and mapping of the sea surface temperature over western midlatitude North Pacific using Seasat SMMR data. Int. J. Remote Sens., 12(12): 2493–2511. Doi: 10.1080/01431169108955283 |
| Parekh A, Sharma R, Sarkar A, 2007. A comparative assessment of surface wind speed and sea surface temperature over the Indian Ocean by TMI, MSMR, and ERA-40. J. Atmos. Ocean. Tech., 24(6): 1131–1142. Doi: 10.1175/JTECH2021.1 |
| Price J F, Weller R A, Pinkel R, 1986. Diurnal cycling: observations and models of the upper ocean response to diurnal heating, cooling, and wind mixing. J. Geophys. Res., 91(C7): 8411–8427. Doi: 10.1029/JC091iC07p08411 |
| Soloviev A, Lukas R, 1997. Observation of large diurnal warming events in the near-surface layer of the western equatorial Pacific warm pool. Deep Sea Res. Part Ⅰ, 44(6): 1055–1076. Doi: 10.1016/S0967-0637(96)00124-0 |
| Stramma L, Cornillon P, Weller R A, Price J F, Briscoe M G, 1986. Large diurnal sea surface temperature variability: satellite and in situ measurements. J. Phys. Oceanogr., 16(5): 827–837. Doi: 10.1175/1520-0485(1986)016<0827:LDSSTV>2.0.CO;2 |
| Suarez M J, Schopf P S, 1988. A delayed action oscillator for ENSO. J. Atmos. Sci., 45(21): 3283–3287. Doi: 10.1175/1520-0469(1988)045<3283:ADAOFE>2.0.CO;2 |
| Udaya Bhaskar T V S, Rahman S H, Pavan I D, Ravichandran M, Nayak S, 2009. Comparison of AMSR-E and TMI sea surface temperature with Argo near-surface temperature over the Indian Ocean. Int. J. Remote Sens., 30(10): 2669–2684. Doi: 10.1080/01431160802555796 |
| Wang C Z, Weisberg R H, 2000. The 1997-98 El Niño Evolution Relative to Previous El Niño Events. J. Clim., 13(2): 488–501. Doi: 10.1175/1520-0442(2000)013<0488:TENOER>2.0.CO;2 |
| Wentz F J, Gentemann C, Smith D, Chelton D, 2000. Satellite measurements of sea surface temperature through clouds. Science, 288(5467): 847–850. Doi: 10.1126/science.288.5467.847 |
| Wentz F J, Gentemann J C, Ashcroft P. 2003. On-orbit calibration of AMSR-E and the retrieval of ocean products. In: Paper presented at 12th Conference on Satellite Meteorology and Oceanography. American Meteorological Society, Long Beach, CA. |
| Wentz F J, Meissner T. 1999. AMSR ocean algorithm, version 2. RSS Technical Report 121599A. Remote Sensing Systems, Santa Rosa, Calif. |
| Wentz F J, Meissner T. 2000. AMSR ocean algorithm, version 2. Report Number 121599A-1. Remote Sensing Systems, Santa Rosa, CA. |
| Wentz F J. 1996. AMSR ocean algorithm, RSS Technical Report 120296. Remote Sensing System, Santa Rosa, CA. |
| Wentz F J. 1998. Algorithm theoretical basis document: AMSR ocean algorithm. RSS Technical Report 050198. Remote Sensing System, Santa Rosa, CA. |
| Yokoyama R, Tanba S, Souma T, 1995. Sea surface effects on the sea surface temperature estimation by remote sensing. Int. J. Remote Sens., 16(2): 227–238. Doi: 10.1080/01431169508954392 |