 2017, Vol. 35
Institute of Oceanology, Chinese Academy of Sciences
Article Information
- SHI Ce(史策), LIU Ying(刘鹰), YI Mengmeng(衣萌萌), ZHENG Jimeng(郑纪盟), TIAN Huiqin(田会芹), DU Yishuai(杜以帅), LI Xian(李贤), SUN Guoxiang(孙国祥)
- Comparison of time-restricted and ad libitum self-feeding on the growth, feeding behavior and daily digestive enzyme profiles of Atlantic salmon
- Chinese Journal of Oceanology and Limnology, 35(4): 729-736
- http://dx.doi.org/10.1007/s00343-017-5346-8
Article History
- Received Dec. 16, 2015
- accepted in principle Jan. 28, 2016
- accepted for publication May. 2, 2016


2 University of Chinese Academy of Sciences, Beijing 100049, China;
3 National & Local Joint Engineering Laboratory of Ecological Mariculture, Qingdao 266071, China;
4 Dalian Ocean University, School of Marine Science and Environment Engineering, Dalian 116023, China
In fish, appetite has a degree of flexibility both within and between days. Self-feeding systems employ the learning ability of fish which allows them to feed whenever they desire. These devices, which are considered to enhance growth and reduce food wastage (Azzaydi et al., 1998b), are used as feeder systems in a growing number of fish-farming facilities.
With the increasing use of automatic feeders, fish farmers are progressively more interested in controlling the feeding schedule in response to production requirements. Various self-feeding strategy has been investigated in species capable of manipulating self-feeding devices, with conflicting results. In European sea bass (Dicentrarchus labrax) (Azzaydi et al., 1998b) and rainbow trout (Oncorhynchus mykiss) (Boujard and Médale, 1994), time-restricted self-feeding was reported to yield higher growth rates compared to free access self-feeding, whereas a study by Noble et al. (2007) reported that growth, feed conversion ratio (FCR) and size heterogeneity of rainbow trout were unaffected by the self-feeding regimes.
In animals, feeding and the light/dark cycle are crucial factors in the entrainment of biological rhythms. Periodical feeding not only affects growth performance and feeding behavior, but also synergizes other physiological variables. Atlantic salmon (Salmo salar) is a carnivorous species in which the proteolysis of ingested food takes place initially in the stomach via pepsin, and digestion is carried out in the intestine via hydrolytic enzymes (lipase, carbohydrase and trypsin). The activity of the principal digestive enzymes, such as proteases and amylase, is one of the most important parameters in determining the effectiveness of a given diet (Mohanta et al., 2008). It is widely assumed that time-restricted feeding allows animals to adjust their feeding behavior and physiological variables to maximize food acquisition and nutrient utilization, leading to better growth performance (Comperatore and Stephan, 1987; Vera et al., 2007). Nevertheless, few studies have focused on the effects of feeding regimes on the daily rhythm of digestive enzymes (Vera et al., 2007), and the assumption referred to above has rarely been tested in long-term experiments. Thus, it is of interest to hypothesize that the effectiveness of time-restricted self-feeding lies in the entrainment of the daily digestive physiological profiles. Moreover, under ad libitum self-feeding conditions, most species display specific feeding rhythms (Paspatis et al., 2000), while the accompanying digestive rhythms remain unknown.
In China, Atlantic salmon has been recently introduced and cultured in recirculating aquaculture systems (RAS) (Liu et al., 2014). In RAS, commercial feed accounts for more than 50% of total operating costs, which makes the final product less competitive. In this context, the employment of self-feeding systems is increasingly common. In fish farming, time-restricted self-feeding is believed to have several benefits, including (ⅰ) predictable feed supply and better growth performance and (ⅱ) less food wastage, compared with ad libitum self-feeding. Considering practical fish-farming operations, this study compares the effect of two self-feeding regimes (time-restricted self-feeding versus free access self-feeding) on growth parameters and the daily profile of digestive enzymes to determine the presumed advantages of time-restricted self-feeding.
2 MATERIAL AND METHOD 2.1 Animals and housingAtlantic salmon were obtained from Shandong Oriental Ocean Sci-Tech Co., Ltd. (Yantai, China) and reared at the facilities of the Institute of Oceanology, Chinese Academy of Sciences (Qingdao, China). Fish were kept in six 600-L tanks supplied with aeration and filtered seawater from two independent recirculating systems (flow-rate of 0.8 m3/h per tank and 10% water renewal per day). The photoperiod was set at a 12-h:12-h light/dark (L/D) cycle with lights on at 06:00 and an artificial dawn and dusk of 6 min. Light was provided by LED with an intensity of 150 lx during the light phase and < 0.1 lx during the dark phase. Water temperature and dissolved oxygen were maintained at 16.0±0.5℃ (mean±SD) and >6.0 mg/L, respectively. The level of ammonia was < 0.25 mg/L, salinity ranged from 28 to 30 g/L and pH values were 7.8–8.2.
2.2 Self-feeding systemsSelf-feeders (Hishing Electronics Co., Ltd., Qingdao, China) with string triggers were placed in each tank. The trigger was a black bead (5 mm diameter) suspended about 1 cm below the water surface at the edge of the tank. A commercial feed (Aller Aqua Co. Ltd., Christiansfeld, Denmark; 16.08%±0.50% protein, 46.66%±1.40% crude lipid and 12.72%±1.63% ash) was used in the experiment. Activation of the self-feeder resulted in delivery of 40 pellets (1.6 pellets per fish, about 1.7 g in total), and each activation was recorded by an event logger (MT4512TE, Kinco, Shanghai, China).
2.3 Experimental set-upThe fish were given 2 weeks to acclimate and learn to manage the self-feeders. At the start of the experiment, 150 fish (109.98±3.15 g) were distributed between six tanks (25 fish per tank), comprising of two experimental groups (three tanks per group) with two feeding schedules. One group was given free access to the self-feeders (FA group, 24 h feed access/d) and the other group had time-restricted access to self-feeders between the hours of 06:00– 08:00, 11:00–13:00 and 16:00–18:00 (TR group, 6 h feed access/d). Actuation of the trigger in the TR group outside these times was recorded but no feed was delivered. Paspatis and Boujard (1996) found Atlantic salmon mainly feed at dawn and dusk, and feeding to satiation less than once per day limited food intake and growth, whereas feeding more than 2–4 times per day had no effect on growth rate of catfish (Jarboe and Grant, 1997).
2.4 Sample collection and data analysisThe experiment was carried out from 24 December 2014 to 4 February 2015 and, during that period, all feeding demand behavior was recorded via a computer connected to the self-feeders. At the end of the experiment, the fish tanks were sampled alternately every 3 h over a 24-h cycle (eight sampling points, two fish from each tank at every time point). The sampled fish were killed with an overdose of MS-222 (300 mg/L) and weighed. Blood was collected by caudal puncture less than 5 min after anesthetization to avoid an increase in glucose levels due to handling (Rotllant and Tort, 1997). Samples were then centrifuged for 15 min at 4℃ (rcf=870×g), the plasma separated and frozen at-80℃. Samples were also taken from the stomach and intestine for enzymatic analyses and stored at-80℃. Sampling during the dark phase was performed under a dim red light. Thereafter, the remaining fish were anesthetized and weighed individually.
Blood glucose was determined by the glucose oxidase method (López-Olmeda et al., 2009). Pepsin, trypsin and amylase activities were measured using commercial assay kits (Nanjing Jiancheng Biochemical Corporation, Nanjing, China); values were expressed as U/mg protein. Protein concentration in the supernatants was determined using Coomassie Brilliant Blue G250, according to the provided protocol (Zhu et al., 2013).
Specific growth rate (SGR), ration level (RL), coefficient of variation (CV), condition factor (K) and feed conversion ratio (FCR) were calculated as follows:
where Wt and W0 are final and initial wet body weight (g) of fish, respectively; t is the feeding duration (days); C is the feed intakes (g); L is fork length (cm); SD is the standard deviation in body weight; W is the mean weight of fish (g).
2.5 Statistical analysisData were analyzed using a SPSS for Windows (Version 21.0) statistical package. Prior to analysis, raw data were diagnosed for normality of distribution and homogeneity of variance with the KolmogorovSmirnov test. Non-normal and heterogeneous data were transformed until normality and homogeneity were achieved. Growth parameters and enzyme activities between treatments at the same time point were first analyzed via a General Linear Model (GLM), with the fish tank set as a random factor, to test if a "tank" effect existed. Thereafter, the production parameters, glucose levels and digestive enzyme activities at the same time point between treatments were compared with a Student's t-test (Montoya et al., 2010). Digestive enzyme activities at different time points within the same treatment was compared with one-way analysis of variance (oneway ANOVA), followed by a Tukey multiple comparison post-hoc test (Montoya et al., 2010). Differences were considered significant if P < 0.05.
Data of digestive enzyme activities and blood glucose from each group were subjected to Cosinor analysis to test for the existence of statistically significant daily rhythms in each parameter with Acrophase software (version 3.5; http://www.circadian.org/main.html). The program calculated circadian rhythms through a fitted cosine wave with a 95% confidence level. Cosinor analysis provided a statistical value for a null hypothesis of zero amplitude. Therefore, if for a statistical significance of P < 0.05, this null hypothesis was rejected, the amplitude could be considered as differing from 0; thereby constituting evidence for the existence of a statistically significant rhythm for the period under consideration (Refinetti et al., 2007).
3 RESULT 3.1 Self-feeding behaviorBefore the experiment, all experimental fish were given access to a self-feeder but limited to the light phase. Self-feeding behavior stabilized within 10 days. Both groups had feeding peaks at dawn and dusk, while TR fish had an additional feeding peak at midday (Fig. 1). The number of total trigger actuations by the TR group throughout the experimental period was significantly higher than in the FA group (1 707.10±34.13 and 1 265.63±184.97, respectively) (Student's t-test; t=4.07, P=0.05). For TR group individuals, the number of actuations in the feeding period accounted for 69.25%±1.06% of the total actuations, which was significantly higher than in the FA group for the same period (62.68%±0.77%) (Student's t-test; t=8.70, P=0.00).

|
| Figure 1 Feeding pattern of fish under the different treatments White and black bars above the graph represent light and dark phases, respectively. Grey bars represent the time when feed was available to the TR group (light phase). |
There were no significant differences in SGR, body weight, mortality, CV, condition factor (K), RL or FCR of fish between treatments (P>0.05) (Table 1), whereas food wastage in the FA group was significantly higher than in the TR group (0.56%±0.10% and 0.79%±0.06%, respectively) (Student's t-test; t=-3.34, P=0.03) (Table 1).

|
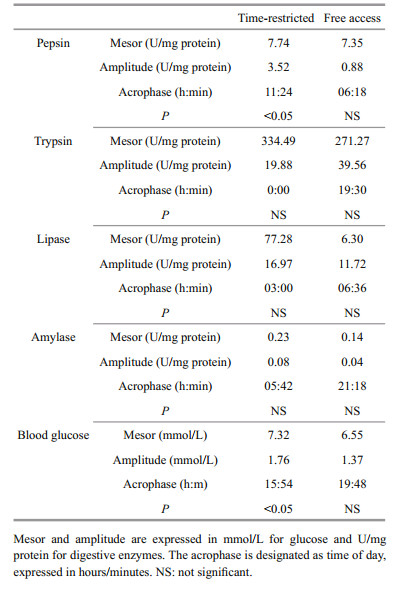
No statistically significant differences were observed in pepsin activity for fish in the FA group (ANOVA; F7, 16=0.40, P=0.89) (Fig. 2a). In contrast, TR fish showed an increase in pepsin activity at midday (ANOVA; F7, 16=5.51, P=0.00) and a subsequent decrease over the next 12 h (Fig. 2a). A daily rhythm in pepsin activity was observed in the TR group (Cosinor; P < 0.05), with the acrophase at the beginning of the second feeding (11:00–13:00) (Table 2). There was no significant difference in average daily pepsin activity between the TR and FA groups (7.74±2.45 and 7.35±0.64 U/mg protein, respectively) (Student's t-test; t=0.43, P=0.67).

|
| Figure 2 Daily profiles of pepsin (a), trypsin (b), lipase (c), amylase (d) activity, and blood glucose level (e) of fish subjected to the different self-feeding regimes (mean±SD, n=6) Different letters indicate significant differences (P < 0.05) among time points within treatments. *Indicates significant differences between treatments at the same time point (P < 0.05). White and black bars above the graph represent light and dark phases, respectively. Grey bars represent the time when feed was available to time-restricted (TR) group (light phase). |
|
Intestinal trypsin activity in the FA group decreased at the beginning and end of the light phase; a similar trend to that found in the TR group (Fig. 2b). Trypsin activity in the FA group at 09:00 was significantly lower than that at 12:00 or 15:00 (ANOVA; F7, 16= 2.89, P=0.37) (Fig. 2b). There was no evidence of a daily rhythm in either the TR or FA group (Cosinor; P>0.05) (Table 2). In addition, average daily trypsin activity in the TR group was significantly higher than in the FA group (334.49±35.40 and 271.27±33.82 U/mg protein for TR and FA fish, respectively) (Student's t-test; t=5.73, P=0.00).
3.3.3 Lipase activityNo statistically significant differences were found in daily lipase activity within the same treatment group (ANOVA; for TR: F7, 16=1.16, P=0.38; for FA: F7, 16=0.49, P=0.83) or at the same time point between the two experimental groups (Student's t-test, P>0.05) (Fig. 2c). No daily rhythms in lipase activity were observed (Cosinor; P>0.05) (Table 2). Average daily lipase activity in the TR group was significantly higher than in the FA group (77.28±16.83 and 63.00±14.80 U/mg protein for TR and FA fish, respectively) (Student's t-test; t=3.33, P=0.01).
3.3.4 Amylase activityThe daily profile of amylase activity in TR fish decreased from the end of the dark phase until midday, increased after the second feeding, and then decreased again (Fig. 2d). No statistically significant differences were observed in amylase activity for fish in the FA group (ANOVA; F7, 16=2.13, P=0.10) (Fig. 2d). There was no evidence of a daily rhythm in amylase activity in either group (Cosinor; P>0.05) (Table 2). Average daily amylase activity in the TR group was significantly higher than in the FA group (0.23±0.06 and 0.13±0.03 U/mg protein for TR and FA fish, respectively) (Student's t-test; t=3.85, P=0.00).
3.3.5 Blood glucose levelNo statistically significant differences were observed in blood glucose levels for fish in the FA group (ANOVA; F7, 16=0.74, P=0.64) (Fig. 2e). In TR fish, blood glucose increased between the second and third feeding, and then decreased over the next 6 h, which continued for 9 h (Fig. 2e). A daily rhythm in blood glucose was observed in the TR group (Cosinor; P < 0.05), with the acrophase occurring at 1 h after the third feeding (18:54 h) (Table 2). There was no significant difference in the daily blood glucose level between treatments (7.32±1.16 and 6.54±0.80 mmol/L for TR and FA fish, respectively) (Student's t-test; t=1.55, P=0.14).
4 DISCUSSIONIn this trial, the TR fish rapidly synchronized their self-feeding activity to the periodic availability of food, although some individuals still tried to feed when food was unavailable (28%–31%). Previous studies have shown that both rainbow trout (Noble et al., 2007) and sea bass (Azzaydi et al., 1998a) also quickly adapted to a self-feeding regime of three feeds per day. In the TR treatment group, the number of trigger actuations gradually increased 30–60 min before each feed (Fig. 1). For example, at the third feed, the number of trigger actuations between 14:30– 15:00, 15:00–15:30 and 15:30–16:00 was 0.66, 1.07 and 1.36, respectively, reaching a peak of 2.31 between 16:00–16:30 at the beginning of feeding (Fig. 1). Sea bass subjected to a time-restricted self-feeding regime also displayed food anticipatory activity when a 1-h feeding time occurred immediately after sunrise or sunset (Azzaydi et al., 2007), which was in agreement with the findings of this study.
No statistically significant differences were found for SGR, FCR, K or CV between the TR and FA treatment groups (Table 1). Sun et al. (2014) reported that feeding regime affected the balance of N and P in Atlantic salmon but had little effect on growth rates. Rainbow trout subjected to alternating self-feeding regimes also displayed similar growth rates (Gélineau et al., 1998; Noble et al., 2007). This result is not unexpected, as the ration levels of the two groups were similar (1.25%±0.04% and 1.37%±0.16% body weight/d for TR and FA, respectively). Thus, feeding schedule has a limited effect on the growth performance of Atlantic salmon when fed to satiation (Juell, 1995; Sun et al., 2014). The FCR values recorded in this study are comparable to results reported previously (Paspatis and Boujard, 1996).
Fish in the FA group showed significantly higher food wastage compared with TR fish (Table 1). This parameter is closely related to reward level. For example, Gélineau et al. (1998) reported that, in a group of 26 individual rainbow trout, a reward level of 0.25 g/kg fish per trigger did not meet the maximum feed intake. In our study, the reward level was more than twice as high at 0.59 g/kg fish per trigger, but wastage was low (Table 1). Gélineau et al. (1998) suggested that rainbow trout fed using self-feeders may not ingest as much food as possible, and the compensatory increase in feeding activity was inadequate for fish with a lower reward level to obtain sufficient feed. In this study, the effect of time-restricted self-feeding on reducing food wastage was insignificant, but food wastage was relatively low in both groups.
In fish genera with a stomach, enzymatic digestion starts in this section of the digestive tract where the gastric glands secrete pepsinogen and convert it to pepsin. Pepsin activity in TR fish displayed a significant rhythm over a 24-h period (Table 2), which reached a peak at the second feed (Fig. 2a), indicating that enzyme secretion was related to food intake in TR fish. Although a feeding peak was evident at dawn and dusk for both treatment groups, neither the light/ dark cycle nor the demand-feeding peak at dawn and dusk led to an increase in pepsin activity (Fig. 2a). Feeding at dawn or dusk coincides with the feeding habits of Atlantic salmon (Paspatis and Boujard, 1996) which, in the process of evolution, was probably a trade-off between feed-capture efficiency and predation risk (Metcalfe et al., 1999). The feeding time between 11:00 and 13:00 was artificially set, which may account for the fluctuations in pepsin activity in TR fish.
In the present study, the self-feeding regimes had little impact on the daily rhythm of intestinal trypsin and lipase activities, though the lipase activity in both treatment groups increased slightly at the beginning of the light phase (Fig. 2b, c; Table 1). The results suggest that, even though food anticipatory activity was observed, scheduled self-feeding did not entrain trypsin and lipase activities. Sea bream (Sparus aurata) (Montoya et al., 2010) and African catfish (Clarias gariepinus) (García-Ortega et al., 2000) fed at precisely fixed times showed significant fluctuations in intestinal protease. In the TR group, each feeding period was comparatively long at 2 h, whereas multiple feedings with a comparatively short interval may result in the fluctuations being less noticeable, for it takes at least 6 h for a single meal to be evacuated after feeding (Sveier et al., 1999). The TR group exhibited significantly higher average trypsin, lipase and amylase activities (Fig. 2b–d). Similar results were also reported in sea bream (Montoya et al., 2010) and goldfish (Vera et al., 2007), where fish fed a single meal periodically showed significantly higher average daily alkaline protease and amylase activities than those fed randomly.
In fish, daily variations in blood glucose levels are strongly dependent on feeding, as they disappear in fasted fish (Polakof et al., 2007). In this study, the blood glucose level in experimental fish ranged from 4.80 to 9.34 mmol/L, with a significant postprandial increase in TR individuals lasting 6 h after the first feed (Fig. 2e). Conversely, in FA fish, blood glucose levels fluctuated in a narrow range (Fig. 2e). It was also found that sea bream, when subjected to periodic feeding, showed no fluctuations in glucose levels (Sánchez et al., 2009; Montoya et al., 2010). In contrast, even TR fish acclimated to a feeding regime for a relatively long 6-week period displayed a significant postprandial increase in glucose (Fig. 2e). Because hyperglycemia persists several hours after feeding and often reduces growth, fish have been described as glucose-intolerant (Moon, 2001). Although, in our study, the growth performance in the TR group was similar to the FA group, the postprandial increase in blood glucose in TR fish may suggest poor blood glucose regulation and maladjustment to the feeding regime.
5 CONCLUSIONOverall, the results of this study failed to confirm any link between the entrainment of daily digestive enzyme profiles and growth performance. Although fish in the TR group synchronized self-feeding behavior and pepsin activity to the feeding window and had significantly higher intestinal enzyme activity, the postprandial increase in blood glucose may suggest maladjustment to the feeding regime. As regards commercial fish-farming operations, timerestricted self-feeding resulted in lower food wastage, but the effect was limited as wastage was < 1% in both groups, even at the high reward level.
6 ACKNOWLEDGEMENTWe are grateful to the anonymous reviewers for their input into revising the manuscript. The authors also thank Shandong Oriental Ocean Sci-Tech Co., Ltd. for their support.
| Azzaydi M, Madrid J A, Zamora S, Sánchez-Vázquez F J, Martínez F J, 1998a. Effect of three feeding strategies (automatic, ad libitum demand-feeding and time-restricted demand-feeding) on feeding rhythms and growth in European sea bass (Dicentrarchus labrax L.). Aquaculture, 163(3-4): 285–296. Doi: 10.1016/S0044-8486(98)00238-5 |
| Azzaydi M, Rubio V C, López F J M, Sánchez-Vázquez F J, Zamora S, Madrid J A, 2007. Effect of restricted feeding schedule on seasonal shifting of daily demand-feeding pattern and food anticipatory activity in European sea bass (Dicentrarchus labrax L.). Chronobiology International, 24(5): 859–874. Doi: 10.1080/07420520701658399 |
| Boujard T, Médale F, 1994. Regulation of voluntary feed intake in juvenile rainbow trout fed by hand or by selffeeders with diets containing two different protein/energy ratios. Aquatic Living Resources, 7(3): 211–215. Doi: 10.1051/alr:1994023 |
| Comperatore C A, Stephan F K, 1987. Entrainment of duodenal activity to periodic feeding. Journal of Biological Rhythms, 2(3): 227–242. Doi: 10.1177/074873048700200306 |
| García-Ortega A, Verreth J, Segner H, 2000. Post-prandial protease activity in the digestive tract of African catfish Clarias gariepinus larvae fed decapsulated cysts of Artemia. Fish Physiology and Biochemistry, 22(3): 237–244. Doi: 10.1023/A:1007893223006 |
| Gélineau A, Corraze G, Boujard T, 1998. Effects of restricted ration, time-restricted access and reward level on voluntary food intake, growth and growth heterogeneity of rainbow trout (Oncorhynchus mykiss) fed on demand with self-feeders. Aquaculture, 167(3-4): 247–258. Doi: 10.1016/S0044-8486(98)00320-2 |
| Jarboe H H, Grant W J, 1997. The influence of feeding time and frequency on the growth, survival, feed conversion, and body composition of channel catfish, Ictalurus punctatus, cultured in a three-tier, closed, recirculating raceway system. Journal of applied aquaculture, 7: 43–52. Doi: 10.1300/J028v07n01_04 |
| Juell J E, 1995. The behaviour of Atlantic salmon in relation to efficient cage-rearing. Reviews in Fish Biology and Fisheries, 5(3): 320–335. Doi: 10.1007/BF00043005 |
| Liu B L, Liu Y, Liu Z Y, Qiu D G, Sun G X, Li X, 2014. Influence of stocking density on growth, body composition and energy budget of Atlantic salmon Salmo salar L. in recirculating aquaculture systems. Chinese Journal of Oceanology and Limnology, 32(5): 982–990. Doi: 10.1007/s00343-014-3195-2 |
| López-Olmeda J F, Montoya A, Oliveira C, Sánchez-Vázquez F J, 2009. Synchronization to light and restricted-feeding schedules of behavioral and humoral daily rhythms in gilthead sea bream (Sparus aurata). Chronobiology International, 26(7): 1389–1408. Doi: 10.3109/07420520903421922 |
| Metcalfe N B, Fraser N H C, Burns M D, 1999. Food availability and the nocturnal vs. diurnal foraging trade-off in juvenile salmon. Journal of Animal Ecology, 68(2): 371–381. |
| Mohanta K N, Mohanty S N, Jena J K, Sahu N P, 2008. Optimal dietary lipid level of silver barb, Puntius gonionotus fingerlings in relation to growth, nutrient retention and digestibility, muscle nucleic acid content and digestive enzyme activity. Aquaculture Nutrition, 14(4): 350–359. Doi: 10.1111/anu.2008.14.issue-4 |
| Montoya A, López-Olmeda J F, Yúfera M, Sánchez-Muros M J, Sánchez-Vázquez F J, 2010. Feeding time synchronises daily rhythms of behaviour and digestive physiology in gilthead seabream (Sparus aurata). Aquaculture, 306(1-4): 315–321. Doi: 10.1016/j.aquaculture.2010.06.023 |
| Moon T W. 2001. Glucose intolerance in teleost fish: fact or fiction? Comparative Biochemistry and Physiology Part B: Biochemistry and Molecular Biology, 129: 243-249. |
| Noble C, Mizusawa K, Suzuki K, Tabata M, 2007. The effect of differing self-feeding regimes on the growth, behaviour and fin damage of rainbow trout held in groups. Aquaculture, 264(1-4): 214–222. Doi: 10.1016/j.aquaculture.2006.12.028 |
| Paspatis M, Boujard T, 1996. A comparative study of automatic feeding and self-feeding in juvenile Atlantic salmon (Salmo salar) fed diets of different energy levels. Aquaculture, 145(1-4): 245–257. Doi: 10.1016/S0044-8486(96)01336-1 |
| Paspatis M, Maragoudaki D, Kentouri M, 2000. Self-feeding activity patterns in gilthead sea bream (Sparus aurata), red porgy (Pagrus pagrus) and their reciprocal hybrids. Aquaculture, 190(3-4): 389–401. Doi: 10.1016/S0044-8486(00)00409-9 |
| Polakof S, Ceinos R M, Fernández-Durán B, Míguez J M, Soengas J L. 2007. Daily changes in parameters of energy metabolism in brain of rainbow trout:dependence on feeding. Comparative Biochemistry and Physiology Part A:Molecular & Integrative Physiology, 146(2):265-273. |
| Refinetti R, Cornélissen G, Halberg F, 2007. Procedures for numerical analysis of circadian rhythms. Biological Rhythm Research, 38(4): 275–325. Doi: 10.1080/09291010600903692 |
| Rotllant J, Tort L, 1997. Cortisol and glucose responses after acute stress by net handling in the sparid red porgy previously subjected to crowding stress. Journal of Fish Biology, 51(1): 21–28. Doi: 10.1111/jfb.1997.51.issue-1 |
| Sánchez J A, López-Olmeda J F, Blanco-Vives B, SánchezVázquez F J, 2009. Effects of feeding schedule on locomotor activity rhythms and stress response in sea bream. Physiology & Behavior, 98(1-2): 125–129. |
| Sun G X, Liu Y, Qiu D G, Yi M M, Li X, Li Y. 2014. Effects of feeding rate and frequency on growth performance, digestion and nutrients balances of Atlantic salmon (Salmo salar) in recirculating aquaculture systems (RAS). Aquaculture Research, 47(1): 176-188, http://dx.doi.org/10.1111/are.12480. |
| Sveier H, Wathne E, Lied E, 1999. Growth, feed and nutrient utilisation and gastrointestinal evacuation time in Atlantic salmon (Salmo salar L.):the effect of dietary fish meal particle size and protein concentration. Aquaculture, 180(3-4): 265–282. |
| Vera L M, De Pedro N, Gómez-Milán E, Delgado M J, Sánchez-Muros M J, Madrid J A, Sánchez-Vázquez F J, 2007. Feeding entrainment of locomotor activity rhythms, digestive enzymes and neuroendocrine factors in goldfish. Physiology & Behavior, 90(2-3): 518–524. |
| Zhu H X, Jiang Q C, Wang Q, Yang J H, Dong S M, Yang J X, 2013. Effect of dietary carbohydrate-to-lipid ratios on growth performance, body composition, hepatic enzyme activities, and digestive enzyme activities of juvenile Australian redclaw crayfish, Cherax quadricarinatus (von Martens). Journal of the World Aquaculture Society, 44(2): 173–186. Doi: 10.1111/jwas.2013.44.issue-2 |