 2017, Vol. 35
Institute of Oceanology, Chinese Academy of Sciences
Article Information
- XU Yong(徐勇), LI Xinzheng(李新正), MA Lin(马林), DONG Dong(董栋), KOU Qi(寇琦), SUI Jixing(隋吉星), GAN Zhibin(甘志彬), WANG Hongfa(王洪法)
- Seasonal and spatial variations of macro-and megabenthic community characteristics in two sections of the East China Sea
- Chinese Journal of Oceanology and Limnology, 35(5): 1152-1164
- http://dx.doi.org/10.1007/s00343-017-6085-6
Article History
- Received Mar. 18, 2016
- accepted in principle May. 3, 2016
- accepted for publication Jul. 16, 2016


2 University of Chinese Academy of Sciences, Beijing 100049, China;
3 Laboratory for Marine Biology and Biotechnology, Qingdao National Laboratory for Marine Science and Technology, Qingdao 266000, China
The East China Sea, located between the mainland of China and the Kuroshio Current (Guo et al., 2014), is the largest marginal sea of the western Pacific with an area of about 5×10⁵ km2 (Gong et al., 2003). The hydrographic condition of the East China Sea is very complex because of the seasonal variation in water dynamics (Qi et al., 2014). The western coastal water in the East China Sea, formed mainly by the Changjiang (Yangtze) River diluted water, is characterized by low temperature and salinity, while the eastern Kuroshio water features high temperature and salinity (Chao, 1990; Guo et al., 2014). They meet at the East China Sea shelf, together with other hydrographic waters such as Taiwan warm current water, Yellow Sea cold water, and Kuroshio bottom branch current to the northeast of Taiwan Island (Gong et al., 1996; Yang et al., 2011). The continental shelf is considered to be the dynamic area, with organisms exchanging between the coastal area and the oceanic area (Mackas and Coyle, 2005), such as planktonic ciliates (Zhang et al., 2015) and tintinnids (Li et al., 2016) in the East China Sea. Besides the natural hydrographic conditions, anthropogenic activities such as pollution and overfishing also influence species distribution (Jin and Tang, 1996; Li et al., 2013; Zhang et al., 2013).
Macrobenthic fauna, as an important component of marine ecosystems, plays crucial roles in the decomposition of organic matter and the transferring and recycling of nutrients within food webs (Carvalho et al., 2007). Macro-and megabenthic fauna collected using semi-quantitative methods (e.g. dredges, sledges and trawls) have been used to assess the benthic abundances, community structure and richness levels in different marine systems (Linse et al., 2007, 2013; Nephin et al., 2014). In the East China Sea, macro-and megabenthic fauna has been collected since 1950s (the Chinese Offshore Marine Comprehensive Expedition (the National Marine Census)) (Li et al., 2014) using the Agassiz trawl, but no direct comparison of benthic community characteristics from inshore to offshore and no illustration of the relationship between benthic community structure and environmental variables were conducted.
The present study aimed at elucidating the seasonal and spatial variations of macro-and megabenthic community characteristics (species composition, abundance, biomass, diversity and distribution pattern) in two sections of the East China Sea, to analyze the relationship between this fauna and environmental variables, and to detect possible effects of the Kuroshio Current and anthropogenic activities.
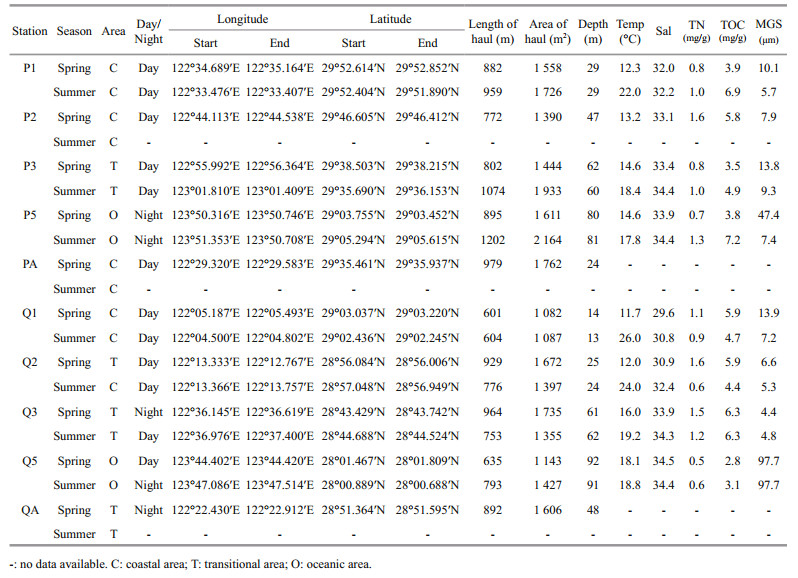
2 MATERIAL AND METHOD 2.1 Sampling stationsTen stations (122°04′–123°50′E, 28°01′–29°53′N) were situated in two sections of the East China Sea in spring and summer (stations P2, PA and QA were not investigated in summer for technical reasons: Fig. 1, Table 1) to study the community characteristics of the macro-and megabenthos. These stations were divided into three areas (coastal, transitional and oceanic area in Fig. 1; station Q2 belonged to 'transitional area' in spring) basically based on the water depth (40 m and 70 m bathymetric contours) and the distance from shore. The species living in these areas are influenced by different kinds of hydrological processes and anthropogenic disturbance.

|
| Figure 1 Sampling stations of macro-and megabenthic fauna in two sections of the East China Sea |
|
The macro-and megabenthic fauna were collected using a 1.5 m×0.5 m Agassiz trawl in April (spring) and August (summer), 2011. The largest mesh size was 2 cm at the mouth of the net and the mesh size decreased from the net body to the cod end (0.7 cm). The trawling was conducted on the sea bottom for about 15 min at a velocity of 2–3 knots (about 4–6 km/h). At the beginning and the end of each period of trawling, GPS was used to obtain the geographical position. The trawling was conducted only once for each station. Following collection, the biotic samples were preserved in 75% alcohol and then transported to the laboratory. Samples were identified to the lowest taxonomic level, counted and weighed (wet blotted weight; shells included for Mollusca) in the laboratory.
The depth, temperature and salinity of the bottom water were measured in situ with a CTD (Sea-bird SBE 911 plus, Sea-Bird Electronics, Inc., Bellevue, Washington, USA). The sediment samples were obtained using a modified 0.1 m2 Gray-O'Hara boxcorer. Sediment grain size was measured using a Laser Diffraction Particle Size Analyzer (Cilas 940L, CILAS, Orleans, Loiret, France). Total nitrogen (TN) and total organic carbon (TOC) concentrations in the surface sediments were measured by an elemental analyzer (Perkin-Elmer 2400 Series Ⅱ CHNS/O, Vernon Hills, IL, USA).
2.3 Statistical analysisThe dominant species were identified using the index of relative importance (IRI). Benthic parameters including species number (S), abundance (ind./km2), biomass (kg/km2), Margalef richness (d), ShannonWiener diversity (H′(log2)) and Pielou's evenness (J′) were calculated for each sample. Two-way ANOVA (Analysis of Variance) via general linear models (GLM) in SPSS (version 16) was applied to analyze the seasonal and spatial trends of these parameters. Before analysis, abundance and biomass were log10(x+1) transformed and d was 1/(x+1) transformed to approach homoscedasticity (Levene's test) and normality (Kolmogorov-Smirnov test). S was analyzed using the Kruskal-Wallis H test (three or more independent samples) and Mann-Whitney U test (two independent samples) for heteroscedasticity. Kruskal-Wallis H and Mann-Whitney U tests were also performed to analyze the spatial and seasonal trends of environmental variables.
Cluster analysis and non-metric multi-dimensional scaling (nMDS) ordination were applied to analyze the macro-and megabenthic community in spring and summer, and the significantly different communities were detected through a similarity profile (SIMPROF) test (Clarke et al., 2008). Before analysis, the BrayCurtis similarity matrices were constructed based on the fourth-root transformed abundance data to reduce the influence of the over-dominant species (Clarke and Warwick, 2001). Species occurring only in one station were not included to minimize effects of rare species. Two-way crossed ANOSIM (Analysis of Similarity) was employed to detect any statistically significant differences between seasons and among areas. Similarity percentage (SIMPER) was performed to identify the species contributing mostly to the similarity within each community. The k-dominance curve was used to detect the seasonal and spatial variations of diversity and ecological characteristics of different communities.
Pearson's correlation coefficient (σ) was employed to analyze the correlations between benthic parameters and environmental variables (depth, bottom temperature, bottom salinity, total nitrogen, total organic carbon and median grain size). Canonical correspondence analysis (CCA) was performed to visualize the correlations between macro-and megabenthic fauna and environmental variables using CANOCO (version 4.5) software (Ter Braak and Šmilauer, 2002), because in the preliminary detrended correspondence analysis (DCA), lengths of gradients in the first axis were >4 in both seasons. Species occurring only in one station were not included in the analysis. Stations PA and QA were excluded from CCA analysis for lack of environmental variables.
3 RESULT 3.1 Environmental variablesThe bottom temperature ranged from 11.7 to 18.1℃, with a mean value of 14.1℃, and increased from the coastal to the oceanic area in spring (Table 1). In summer, the temperature was significantly higher than in spring (Mann-Whitney U test, W=37.000, P=0.002, Table 2), varying from 17.8℃ to 26.0℃ with a mean value of 20.9℃ and decreasing from the coastal to the oceanic area. The bottom salinity in the trawling area varied a little with season but showed a significant increasing trend from coastal to oceanic area (Kruskal-Wallis H test, x2=8.969, P=0.011, Table 2). The TN in surface sediments decreased in summer compared to spring, with the lowest value occurring at station Q5 in both seasons (0.5 and 0.6 mg/g in spring and summer, respectively, Table 1) and the highest value at stations P2 and Q2 in spring (1.6 mg/g in both stations). However, the TOC increased from spring to summer with the lowest value also emerging at station Q5 in both seasons (2.8 and 3.1 mg/g in spring and summer, respectively) and the highest value at station P5 in summer (7.2 mg/g). There was a clear spatial pattern for the distribution of median grain size (MGS), with small MGS along the coastal and transitional areas and large MGS along the oceanic area in both seasons. Significant difference was also detected between the transitional and oceanic area for MGS in the East China Sea (W=17.000, P=0.049, Table 2).

|
A total of 217 species of macro-and megabenthic fauna was recorded during two surveys in the present study. Crustacea was the predominant group with 76 species (35.0% of all species), followed by 58 species of Pisces (26.7%), 39 Mollusca (18.0%), 20 Echinodermata (9.2%), 8 Polychaeta (3.7%) and 16 species in other groups (7.4%; Coelenterata, Urochordata, etc.). The total number of species increased slightly from spring (131 species) to summer (133). Figure 2 shows the species composition of major macro-and megabenthic groups on each voyage. The percentage of Mollusca decreased significantly from 29.8% of all species in spring to 1.5% in summer. However, the percentage of Crustacea and Pisces increased considerably from 32.1% and 19.1% in spring to 42.1% and 33.8% in summer, respectively.

|
| Figure 2 Species number and percentage of major macro-and megabenthic groups in spring and summer, 2011 |
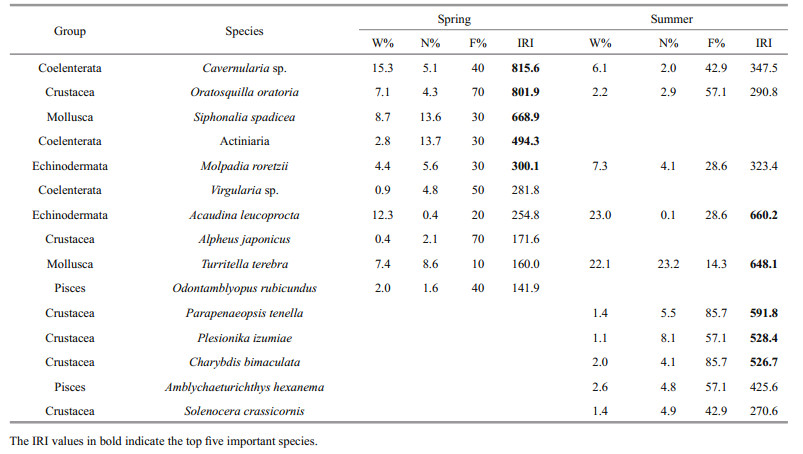
Table 3 shows the IRI values of the top ten species in spring and summer; these were calculated to identify the dominant species in the research area. However, no dominant species (IRI≥1000) were identified during the two surveys in the present study. In spring, the top five important species comprised Cavernularia sp., Oratosquilla oratoria, Siphonalia spadicea, Actiniaria and Molpadia roretzii. In summer, the top five important species were replaced by Acaudina leucoprocta, Turritella terebra, Parapenaeopsis tenella, Plesionika izumiae and Charybdis bimaculata. The percentage of Crustacea in the top ten species increased from 20% in spring to 50% in summer.
|
In the study area species abundance varied from 23.7×10³ to 221.0×10³ ind./km2 (average abundance=84.6×10³ ind./km2) in spring, and from 159.7×10³ to 1 195.7×10³ ind./km2 (494.8×10³ ind./ km2) in summer. Large numbers of Turritella terebra were found at station Q1 in summer, the abundance of which reached up to 804.8×10³ ind./km2. Two-way ANOVA test showed that the abundance in summer was significantly higher than in spring (F1, 11=15.688, P=0.002 < 0.01), while no significant difference among areas was observed (F2, 11=0.097, P=0.908) (Fig. 3).

|
| Figure 3 Spatial distribution of abundance, biomass, species number (species/station, S), richness (d), diversity (H′) and evenness (J′) in spring and summer, 2011 |
Biomass ranged from 72.0 to 601.2 kg/km2 (average biomass=295.1 kg/km2) in spring, and from 203.1 to 3 647.2 kg/km2 (1 543.7 kg/km2) in summer. The biomass of Turritella terebra at station Q1 in summer amounted to 2 391.5 kg/km2. According to the results of two-way ANOVA, the biomass in summer was significantly higher than in spring (F1, 11= 10.078, P=0.009 < 0.01); however, no significant difference was detected among areas (F2, 11=0.445, P=0.652) (Fig. 3).
The species number (species/station, S) in summer (average value=34) was significantly higher than in spring (22) (Mann-Whitney U test, W=62.000, P=0.006), and showed an increasing trend from coastal to oceanic area though no significant difference was observed among areas (Kruskal-Wallis H test, x2=3.939, P=0.140) (Fig. 3). Species richness (d), diversity (H′) and evenness (J′) showed no significant difference both between seasons (d: F1, 11=0.755, P=0.403; H′: F1, 11=0.638, P=0.441; J′: F1, 11=4.215, P=0.065) and among areas (d: F2, 11=1.784, P=0.213; H′: F2, 11=3.947, P=0.051; J′: F2, 11=1.221, P=0.332) in two-way ANOVA tests, though the values of the three indices in the oceanic area were higher than those in other areas both in spring and summer.
3.2.2 Community structureCluster analysis and non-metric multi-dimensional scaling (nMDS) ordination based on the macro-and megabenthic abundance data were applied to differentiate the sampling stations (Fig. 4).

|
| Figure 4 Cluster analysis and nMDS ordination of macro-and megabenthic communities based on fourth-root transformed abundance data from the P and Q sections, East China Sea, in spring and summer 2011 Different symbols indicate different communities with significant differences (SIMPROF, P < 0.05) |
In spring, ten stations were divided into three communities (Coastal, Transitional and Oceanic), located from the coastal to the oceanic area, through a SIMPROF test (P < 0.05) (Fig. 4a). The coastal community comprised four stations: P1, P2, Q1 and PA, in which the average coefficient of species similarity was 49.2% according to SIMPER results. The piscine Odontamblyopus rubicundus (16.8% contribution), the crustaceans Alpheus distinguendus (16.3%) and Oratosquilla oratoria (14.7%), and the coelenterate Cavernularia sp. (9.0%) were the main contributors to species similarity in the Coastal community. The Transitional community comprised four stations: P3, Q2, Q3 and QA, with a 50-m bathymetric contour nearby. The average coefficient of species similarity in the Transitional community was 45.5%, with the piscine Amblychaeturichthys hexanema (12.8% contribution), the nemertean (12.0%), and the echinoderm Craspidaster hesperus (11.4%) being the dominant species. The Oceanic community consisted of stations P5 and Q5, in which the average coefficient of species similarity was only 25.8%, with the crustacean Carcinoplax longimana (52.1% contribution) and the bivalve Venus fovealata (47.9%) as the main contributors.
In summer, seven stations were also classified into three communities (Coastal, Transitional and Oceanic) based on the SIMPROF results (P < 0.05) (Fig. 4c). The Coastal community comprised three stations: P1, Q1 and Q2. According to the SIMPER results, the average coefficient of species similarity in the Coastal community was 49.2%, and the crustaceans Solenocera crassicornis (14.5% contribution), Parapenaeopsis tenella (12.0%) and Oratosquilla oratoria (10.1%), and the piscine Odontamblyopus rubicundus (11.8%) were the main contributors to species similarity. The Transitional community was situated near the 50 m bathymetric contour and comprised stations P3 and Q3, with the average coefficient of species similarity being up to 60%; the fish Amblychaeturichthys hexanema (10.6% contribution) was the dominant species. The Oceanic community comprised stations P5 and Q5, and had an average coefficient of species similarity of 57%. The crustaceans Charybdis bimaculata (13.5% contribution), Carcinoplax longimana (9.8%) and Plesionika izumiae (9.4%) were the dominant species. Seven less dominant species: Coelorhynchus multispinulosus, Neobythites sivicola, Lepidotrigla alata, Solenocera melantho, Parapenaeus fissuroides, Oratosquilla gonypetes and Spiropagurus spiriger occurred exclusively in this community.
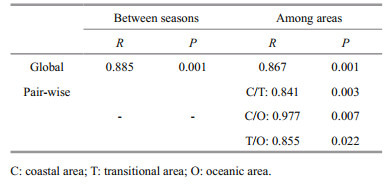
Two-way crossed ANOSIM (Table 4) indicated that overall macro-and megabenthic communities were indeed statistically significantly different between spring and summer (Global R=0.885, P=0.001) and among different geographic areas (Global R=0.867, P=0.001). Further pair-wise tests showed the significant differences between each pair of the three areas.
|
The k-dominance curve has been used to describe "the intrinsic diversity" (Lambshead et al., 1983; Zhou et al., 2007) and to differentiate the ecological characteristics of benthic species (Li et al., 2013). Figure 5a suggests that diversity was relatively higher in the oceanic area in comparison with the coastal and transitional areas in both seasons. The benthic diversity in the study area as a whole was lower in summer than in spring (Fig. 5b). The highest diversity was observed in the oceanic area (Fig. 5c).

|
| Figure 5 K-dominance curves of macro-and megabenthos between two seasons and among three areas based on the pooled sampling data for: (a) the two seasons within each of the three areas (C: coastal area; T: transitional area; O: oceanic area); (b) the two seasons; and (c) the three areas |
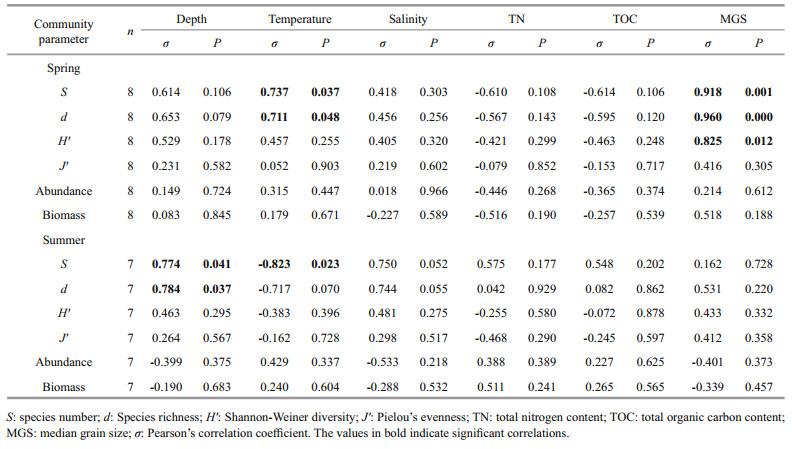
Significant correlations between benthic community parameters and environmental variables were detected (Table 5). In spring, the species number, richness, and Shannon-Weiner diversity index showed strong positive correlations to the median grain size of sediment (S, σ=0.918, P=0.001; d, σ=0.960, P < 0.001; H′, σ=0.825, P=0.012). The species number and richness were also significantly positively correlated to temperature, though the significance was lower (S, σ=0.737, P=0.037; d, σ=0.711, P=0.048). However, in summer, the species number and richness were significantly positively correlated to depth (S, σ=0.774, P=0.041; d, σ=0.784, P=0.037), and the species number also showed strong negative correlation to temperature (σ=-0.823, P=0.023).
All six environmental variables (depth, bottom temperature, bottom salinity, TN, TOC and MGS) and macro-and megabenthic abundance were applied in the CCA analysis both in spring and summer.
Figure 6 shows the CCA biplots of environmental variables with samples and species in spring. The upper left section in the biplot represents the deep area with high salinity, and the lower right section represents the area with shallow depth and high TOC. Most Echinodermata and one important species (with high IRI value), Siphonalia spadicea, showed positive correlations to depth, temperature and salinity, while most Crustacea, Mollusca and Pisces showed negative correlations (Fig. 6b).

|
| Figure 6 CCA ordination of macro-and megabenthic samples (a) and species (b) and their relationship with environmental variables in spring 2011 Species code: 1=Phyllophorus sp.; 2=Acaudina leucoprocta; 3=Craspidaster hesperus; 4=Amphioplus sinicus; 5=Molpadia roretzii; 6=Scalopidia spinosipes; 7=Palaemon gravieri; 8=Camatopsis rubida; 9=Oratosquilla oratoria; 10=Carcinoplax vestita; 11=Alpheus japonicus; 12=Charybdis bimaculata; 13=Parapenaeopsis tenella; 14= Alpheus distinguendus; 15=Trachypenaeus curvirostris; 16=Carcinoplax longimana; 17=Nemertinea; 18=Cavernularia sp.; 19=Virgularia sp.; 20=Actiniaria; 21=Venus fovealata; 22=Glossaulax didyma; 23=Siphonalia spadicea; 24=Nitidotellina iridella; 25=Inquisitor flavidula; 26=Nassarius siquejrensis; 27=Sinum javanicum; 28=Turricula javana; 29=Odontamblyopus rubicundus; 30= Amblychaeturichthys hexanema; 31=Johnius belangerii. The species with IRI value ≥500 are in bold and underlined. Environment code: Temp=temperature; Sal=salinity; TN=total nitrogen content; TOC=total organic carbon content; MGS=median grain size. |
The summer CCA biplots of environmental variables with samples and species are shown in Fig. 7. The left section in the biplot represents the deep oceanic area with high salinity, and the right section represents the shallow coastal area with low salinity. Most Pisces were negatively correlated to depth and salinity except for Amblychaeturichthys hexanema, Apogon lineatus, Repomucenus virgis, Neobythites sivicola, Lepidotrigla alata and Coelorhynchus multispinulosus, which were positively correlated (Fig. 7b). The important species (with high IRI values) Plesionika izumiae, Charybdis bimaculata and Acaudina leucoprocta showed positive correlations to depth and salinity while Parapenaeopsis tenella showed a negative correlation.

|
| Figure 7 CCA ordination of macro-and megabenthic samples (a) and species (b) and their relationship with environmental variables in summer 2011 Species code: 1=Coelorhynchus multispinulosus; 2=Polydactylus sextarius; 3=Neobythites sivicola; 4=Odontamblyopus rubicundus; 5=Collichthys lucidus; 6=Cynoglossus joyneri; 7=Trypauchen vagina; 8=Amblychaeturichthys hexanema; 9=Harpodon nehereus; 10=Chaeturichthys stigmatias; 11=Johnius belangerii; 12=Repomucenus virgis; 13=Apogon lineatus; 14=Larimichthys polyactis; 15=Lepidotrigla alata; 16=Ctenotrypauchen chinensis; 17=Cavernularia sp.; 18=Solenocera koelbeli; 19=Solenocera melantho; 20=Metapenaeopsis dalei; 21=Ogyrides orientalis; 22=Plesionika izumiae; 23=Xenophthalmus pinnotheroides; 24=Palaemon gravieri; 25=Camatopsis rubida; 26=Portonus sanguinolentus; 27=Heterocarpoides laevicarina; 28=Parapenaeus fissuroides; 29=Oratosquilla gonypetes; 30=Oratosquilla oratoria; 31=Eucrata crenata; 32=Xenophthalmodes morsei; 33=Carcinoplax vestita; 34=Alpheus japonicus; 35=Charybdis bimaculata; 36=Oratosquillina inornata; 37=Leptochela gracilis; 38=Parapenaeopsis tenella; 39=Atypopenaeus stenodactylus; 40=Alpheus distinguendus; 41=Metapenaeopsis barbata; 42=Spiropagurus spiriger; 43=Trachypenaeus curvirostris; 44=Metapenaeopsis provocatoria; 45=Carcinoplax longimana; 46=Solenocera crassicornis; 47=Amphioplus sp.; 48=Schizaster lacunosus; 49=Acaudina leucoprocta; 50=Thyone bicornis; 51=Luidia quinaria; 52=Craspidaster hesperus; 53=Amphioplus sinicus; 54=Molpadia roretzii; 55=Ehlersileanira incisa; 56=Aphrodita australis; 57=Sternaspis scutata; 58=Phylo ornatus. The species with IRI value ≥500 are in bold and underlined. Environment code: Temp=temperature; Sal=salinity; TN=total nitrogen content; TOC=total organic carbon content; MGS=median grain size. |
The investigation of macro-and megabenthos in the East China Sea has been carried out since the 1950s. However, most of the previous studies focused on species composition and qualitatively described the structure of the macro-and megabenthic communities based on the Agassiz trawl and boxcorer data (Liu and Hsu, 1963; Liu et al., 1986; Liu and Li, 2002). The descriptions of macro-and megabenthic community characteristics in the study area such as abundance, biomass and diversities, as well as community structure, are rare.
In this study, the species number showed an increasing trend from coastal to oceanic area for spatial pattern though no statistically significant differences among areas were detected. This spatial pattern for macro-and megabenthos was also revealed by Liu et al. (1986) and Liu and Li (2002) based on the Agassiz trawl data in the East China Sea. They attributed this phenomenon to the influence of the powerful Kuroshio Current, and deduced that the closer to the main part of the Kuroshio, the more benthic species there would be. Li (2005) also found that the number of fish species rose as water depth increased (basically from inshore to offshore) in the East China Sea based on the bottom trawl data. In this study, the species richness (d) and diversity (H′) also increased from coastal to oceanic area, but no such patterns were found for abundance, biomass and evenness. For abundance and biomass, the seasonal variations were more remarkable than the spatial variations, which could be related to the conservation policies established by the government. In the East China Sea, the fishing moratorium is from June to September, when the marine species propagate and grow fast. The survey carried out in summer in this study was within the banned fishing periods, while the survey carried out in spring was not. The prohibition of fishing activities and less anthropogenic disturbance may result in more demersal fishes and other megabenthos. As the result of their predation, the number of macrobenthos may be declined. But most of the macrobenthos smaller than 7 mm in size were omitted when we use the Agassiz trawl net. This may explain the sharp increase in abundance and biomass of macro-and megabenthos from spring to summer in our result.
In this study, the Coastal community corresponded to the coastal area and was closest to the mainland. This area was mainly influenced by the Changjiang River diluted water and other terrestrial runoffs, and featured low salinity and mud sediment (Liu et al., 1986; Zhang et al., 2014). It has been reported that salinity may influence the distribution of aquatic organisms (Attrill, 2002; Silva et al., 2012), especially in coastal areas (Chang et al., 2012). In our study, CCA results also revealed that the Coastal community was negatively affected by salinity in both seasons. The dominant species in this community (e.g., Odontamblyopus rubicundus) preferred to inhabit the muddy-bottomed coastal waters with low salinity. According to the Agassiz trawl and box-corer data collected in the late 1950s, Liu et al. (1986) revealed that the coastal area was dominated by two species of molluscs (i.e., Anadara kagoshimensis and Nassarius spp.) and one species of echinoderm (i.e., Schizaster lacunosus). The significant variations in dominant species over more than a half-century may be a result of fishing activities. Bottom trawling had flourished with the rise of fisheries in the coastal area of the East China Sea since the early 1960s. Although this has been forbidden since the late 1980s with the creation of restricted fishing areas in the coastal area, we still observed many fixed nets during our surveys. Bottom trawling could have had negative impacts on the survival of Schizaster lacunosus, and the practice was also considered a reason for the reduction in the echinoderm Echinocardium cordatum in the Bohai Sea (Zhou et al., 2007). It also reduced the predators of macro-and megabenthic fauna, which could promote the succession of the benthic community. For example, Odontamblyopus rubicundus and Amblychaeturichthys hexanema were the favored prey of the fish Larimichthys polyactis and Johnius belangerii (Li et al., 2009). The latter two fishes, which have a high commercial value, are important fishing targets and preferred by fishermen. Their reduction as a result of commercial fishing might decrease the survival pressure and increase the quantity of the gobies Odontamblyopus rubicundus and Amblychaeturichthys hexanema.
A Transitional community corresponding to the transitional area connected the Coastal and Oceanic communities. The factors affecting the macro-and megabenthic community in the transitional area were more complex compared to other areas. Both hydrological conditions and anthropogenic activities played indispensable roles. Yang et al. (2011) suggested that a Kuroshio bottom branch current to the northeast of Taiwan Island (KBBCNT) upwells northwestward from 300 m to 60 m and goes through the transitional area in this study along 60 m bathymetric contours, based on the data collected in August 2009. In our study, high-salinity waters (salinity >34.2) occurred in summer in the transitional area, which may suggest that the KBBCNT also flowed along 60 m bathymetric contours in summer 2011. However, the KBBCNT did not go through the transitional area in spring because high-salinity waters did not exist. The seasonal variation of the KBBCNT will certainly influence the Transitional community as the bottom current brings some endemic species which can endure high salinity. The high concentration of organic matter in the transitional area (TOC in summer in Table 1) could ensure the food supply for the macro-and megabenthos. This may explain the relatively higher biomass in the transitional area in summer. Liu et al. (1986) indicated that the dominant macro-and megabenthic fauna in the transitional area were the molluscan Nassarius spp. and echinoderm Schizaster lacunosus, while in this study the dominant species became the fish Amblychaeturichthys hexanema.
The Oceanic community coincided exactly with the oceanic area, with the highest salinity in both seasons. This community was mainly influenced by the Kuroshio Current because of its nearest location to Kuroshio (especially for station Q5) and the highsalinity level (salinity ≥34.2) in both seasons. In summer, seven species: Coelorhynchus multispinulosus, Neobythites sivicola, Lepidotrigla alata, Solenocera melantho, Parapenaeus fissuroides, Oratosquilla gonypetes and Spiropagurus spiriger occurred exclusively in this community. The species Coelorhynchus multispinulosus, Lepidotrigla alata and Parapenaeus fissuroides were also collected in spring at station Q5 (salinity ≥34.2). Although they were not dominant species, some of them may reflect the intrusion of Kuroshio waters into the continental shelf. For example, the demersal fish Neobythites sivicola was recorded in the East China Sea shelf and the sea area adjacent to Taiwan Island and Japan (Chen and Shao, 1991; Li, 2005). It was also collected in the area where the KBBCNT (suggested by Yang et al. (2011)) went through in the summer (our unpublished data), and in the northern Yellow Sea (121°20′E, 38°40′N) in 1996 (Zhao, 1998) where the Yellow Sea Warm Current (separated from the Kuroshio suggested by Nitani (1972)) went through. So, we suggest that the distribution of this fish may primarily correspond to the distribution of Kuroshio and its branch currents. However, more investigation is needed to test whether these species are appropriate to indicate Kuroshio and its branch currents. The dominant species in the oceanic area were the echinoderm Stellaster childreni and the crustacean Callianassa sp. in the late 1950s (Liu et al., 1986), while the crustacean Carcinoplax longimana was the most abundant species in this study. Anthropogenic stresses in the Oceanic area seem to be less severe than in the coastal and transitional areas. The Kuroshio Current plays a significant role in the distribution of marine organisms in the northwest Pacific Ocean, and further research should be carried out to reveal its underlying mechanisms.
5 CONCLUSIONThe macro-and megabenthic community structure in the studied area of the East China Sea showed an obvious spatial pattern from coastal to oceanic area in spring and summer. The Coastal, the Transitional and the Oceanic community corresponded to the coastal, the transitional and the oceanic area, respectively. Dominant species in the three communities had changed greatly over more than a half-century, especially in the Coastal community. High-salinity waters (salinity >34.2) occurred in the transitional area in summer and in the oceanic area in both seasons, which may suggest the path of the Kuroshio bottom branch current to the northeast of Taiwan Island (KBBCNT). The distribution of several macro-and megabenthos (e.g. Neobythites sivicola) may reflect the influence of the Kuroshio Current.
6 ACKNOWLEDGEMENTWe wish to thank WANG Jinbao, PENG Songyao, HUANG Hui and XU Peng for their work in the field and laboratory. We also appreciate the valuable comments on the manuscript by the anonymous reviewers.
| Attrill M J, 2002. A testable linear model for diversity trends in estuaries. Journal of Animal Ecology, 71(2): 262–269. Doi: 10.1046/j.1365-2656.2002.00593.x |
| Carvalho S, Barata M, Gaspar M B, Pousão-Ferreira P, Da Fonseca L C, 2007. Enrichment of aquaculture earthen ponds with Hediste diversicolor:consequences for benthic dynamics and natural productivity. Aquaculture, 262(2-4): 227–236. Doi: 10.1016/j.aquaculture.2006.11.028 |
| Chang N N, Shiao J C, Gong G C, 2012. Diversity of demersal fish in the East China Sea:implication of eutrophication and fishery. Continental Shelf Research, 47: 42–54. Doi: 10.1016/j.csr.2012.06.011 |
| Chao S Y, 1990. Circulation of the East China Sea, a numerical study. Journal of the Oceanographical Society of Japan, 46(6): 273–295. Doi: 10.1007/BF02123503 |
| Chen L J, Shao K T, 1991. A review of the families ophidiidae and bythitidae from Taiwan. Bulletin of the Institute of Zoology Academia Sinica, 30(1): 9–18. |
| Clarke K R, Somerfield P J, Gorley R N, 2008. Testing of null hypotheses in exploratory community analyses:similarity profiles and biota-environment linkage. Journal of Experimental Marine Biology and Ecology, 366(1-2): 56–69. Doi: 10.1016/j.jembe.2008.07.009 |
| Clarke K R, Warwick R M. 2001. Change in Marine Communities:An Approach to Statistical Analysis and Interpretation. 2nd edn. PRIMER-E Ltd, Plymouth. |
| Gong G C, Chen Y L L, Liu K K, 1996. Chemical hydrography and chlorophyll a distribution in the East China Sea in summer:implications in nutrient dynamics. Continental Shelf Research, 16(12): 1561–1590. Doi: 10.1016/0278-4343(96)00005-2 |
| Gong G C, Wen Y H, Wang B W, Liu G J, 2003. Seasonal variation of chlorophyll a concentration, primary production and environmental conditions in the subtropical East China Sea. Deep-Sea Research Part Ⅱ:Topical Studies in Oceanography, 50(6-7): 1219–1236. Doi: 10.1016/S0967-0645(03)00019-5 |
| Guo S J, Feng Y Y, Wang L, Dai M H, Liu Z L, Bai Y, Sun J, 2014. Seasonal variation in the phytoplankton community of a continental-shelf sea:the East China Sea. Marine Ecology Progress Series, 516: 103–126. Doi: 10.3354/meps10952 |
| Jin X S, Tang Q S, 1996. Changes in fish species diversity and dominant species composition in the Yellow Sea. Fisheries Research, 26(3-4): 337–352. Doi: 10.1016/0165-7836(95)00422-X |
| Lambshead P J D, Platt H M, Shaw K M, 1983. The detection of differences among assemblages of marine benthic species based on an assessment of dominance and diversity. Journal of Natural History, 17(6): 859–874. Doi: 10.1080/00222938300770671 |
| Li B Q, Keesing J K, Liu D Y, Han Q X, Wang Y J, Dong Z J, Chen Q, 2013. Anthropogenic impacts on hyperbenthos in the coastal waters of Sishili Bay, Yellow Sea. Chinese Journal of Oceanology and Limnology, 31(6): 1257–1267. Doi: 10.1007/s00343-013-2173-4 |
| Li H, Zhao Y, Chen X, Zhang W, Xu J, Li J, Xiao T, 2016. Interaction between neritic and warm water tintinnids in surface waters of East China Sea. Deep-Sea Research Part Ⅱ:Topical Studies in Oceanography, 124: 84–92. Doi: 10.1016/j.dsr2.2015.06.008 |
| Li S F. 2005. The ecological study for fish community in the East China Sea continental shelf:the spatial pattern and diversity. PhD thesis. East China Normal University, Shanghai, China. (in Chinese with English abstract) |
| Li X Z, Wang H F, Wang J B, Dong D, Ma L, Kou Q, Sui J X, Gan Z B, Zhang B L, 2014. Biodiversity variability of macrobenthic in the Yellow Sea and East China Sea between 2001 and 2011. Zoological Systematics, 39(4): 459–484. Doi: 10.11865/zs.20140401 |
| Li Z Y, Dai F Q, Zuo T, Jin X S, Zhuang Z M, 2009. Studies on food competition between Pseudosciaena polyactis and Johnius belengerii from Changjian estuary and adjacent southern Yellow Sea in autumn. Journal of Hydroecology, 2(2): 67–72. |
| Linse K, Brandt A, Bohn J M, Danis B, De Broyer C, Ebbe B, Heterier V, Janussen D, González P J L, Schüller M, Schwabe E, Thomson M R A, 2007. Macro-and megabenthic assemblages in the bathyal and abyssal Weddell Sea (Southern Ocean). Deep Sea Research Part Ⅱ:Topical Studies in Oceanography, 54(16-17): 1848–1863. Doi: 10.1016/j.dsr2.2007.07.011 |
| Linse K, Griffiths H J, Barnes D K A, Brandt A, Davey N, David B, De Grave S, d'Udekem d'Acoz C, Eléaume M, Glover A G, Hemery L G, Mah C, Martín-Ledo R, Munilla T, O'Loughlin M, Pierrat B, Saucède T, Sands C J, Strugnell J M, Enderlein P, 2013. The macro-and megabenthic fauna on the continental shelf of the eastern Amundsen Sea, Antarctica. Continental Shelf Research, 68: 80–90. Doi: 10.1016/j.csr.2013.08.012 |
| Liu J Y, Hsu F S, 1963. Preliminary studies on the benthic fauna of the Yellow Sea and the East China Sea. Oceanologia et Limnologia Sinica, 5(4): 306–321. |
| Liu L S, Li X Z, 2002. Distribution of macrobenthos in spring and autumn in the East China Sea. Biodiversity Science, 10(4): 351–358. |
| Liu R Y, Cui Y H, Xu F S, Tang Z C, 1986. Ecological characteristics of macrobenthos of the Yellow Sea and the East China Sea. Studia Marina Sinica, 27: 153–173. |
| Mackas D L, Coyle K O. 2005. Shelf-offshore exchange processes, and their effects on mesozooplankton biomassand community composition patterns in the northeast Pacific. Deep Sea Research Part Ⅱ: Topical Studies in Oceanography, 52(5-6): 707-725, http://dx.doi.org/10.1016/j.dsr2.2004.12.020. |
| Nephin J, Juniper S K, Archambault P, 2014. Diversity, abundance and community structure of benthic macroand megafauna on the beaufort shelf and slope. PLoS One, 9(7): e101556. Doi: 10.1371/journal.pone.0101556 |
| Nitani H. 1972. Beginning of the kuroshio. In: Stommel H, Yoshida K eds. Kuroshio, Physical Aspects of the Japan Current. University of Washington Press, Seattle, USA. p.129-156. |
| Qi J F, Yin B S, Zhang Q L, Yang D Z, Xu Z H, 2014. Analysis of seasonal variation of water masses in East China Sea. Chinese Journal of Oceanology and Limnology, 32(4): 958–971. Doi: 10.1007/s00343-014-3269-1 |
| Silva A C F, Tavares P, Shapouri M, Stigter T Y, Monteiro J P, Machado M, Da Fonseca L C, Ribeiro L, 2012. Estuarine biodiversity as an indicator of groundwater discharge. Estuarine, Coastal and Shelf Science, 97: 38–43. Doi: 10.1016/j.ecss.2011.11.006 |
| Ter Braak C J F, Šmilauer P. 2002. CANOCO Reference Manual and CanoDraw for Windows User's Guide: Software for Canonical Community Ordination (Version 4.5). Microcomputer Power, Ithaca, NY. |
| Yang D Z, Yin B S, Liu Z L, Feng X R, 2011. Numerical study of the ocean circulation on the East China Sea shelf and a Kuroshio bottom branch northeast of Taiwan in summer. Journal of Geophysical Research: Oceans, 116(C5): C05015. Doi: 10.1029/2010jc006777 |
| Zhang C X, Zhang W C, Ni X B, Zhao Y, Huang L F, Xiao T, 2015. Influence of different water masses on planktonic ciliate distribution on the East China Sea shelf. Journal of Marine Systems, 141: 98–111. Doi: 10.1016/j.jmarsys.2014.09.003 |
| Zhang Q L, Liu H W, Qin S S, Yang D Z, Liu Z L, 2014. The study on seasonal characteristics of water masses in the western East China Sea shelf area. Acta Oceanologica Sinica, 33(11): 64–74. Doi: 10.1007/s13131-014-0556-9 |
| Zhang Y, Lv Z B, Guan B, Liu Y J, Li F, Li S W, Ma Y Q, Yu J B, Li Y Z, 2013. Status of macrobenthic community and its relationships to trace metals and natural sediment characteristics. Clean Soil Air Water, 41(10): 1027–1034. Doi: 10.1002/clen.201200575 |
| Zhao Y B, 1998. First record of Neobythites Sivicola (Jordan & Snyder) in northern part of the Yellow Sea. Fisheries Science, 17(6): 39–40. |
| Zhou H, Zhang Z N, Liu X S, Tu L H, Yu Z S, 2007. Changes in the shelf macrobenthic community over large temporal and spatial scales in the Bohai Sea, China. Journal of Marine Systems, 67(3-4): 312–321. Doi: 10.1016/j.jmarsys.2006.04.018 |