 2017, Vol. 35
Institute of Oceanology, Chinese Academy of Sciences
Article Information
- WANG Quanchao(王全超), YU Yang(于洋), LI Fuhua(李富花), ZHANG Xiaojun(张晓军), XIANG Jianhai(相建海)
- Predictive ability of genomic selection models for breeding value estimation on growth traits of Pacific white shrimp Litopenaeus vannamei
- Chinese Journal of Oceanology and Limnology, 35(5): 1221-1229
- http://dx.doi.org/10.1007/s00343-017-6038-0
Article History
- Received Feb. 3, 2016
- accepted in principle Mar. 25, 2016
- accepted for publication Jul. 11, 2016


2 University of Chinese Academy of Sciences, Beijing 100049, China;
3 Qingdao National Laboratory for Marine Science and Technology, Qingdao 266071, China
Litopenaeus vannamei is a shrimp species that is cultured worldwide. It is believed to make up about 90% of shrimp aquaculture in the western hemisphere (Okpala et al., 2014) and greatly contributes to supplementing animal protein. Although several selective breeding projects for L. vannamei have been carried out (Andriantahina et al., 2013; Luan et al., 2015), broodstocks with high and stable growth traits and high resistance to disease are still urgently needed. Marker assistant selection (MAS) is an effective method for accelerating the selective progress in both plants and animals. With the development of highthroughput sequencing techniques, the high-density genetic linkage maps with single nucleotide polymorphisms (SNPs) covering the whole genome is now feasible in aquatic animals (Cui et al., 2015; Yu et al., 2015). For L. vannamei, advances in genome sequencing, high-throughput SNP discovery and high density linkage map construction (Yu et al., 2014; Yu et al., 2015) have established foundations for the genetic improvement of important traits based on MAS.
Genomic selection (GS) is one MAS strategy in which high-density markers covering the whole genome are used to predict the genomic estimated breeding value (GEBV) of each genotyped individual (Goddard and Hayes, 2007). GS is regarded as a powerful tool for complex traits, especially for low heritability traits, carcass quality traits, and disease resistance traits (Meuwissen, 2003). Compared with traditional breeding practices, GS can greatly accelerate the breeding process and reduce the costs of a breeding project because selection can be carried out at an early growth stage without the need for phenotypic measurements (Goddard and Hayes, 2007). As GS shows tremendous advantage over traditional breeding approach, it was promising to improve the accuracy of GS by using appropriate GS models.
Different GS models have been proposed to predict GEBVs. These models were established based on different assumptions about the distributions of marker effects. For example, the best linear unbiased prediction (BLUP) models, including RR-BLUP and GBLUP, assume that the effect of each marker follows a normal distribution with the same variance across all markers (Meuwissen et al., 2001; Habier et al., 2007). Bayesian models, such as BayesA and Bayesian LASSO, assume a different variance for each marker effect (Park and Casella, 2008). Previous reports based on simulations demonstrated that Bayesian models have a higher predictive ability than BLUP models (Solberg et al., 2008; Clark et al., 2011). Nevertheless, recent reports based on real data sets in livestock and plant breeding showed that the performance of these models can change depending on factors such as genetic architecture among traits and marker density (Moser et al., 2009; Heslot et al., 2012; Gao et al., 2013; Liu et al., 2014; Neves et al., 2014). Therefore, it is imperative to assess the performance of diverse models using real data sets, and thereafter, to identify the models that can provide improved prediction accuracy in a given population.
Although the application of GS in aquatic animals has been documented recently (Nielsen et al., 2009; Sonesson and Meuwissen, 2009; Nirea et al., 2012; Ødegård et al., 2014; Castillo-Juárez et al., 2015; Dou et al., 2016), no report appears to have employed real data sets for genomic prediction in shrimp. Considering the superior performance of GS when applied to livestock and crops (Zhang et al., 2011; Desta and Ortiz, 2014), GS is likely to be similarly applicable to shrimp species. Based on this proposal, we employed three statistical models (RR-BLUP, BayesA and Bayesian LASSO) to predict the GEBVs for two growth traits, body length and body weight to evaluate the performance of GS models in L. vannamei.
2 MATERIAL AND METHOD 2.1 Sample collection and genotypingOne full-sib family of L. vannamei was created in the breeding center of the Guangxi Fishery Institute (Fangchenggang, Guangxi Province, China). After about 100 days of culture from the post-larvae stage, 205 individuals were selected randomly and the body length and body weight of each individual were measured. The muscle tissue of each individual was collected and stored at -80℃ for genomic DNA extraction. The animals and genotyping method used in this study were the same as those reported previously (Yu et al., 2015). Briefly, all the individuals were genotyped based on the specific length amplified fragment sequencing (SLAF-seq) technique (Sun et al., 2013). A total of 6 359 SLAF markers which were genotyped successfully were collected. Those biallele SLAF markers could be considered as SNP markers and were chosen for further analysis. SNPs were then filtered based on either percentage of missing genotypes more than 20% or minor allele frequency less than 0.01 across the samples. Individual screening for the percentage of missing genotypes was also performed and any observations indicating more than 5% missing genotypes were discarded. Beagle 3.3.2 was used to impute missing genotypes (Browning and Browning, 2007).
2.2 Population stratificationA multidimensional scaling analysis was performed using the "cmdscale" function in the R software (R Development Core Team, 2014) to verify the genetic homogeneity of the data set. First, the matrix of genomic kinship (identity by state) was calculated with the GenABEL package based on the filtered markers (Aulchenko et al., 2007). Then the matrix of genomic kinship was input into the R software (R Development Core Team, 2014) and the multidimensional scaling was calculated using the "cmdscale" function.
2.3 Statistical modelsThree statistical GE models were used to predict the GEBVs, namely RR-BLUP, BayesA, and Bayesian LASSO (Meuwissen et al., 2001; Park and Casella, 2008). The general linear BLUP model can be defined as:
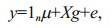 (1)
(1)where y is the vector of phenotypic observations; μ is the overall mean; 1n is a vector of n (n=number of records); g is the vector of additive effects of SNPs with a variance of σg2; X is the corresponding design matrix with elements of Xij=0, 1, and 2 for genotypes AA, AB, and BB, respectively for the ith animal and jth SNP; and e is the vector of residuals with a variance of σe2 (Luan et al., 2009).
After the SNP effects were estimated by a model (RR-BLUP, BayesA, or Bayesian LASSO), the GEBV of each individual was computed for the validation of populations as:
 (2)
(2)RR-BLUP assumes that the marker effects are random (g~N(0, σg2)) (Meuwissen et al., 2001) and have equal variances 
The BayesA model assumes prior normal distribution with specific variance for each marker effect. The prior distribution of SNP variances follows a scaled inverse chi-square distribution with degrees of freedom df and scale parameter S. In this study, both the S and df of the distribution were set as described by Meuwissen et al. (2001). The Gibbs sampler was used for 40 000 iterations and the first 10 000 iterations were taken as burn-in (Ostersen et al., 2011). The analysis was implemented in the R software (R Development Core Team, 2014).
The Bayesian LASSO model assumes that the prior distribution assigned to the SNP effects is an identical, independent, double exponential density (DE) defined as 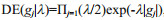

To systematically assess the performance of the GS models, a five-fold cross-validation approach was used in this study. Briefly, the data for each trait were divided randomly into five subsets, each containing 20% of the data. For each cross-validation experiment, one of the five subsets was retained as the validation set, and the other four subsets were combined and served as the training set. The process was repeated five times, each time with one subset as the validation set. Accordingly, each individual occurred only once in the validation set and had only one predicted GEBV (Luan et al., 2009).
2.5 Predictive ability of the GS modelsThe predictive ability of each GS model was assessed using the reliability of the GEBV and the bias of the predicted phenotypes. The reliability of the GEBV was evaluated by calculating the Pearson correlation between the GEBV of each shrimp sample in the validation population and their observed phenotypes. Bias was assessed using the regression coefficients of the observed phenotypes on the predicted phenotypes. A model was considered unbiased when the regression coefficient was close to one (Resende et al., 2012). The reliability of the GEBV and coefficient of regressions were calculated within each cross-validation analysis.
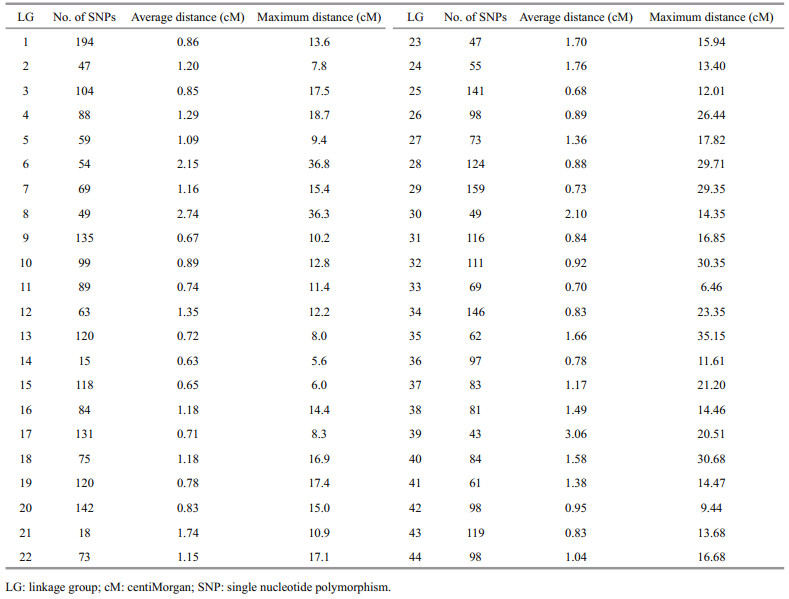
3 RESULT 3.1 Details of the phenotypes and markersThe average body length and body weight of the individuals used for the phenotype analyses were 117.13±7.36 mm and 20.32±3.72 g, respectively. After filtration, a total of 3 960 SNP markers in 44 linkage groups (LGs) were selected for the genomic prediction (Table 1). The average distance between adjacent SNP pairs within one LG was 1.04 cM, and the maximum distance between adjacent SNP pairs in each LG varied from 5.57 cM in LG14 to 36.80 cM in LG6. The number of SNPs in each LG also varied from 15 in LG14 to 194 in LG1
|
The multidimensional scaling analysis of an identity-by-state matrix for the 205 L. vannamei samples was shown in Fig. 1. The analysis revealed that all the points were not far from each other. Comparison of the multidimensional scaling variables (MDS1 and MDS2) showed that all the distributed points were well captured within the range -0.2 to 0.2. The points close to the borders were not considered as outliers, because they were relatively close to other neighboring points.

|
| Figure 1 Multidimensional scaling analysis of an identity-by-state matrix for 205 individuals of L. vannamei |
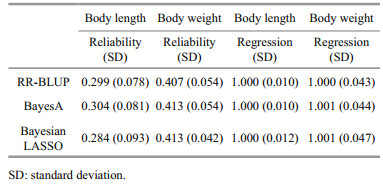
The reliability of the GEBV and the regression bias of the predicted phenotypes using three different GS models were shown in Table 2. Although these models used different prior assumptions of the marker effects, their predictive ability was very similar for the two growth traits in the analyzed L. vannamei population. The mean reliability of the GEBVs for body length and body weight using the three models was 0.296 and 0.411, respectively. For body length, BayesA performed slightly better than RR-BLUP and Bayesian LASSO, and the largest difference of 0.02 was between BayesA and Bayesian LASSO. For body weight, BayesA and Bayesian LASSO produced similar results that were 0.006 better than RR-BLUP. For both traits, the regression coefficients from the three models were close to one, indicating no obvious bias in the predictions. Additionally, no significant bias was detected among the different models.
|
In selective breeding projects for L. vannamei, body weight and body length are considered to be important selection indexes for growth traits. In this study, the average body length of the L. vannamei samples (about 117 mm) is comparable with the body lengths of 107 to 114 mm reported recently by Okpala and Bono (2016). However, the average body weight of the L. vannamei samples (about 20 g) is higher than the body weight of about 10 g reported in the Okpala and Bono (2016) study. Possibly, the body length and body weight are affected by sex, different culture environments, and different developmental stages (Okpala and Bono, 2016; Tan et al., 2016). It is worth noting that the selection strategy used in selective breeding projects may be a factor in the reported variations for growth parameters among different studies. It has been reported that the selection response (per generation) for the growth of L. vannamei can range from 2.3% to 25.0% owing to different selection strategies (Argue et al., 2002; Sui et al., 2015). Although traditional selective breeding methods can help to improve the genetic gains of such growth traits, they are still costly and time-consuming. Thus, there is a great need for improved breeding methods that can accelerate the genetic improvement of shrimp and decrease the costs.
GS has been shown to produce significant gains per unit cost and time in animal and crop breeding projects (Tayeh et al., 2015). The assessment of different GS models in various species has provided valuable information for the future application of GS. So far, no single model is guaranteed to produce best result across species or traits, because the performance of GS models depends on many factors, such as the architecture and heritability of the trait, the size of the training data set, the relatedness between the training population and validation population, and the marker density (Daetwyler et al., 2013).
In the present study, the three models that were tested showed similar prediction ability for two growth traits in shrimp. The regression coefficients of all the models indicated there was no obvious bias for the predictions. It has been reported that Bayesian models often have higher accuracy than BLUP models in the cases that a few quantitative trait loci (QTLs) account for a large proportion of the additive genetic variance (Verbyla et al., 2009; Erbe et al., 2012). BLUP-based models have been reported to have similar or higher accuracy than Bayesian models for traits that no known genes showing large effects (Luan et al., 2009; Silva et al., 2013). Therefore, we assumed that the growth traits of L. vannamei might be controlled by a large number of QTLs but with small effects. In a situation where the number of markers greatly outnumbers the number of genotyped animals, Bayesian models can take advantage of high-density markers and are expected to perform much better than BLUP-based models (Neves et al., 2014). In the present study, the low density of the markers might be a factor that contributed to the similar performance of the three models. Compared with BLUP-based models, Bayesian models are also able to efficiently capture the linkage disequilibrium information for a multi-breed reference population, but this advantage is reduced when there is a close relationship among the genotyped animals (Hayes et al., 2009b; Ostersen et al., 2011). For the L. vannamei population in the present study, all the individuals were from a full-sib family (Fig. 1) and this might potentially have affected the degree of performance of the Bayesian models.
In general, there appears to be increasing consensus that the heritability of a trait can affect the accuracy of the genomic prediction, and traits with high heritability can be predicted more accurately than those with low heritability (Daetwyler et al., 2010; Pszczola et al., 2012; Resende et al., 2012). In this study, we found the prediction reliability specific to body weight was significantly higher than the prediction reliability specific to body length for all three models, which might imply that body weight had higher heritability than body length in L. vannamei.
We believe that the current predictions produced by the three models could be improved by optimizing factors such as the density and distribution of markers, the size and structure of the training population, and the relation between training population and candidate population. Indeed, SNP density and distribution are crucial for the performance of statistical models. Solberg et al. (2008) and Weigel et al. (2009) found that significant gains in predictive ability were achieved by increasing the number of SNPs (Solberg et al., 2008; Weigel et al., 2009). Meuwissen (2009) suggested that 10NeL markers were required to ensure the accuracy of genomic prediction, where Ne is the effective population size and L the genome size in Morgans. Because the L. vannamei genome is large (Yu et al., 2015), the current number of SNPs is too low to capture high level genetic variations. It has been reported that SNPs chosen randomly across the genome might affect the stability of genomic prediction (Spindel et al., 2015). Thus, an appropriate increase of marker density and a more even distribution of SNPs should improve the accuracy and stability of genomic prediction.
The accuracy of genomic predictions can also be affected by the size and structure of the training population (Hayes et al., 2009a; Moser et al., 2009). The size of a training population depends mainly on the Ne of a given population, and a population with high Ne will require a large number of individuals to build the training set (Clark et al., 2012). In this study, all individuals were from a full-sib family. As a result, the Ne was very small so the size of the training population could be low. Thus, the size of the training population in this study might have relatively little effect on the performance of GS models, even if it is lower than ideal. When all the samples are from a full-sib family, both linkage and linkage disequilibrium information can be useful for detecting gene effects, and polygenic effects can be captured (Lee et al., 2008). Intra-family predictions generally produce higher accuracy than predictions across families. Furthermore, the relation between training population and candidate population also can greatly affect the performance of GS models, and close relationships between the two populations can result in more accurate genomic predictions (van der Werf et al., 2010; Clark et al., 2012; Pszczola et al., 2012). We propose that the close relation among all the samples in this study resulted in the good prediction performances obtained for all three models. However, some limitations still exist in the use of a single fullsib family for the analysis. This study focuses on the evaluation of GS models based on a homogeneous population, and cannot reflect the effect of population structure, which plays a comprehensive role in model construction. In practice, GS has usually been applied to a broad-based population that may present some degree of population stratification. Therefore, further analyses based on a broad-based population would be required to systematically assess the performance of genomic prediction for L. vannamei.
5 CONCLUSIONGenomic prediction promises accurate selection in L. vannamei breeding programs. Three prediction models, RR-BLUP, BayesA and Bayesian LASSO, appear to be applicable for GS in shrimp. The direction of future studies should involve efforts to increase the number of training population and mining more SNPs that are evenly distributed across genome to improve the performances of GS models.
| Andriantahina F, Liu X L, Huang H, Xiang J H, 2013. Selection for growth performance of tank-reared Pacific white shrimp, Litopenaeus vannamei. Chinese Journal of Oceanology and Limnology, 31(3): 534–541. Doi: 10.1007/s00343-013-2220-1 |
| Argue B J, Arce S M, Lotz J M, Moss S M, 2002. Selective breeding of Pacific white shrimp (Litopenaeus vannamei) for growth and resistance to Taura syndrome virus. Aquaculture, 204(3-4): 447–460. Doi: 10.1016/S0044-8486(01)00830-4 |
| Aulchenko Y S, Ripke S, Isaacs A, van Duijn C M, 2007. GenABEL:an R library for genome-wide association analysis. Bioinformatics, 23(10): 1. |
| Browning S R, Browning B L, 2007. Rapid and accurate haplotype phasing and missing-data inference for wholegenome association studies by use of localized haplotype clustering. The American Journal of Human Genetics, 81(5): 1084–1097. Doi: 10.1086/521987 |
| Castillo-Juárez H, Campos-Montes G R, Caballero-Zamora A, Montaldo H H, 2015. Genetic improvement of Pacific white shrimp[Penaeus (Litopenaeus) vannamei]:perspectives for genomic selection. Frontiers in Genetics, 6: 93. |
| Clark S A, Hickey J M, Daetwyler H D, vander Werf J H J, 2012. The importance of information on relatives for the prediction of genomic breeding values and the implications for the makeup of reference data sets in livestock breeding schemes. Genetics Selection Evolution, 44: 4. Doi: 10.1186/1297-9686-44-4 |
| Clark S A, Hickey J M, van der Werf J H J, 2011. Different models of genetic variation and their effect on genomic evaluation. Genetics Selection Evolution, 43: 18. Doi: 10.1186/1297-9686-43-18 |
| Cui Z, Hui M, Liu Y, Song C, Li X, Li Y, Liu L, Shi G, Wang S, Li F, Zhang X, Liu C, Xiang J, Chu K H, 2015. Highdensity linkage mapping aided by transcriptomics documents ZW sex determination system in the Chinese mitten crab Eriocheir sinensis. Heredity, 115(3): 206–215. Doi: 10.1038/hdy.2015.26 |
| Daetwyler H D, Calus M P L, Pong-Wong R, de los Campos G, Hickey J M, 2013. Genomic prediction in animals and plants:simulation of data, validation, reporting, and benchmarking. Genetics, 193(2): 347–365. Doi: 10.1534/genetics.112.147983 |
| Daetwyler H D, Hickey J M, Henshall J M, Dominik S, Gredler B, van der Werf J H J, Hayes B J, 2010. Accuracy of estimated genomic breeding values for wool and meat traits in a multi-breed sheep population. Animal Production Science, 50(12): 1004–1010. Doi: 10.1071/AN10096 |
| de los Campos G, Naya H, Gianola D, Crossa J, Legarra A, Manfredi E, Weigel K, Cotes J M, 2009. Predicting quantitative traits with regression models for dense molecular markers and pedigree. Genetics, 182(1): 375–385. Doi: 10.1534/genetics.109.101501 |
| de los Campos G, Pérez P, Vazquez A I, Crossa J, 2013. Genome-enabled prediction using the BLR (Bayesian Linear Regression) R-package. In:Gondro C, van der Werf J, Hayes B eds. Genome-Wide Association Studies and Genomic Prediction. Springer, New York: p.299–320. |
| Desta Z A, Ortiz R, 2014. Genomic selection:genome-wide prediction in plant improvement. Trends in Plant Science, 19(9): 592–601. Doi: 10.1016/j.tplants.2014.05.006 |
| Dou J Z, Li X, Fu Q, Jiao W Q, Li Y P, Li T Q, Wang Y F, Hu X L, Wang S, Bao Z M, 2016. Evaluation of the 2b-RAD method for genomic selection in scallop breeding. Scientific Reports, 6: 19. Doi: 10.1038/s41598-016-0018-z |
| Endelman J B, 2011. Ridge regression and other kernels for genomic selection with R package rrBLUP. The Plant Genome, 4(3): 250–255. Doi: 10.3835/plantgenome2011.08.0024 |
| Erbe M, Hayes B J, Matukumalli L K, Goswami S, Bowman P J, Reich C M, Mason B A, Goddard M E, 2012. Improving accuracy of genomic predictions within and between dairy cattle breeds with imputed high-density single nucleotide polymorphism panels. Journal of Dairy Science, 95(7): 4114–4129. Doi: 10.3168/jds.2011-5019 |
| Gao H, Su G, Janss L, Zhang Y, Lund M S, 2013. Model comparison on genomic predictions using high-density markers for different groups of bulls in the Nordic Holstein population. Journal of Dairy Science, 96(7): 4678–4687. Doi: 10.3168/jds.2012-6406 |
| Goddard M E, Hayes B J, 2007. Genomic selection. Journal of Animal Breeding and Genetics, 124(6): 323–330. Doi: 10.1111/jbg.2007.124.issue-6 |
| Habier D, Fernando R L, Dekkers J C M, 2007. The impact of genetic relationship information on genome-assisted breeding values. Genetics, 177(4): 2389–2397. |
| Hayes B J, Bowman P J, Chamberlain A C, Verbyla K, Goddard M E, 2009b. Accuracy of genomic breeding values in multi-breed dairy cattle populations. Genetics Selection Evolution, 41: 51. Doi: 10.1186/1297-9686-41-51 |
| Hayes B J, Bowman P J, Chamberlain A J, Goddard M E, 2009a. Invited review:Genomic selection in dairy cattle:progress and challenges. Journal of Dairy Science, 92(2): 433–443. Doi: 10.3168/jds.2008-1646 |
| Heslot N, Yang H P, Sorrells M E, Jannink J L, 2012. Genomic selection in plant breeding:a comparison of models. Crop Science, 52: 146–160. Doi: 10.2135/cropsci2011.06.0297 |
| Lee S H, van der Werf J H J, Hayes B J, Goddard M E, Visscher P M, 2008. Predicting unobserved phenotypes for complex traits from whole-genome SNP data. PLoS Genetics, 4(10): e1000231. Doi: 10.1371/journal.pgen.1000231 |
| Liu T F, Qu H, Luo C L, Shu D M, Wang J, Lund M S, Su G S, 2014. Accuracy of genomic prediction for growth and carcass traits in Chinese triple-yellow chickens. BMC Genetics, 15: 110. |
| Luan S, Luo K, Chai Z, Cao B X, Meng X H, Lu X, Liu N, Xu S Y, Kong J, 2015. An analysis of indirect genetic effects on adult body weight of the Pacific white shrimp Litopenaeus vannamei at low rearing density. Genetics Selection Evolution, 47: 95. Doi: 10.1186/s12711-015-0164-y |
| Luan T, Woolliams J A, Lien S, Kent M, Svendsen M, Meuwissen T H E, 2009. The accuracy of genomic selection in Norwegian red cattle assessed by crossvalidation. Genetics, 183(3): 1119–1126. Doi: 10.1534/genetics.109.107391 |
| Meuwissen T H E, Hayes B J, Goddard M E, 2001. Prediction of total genetic value using genome-wide dense marker maps. Genetics, 157(4): 1819–1829. |
| Meuwissen T. 2003. Genomic selection: the future of marker assisted selection and animal breeding. In: Marker Assisted Selection: A Fast Track to Increase Genetic Gain in Plant and Animal Breeding? Session Ⅱ: MAS in animals. FAO Electronic Forum on Biotechnology in Food and Agriculture: Conference 10. http://www.fao.org/biotech/docs/Meuwissen.pdf. |
| Meuwissen T, 2009. Accuracy of breeding values of 'unrelated' individuals predicted by dense SNP genotyping. Genetics Selection Evolution, 41: 35. Doi: 10.1186/1297-9686-41-35 |
| Moser G, Tier B, Crump R E, Khatkar M S, Raadsma H W, 2009. A comparison of five methods to predict genomic breeding values of dairy bulls from genome-wide SNP markers. Genetics Selection Evolution, 41: 56. Doi: 10.1186/1297-9686-41-56 |
| Neves H H R, Carvalheiro R, O'Brien A M P, Utsunomiya Y T, do Carmo A S, Schenkel F S, Sölkner J, McEwan J C, Van Tassell C P, Cole J B, da Silva M V G B, Queiroz S A, Sonstegard T S, Garcia J F, 2014. Accuracy of genomic predictions in Bos indicus (Nellore) cattle. Genetics Selection Evolution, 46: 17. Doi: 10.1186/1297-9686-46-17 |
| Nielsen H M, Sonesson A K, Yazdi H, Meuwissen T H E, 2009. Comparison of accuracy of genome-wide and BLUP breeding value estimates in sib based aquaculture breeding schemes. Aquaculture, 289(3-4): 259–264. Doi: 10.1016/j.aquaculture.2009.01.027 |
| Nirea K G, Sonesson A K, Woolliams J A, Meuwissen T H E, 2012. Strategies for implementing genomic selection in family-based aquaculture breeding schemes:double haploid sib test populations. Genetics Selection Evolution, 44: 30. Doi: 10.1186/1297-9686-44-30 |
| Ødegård J, Moen T, Santi N, Korsvoll S A, Kjøglum S, Meuwissen T H E. 2014. Genomic predictions in aquaculture: reliabilities in an admixed Atlantic salmon population. In: Proceedings, 10th World Congress of Genetics Applied to Livestock Production. ASAS (American Society of Animal Science), Vancouver. https: //asas. org/docs/default-source/wcgalp-proceedingsoral/081_paper_10366_manuscript_1555_0. pdf?sfvrsn=2. |
| Okpala C O R, Bono G, 2016. Investigating the biometric and physicochemical characteristics of freshly harvested Pacific white shrimp (Litopenaeus vannamei):a comparative approach. Journal of the Science of Food and Agriculture, 96(4): 1231–1240. Doi: 10.1002/jsfa.2016.96.issue-4 |
| Okpala C O R, Choo W S, Dykes G A, 2014. Quality and shelf life assessment of Pacific white shrimp (Litopenaeus vannamei) freshly harvested and stored on ice. LWT-Food Science and Technology, 55(1): 110–116. Doi: 10.1016/j.lwt.2013.07.020 |
| Ostersen T, Christensen O F, Henryon M, Nielsen B, Su G S, Madsen P, 2011. Deregressed EBV as the response variable yield more reliable genomic predictions than traditional EBV in pure-bred pigs. Genetics Selection Evolution, 43: 38. Doi: 10.1186/1297-9686-43-38 |
| Park T, Casella G, 2008. The Bayesian lasso. Journal of the American Statistical Association, 103(482): 681–686. Doi: 10.1198/016214508000000337 |
| Pszczola M, Strabel T, Mulder H A, Calus M P L, 2012. Reliability of direct genomic values for animals with different relationships within and to the reference population. Journal of Dairy Science, 95(1): 389–400. Doi: 10.3168/jds.2011-4338 |
| R Development Core Team. 2014. R: a language and environment for statistical computing. R Foundation for Statistical Computing, Vienna, Austria. ISBN 3-900051-07-0. http://www.r-project.org. |
| Resende M F R, Muñoz P Jr, Resende M D V, Garrick D J, Fernando R L, Davis J M, Jokela E J, Martin T A, Peter G F, Kirst M, 2012. Accuracy of genomic selection methods in a standard data set of loblolly pine (Pinus taeda L.). Genetics, 190(4): 1503–1510. Doi: 10.1534/genetics.111.137026 |
| Silva F F E, de Resende M D V, Rocha G S, Duarte D A S, Lopes P S, Brustolini O J B, Thus S, Viana J M S, Guimarães S E F, 2013. Genomic growth curves of an outbred pig population. Genetics and Molecular Biology, 36(4): 520–527. Doi: 10.1590/S1415-47572013005000042 |
| Solberg T R, Sonesson A K, Woolliams J A, Meuwissen T H E, 2008. Genomic selection using different marker types and densities. Journal of Animal Science, 86(10): 2447–2454. Doi: 10.2527/jas.2007-0010 |
| Sonesson A K, Meuwissen T H E, 2009. Testing strategies for genomic selection in aquaculture breeding programs. Genetics Selection Evolution, 41: 37. Doi: 10.1186/1297-9686-41-37 |
| Spindel J, Begum H, Akdemir D, Virk P, Collard B, Redoña E, Atlin G, Jannink J L, McCouch S R, 2015. Genomic Selection and association mapping in rice (Oryza sativa):effect of trait genetic architecture, training population composition, marker number and statistical model on accuracy of rice genomic selection in elite, tropical rice breeding lines. PLoS Genetics, 11(2): e1004982. Doi: 10.1371/journal.pgen.1004982 |
| Sui J, Luan S, Luo K, Meng X H, Lu X, Cao B X, Li W J, Chai Z, Liu N, Xu S Y, Kong J. 2015. Genetic parameters and response to selection for harvest body weight of pacific white shrimp, Litopenaeus vannamei. Aquaculture Research, 47(9): 2 795-2 803, http://dx.doi.org/10.1111/are.12729. |
| Sun X W, Liu D Y, Zhang X F, Li W B, Liu H, Hong W G, Jiang C B, Guan N, Ma C X, Zeng H P, Xu C H, Song J, Huang L, Wang C M, Shi J J, Wang R, Zheng X H, Lu C Y, Wang X W, Zheng H K, 2013. SLAF-seq:an efficient method of large-scale de novo SNP discovery and genotyping using high-throughput sequencing. Plos One, 8(3): e58700. Doi: 10.1371/journal.pone.0058700 |
| Tan J, Luan S, Luo K, Guan J T, Li W J, Sui J, Guo Z J, Xu S Y, Kong J. 2016. Heritability and genotype by environment interactions for growth and survival in Litopenaeus vannamei at low and high densities. Aquaculture Research, http://dx.doi.org/10.1111/are.12978. |
| Tayeh N, Klein A, Le Paslier M C, Jacquin F, Houtin H, Rond C, Chabert-Martinello M, Magnin-Robert J B, Marget P, Aubert G, Burstin J, 2015. Genomic prediction in pea:effect of marker density and training population size and composition on prediction accuracy. Frontiers in Plant Science, 6: 941. |
| van der Werf J H J, Kinghorn B P, Banks R G, 2010. Design and role of an information nucleus in sheep breeding programs. Animal Production Science, 50(12): 998–1. Doi: 10.1071/AN10151 |
| Verbyla K, Hayes B J, Bowman P J, Goddard M E, 2009. Accuracy of genomic selection using stochastic search variable selection in Australian Holstein Friesian dairy cattle. Genetics Research, 91(5): 307–311. Doi: 10.1017/S0016672309990243 |
| Weigel K A, de los Campos G, González-Recio O, Naya H, Wu X L, Long N, Rosa G J M, Gianola D, 2009. Predictive ability of direct genomic values for lifetime net merit of Holstein sires using selected subsets of single nucleotide polymorphism markers. Journal of Dairy Science, 92(10): 5248–5257. Doi: 10.3168/jds.2009-2092 |
| Yu Y, Wei J K, Zhang X J, Liu J W, Liu C Z, Li F H, Xiang J H, 2014. SNP discovery in the transcriptome of white Pacific shrimp Litopenaeus vannamei by next generation sequencing. PLoS One, 9(1): e87218. Doi: 10.1371/journal.pone.0087218 |
| Yu Y, Zhang X J, Yuan J B, Li F H, Chen X H, Zhao Y Z, Huang L, Zheng H K, Xiang J H, 2015. Genome survey and high-density genetic map construction provide genomic and genetic resources for the Pacific White Shrimp Litopenaeus vannamei. Scientific Reports, 5: 15612. Doi: 10.1038/srep15612 |
| Zhang Z, Zhang Q, Ding X D, 2011. Advances in genomic selection in domestic animals. Chinese Science Bulletin, 56(25): 2655–2663. Doi: 10.1007/s11434-011-4632-7 |