Institute of Oceanology, Chinese Academy of Sciences
Article Information
- WANG Jing(王晶), YUAN Dongliang(袁东亮), ZHAO Xia(赵霞)
- Impacts of Indonesian Throughflow on seasonal circulation in the equatorial Indian Ocean
- Chinese Journal of Oceanology and Limnology, 35(6): 1261-1274
- http://dx.doi.org/10.1007/s00343-017-6196-0
Article History
- Received Aug. 1, 2016
- accepted in principle Sep. 3, 2016
- accepted for publication Oct. 18, 2016
2 Laboratory for Ocean and Climate Dynamics, Qingdao National Laboratory for Marine Science and Technology, Qingdao 266237, China
Surface equatorial currents in the Indian Ocean exhibit strong seasonal variability. Ship drifter data show that surface currents in the equatorial Indian Ocean flow strongly eastward twice per year during the spring and fall (Schott and McCreary, 2001). The intense and narrow eastward surface currents occurring twice a year within 2° of the equator during monsoon transition time in spring and fall are now referred to as Wyrtki Jets (Wyrtki, 1973). Dynamically, the second baroclinic mode dominates semiannual oscillation of surface zonal currents, which is related to the semiannual period of zonal winds along the equator in the Indian Ocean. Wind-forced Kelvin and Rossby waves propagate eastward and westward. Reflections of these waves at the eastern and western boundaries cause a resonant oscillation (Clark and Liu, 1993; Jensen, 1993; Han et al., 1999; Yuan and Han, 2006; Nagura and McPhaden, 2010). The Rossby waves have much greater contribution to the equatorial semiannual oscillations of surface zonal currents than Kelvin waves (Nagura and McPhaden, 2010). Semiannual oscillations dominate seasonal sea level in the western and eastern Indian Ocean, and annual oscillations dominate in the central equatorial Indian Ocean (Reverdin, 1987; Yuan and Han, 2006; Nagura and McPhaden 2010). Kelvin and Rossby wave dynamics have comparable contributions to sea level variability along the equator (Yuan and Han 2006; Nagura and McPhaden 2010).
The Indonesian Throughflow (ITF) is the only lowlatitude conduit between the Indian and Pacific Oceans, and can carry warm and fresh water from the Pacific into the Indian Ocean through the Indonesian archipelago (Gordon and Fine, 1996). Studies have shown that the ITF can affect the Pacific and Indian Ocean circulation and surface heat flux, and even the global climate system (Godfrey, 1996; Zhou et al., 2008). Some authors have focused on ITF impacts on Pacific and Indian Ocean circulations and the global climate system by opening and closing Indonesian passages in ocean general circulation models and simple reduced-gravity models (Lee et al., 2002; Pandey et al., 2007), or on ITF effects on the formation of East Java upwelling at seasonal timescales (Kuswardani and Qiao, 2014). McCreary et al. (2007) investigated circulations associated with the ITF, particularly subsurface currents in the Pacific Ocean, using linear, continuously stratified, and nonlinear multiple-layer models and an ocean general circulation model. However, ITF influences on seasonal circulation at the equator in the Indian Ocean have not been elucidated. Sea level and thermocline variabilities associated with equatorial upwelling in the equatorial Indian Ocean are important to upper ocean thermodynamics and biogeochemical processes.
From the perspective of wave motions, two wave guides intersect in the Indonesian seas (Wijffels and Meyers, 2004). One is the equatorial Kelvin wave excited by tropical Indian Ocean local wind, which propagates eastward along the equator and then encounters the Indian Ocean eastern boundary. Because the Lombok Strait is open and wide enough for coastal Kelvin waves to pass (Durland and Qiu, 2003), they propagate along the Sumatra-Java coast and transport energy into the Indonesian seas via the straits. This means that leakage into the Pacific may reduce reflection efficiency of the eastern boundary in the Indian Ocean. The other wave guide is from the equatorial Pacific. Waves propagate southward in the Indonesian seas and along the western coast of Australia, and eventually radiate away to the west in the South Indian Ocean (Potemra, 2001; Wijffels and Meyers, 2004). Closing the Indonesian passages prevents these waves from penetrating. Waves generated in the Pacific do not reach the South Indian Ocean. Equatorial/coastal Kelvin waves generated in the Indian Ocean are reflected back to the west or propagate poleward. In this paper, we analyze the influence of closing ITF passages on waves in the Indian Ocean and focus on the ITF influence on seasonal variations of sea level and surface zonal current across the equatorial Indian Ocean. Model and data descriptions are presented in the following section. Model simulation results including wave analyses are described in Section 3. Finally, conclusions and a discussion are found in Section 4.
2 MATERIAL AND METHODThe ocean general circulation model used is LICOM 1.1, developed at the Laboratory of Numerical Modeling for Atmospheric Sciences and Geophysical Fluid Dynamics, Institute of Atmospheric Physics. This model has a free sea surface and nearly level vertical coordinates in the deep ocean. The model domain covers the quasi-global ocean (0°-360°, 78.5°S-90°N) with horizontal resolution 0.5° longitude × 0.5° latitude. There are a total of 30 levels in the vertical, with 12 evenly-distributed layers in the upper 300 m. The model has been spun up for 900 years using Levitus climatological forcing from the rest. Model surface temperature and salinity are relaxed to the Levitus climatology at half-year time scale (Levitus et al., 1998). Model configuration details are in Liu et al.(2004, 2005). A control run with real open ITF passages (OPENR) was conducted for 64 years (1948-2011) using daily forcing of wind stress and heat flux from NCEP reanalysis data. To compare influences of ITF, a sensitivity run (CLOSER) was conducted with the same forcing and closing the ITF outflow straits for those 64 years. Therefore, the difference between OPENR and CLOSER represents the net impacts of ITF on the Indian Ocean. In other words, that ocean cannot be affected in CLOSER experiment through the ocean channel (ITF) from the Pacific. Figure 1 shows the model grid with ITF passages open (Fig. 1a) and closed (Fig. 1b). LICOM 1.0 could not simulate the partitioning of inflow and outflow transports well in Li et al. (2004) in comparison with LICOM 2.0 with its high resolution (0.1° longitude × 0.1° latitude; Feng et al., 2013). However, it can simulate the annual mean and seasonal cycle of ITF transport reasonably realistically (Li et al., 2004; Liu et al., 2005) compared with LICOM 2.0 (Feng et al., 2013). The LICOM 1.1 version used herein improves the model domain of the open sea over 75°S-65°N to a quasi-global ocean, and transport through the Lombok and Timor straits has been improved relative to the prior version. Therefore, comparison between the two runs can be used to assess the ITF influence on the seasonal circulation of the equatorial Indian Ocean. The present analysis is based on monthly average LICOM output from 2000-2011.

|
| Figure 1 Enlarged grid of Indonesian region with open (a) and closed (b) ITF outflow straits |
We used World Ocean Atlas 2013 version 2 (WOA13) data to validate model-simulated vertical profiles of density and buoyancy frequency square. WOA13 is a set of objectively analyzed climatological fields of in situ temperature and salinity (Boyer et al., 2013). Annual mean density and the buoyancy frequency square were calculated based on WOA13 data. Observed monthly sea level anomalies (SLA) from 2000 to 2011 were used to study SLA seasonal variability in the equatorial Indian Ocean, using Archiving, Validation, and Interpretation of Satellite Oceanographic data (AVISO). In addition, monthly Ocean Surface Current Analyses Real Time (OSCAR) data during 2001-2011 were used to validate modelsimulated surface zonal current seasonality along the equator.
Finally, the LICOM output from OPENR and CLOSER was decomposed into equatorial waves to study wave dynamics of the seasonal cycle in the Indian Ocean. The wave decomposition method used is the same as that in Yuan and Han (2006), and its procedure was described by Yuan et al. (2004).
3 RESULTIn this section, model-simulated mean states are validated with observations and compared between OPENR and CLOSER. In addition, seasonal variability of sea level and zonal currents are compared and analyzed to study ITF influence on the seasonal circulation in the equatorial Indian Ocean.
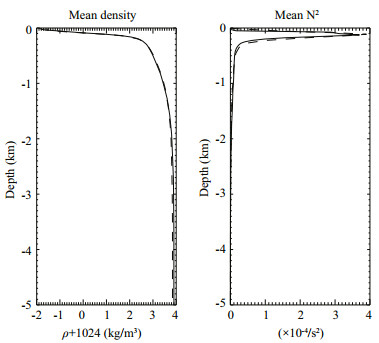
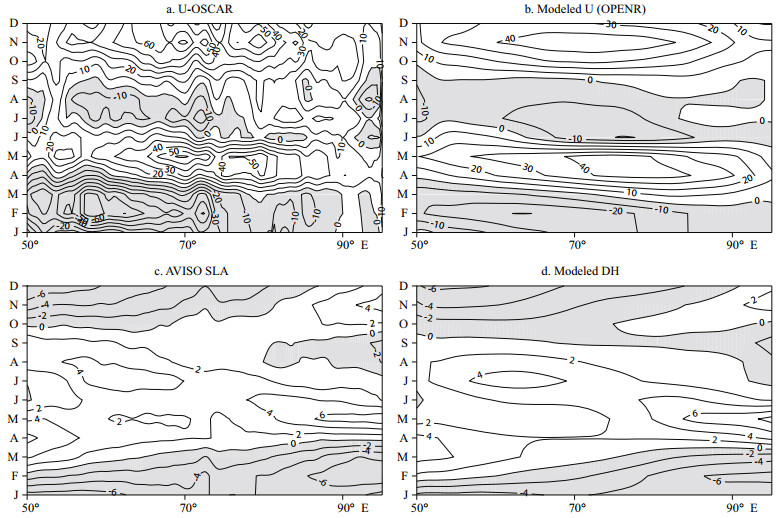
3.1 Model validationFigure 2 shows vertical profiles of mean density and buoyancy frequency squared averages over the entire Indian Ocean from the OPENR experiment for 2000-2011. The average stratification and buoyancy frequency are consistent with WOA13 data (Boyer et al., 2013), suggesting that the mean stratification in the model is realistic. The model also effectively simulated subsurface temperature and salinity, except with slightly lower temperatures and higher salinity (not shown). Figure 3 shows seasonal variability of the surface zonal current and sea level from LICOM simulations as compared with OSCAR current and altimeter data. A seasonal climatology of zonal current and sea level from 2000 to 2011 was extracted. The dynamic height from LICOM was adjusted by NCEP seasonal atmospheric surface pressure. This adjustment turned out to be small. LICOM-simulated seasonality of the surface zonal current and sea level agreed well with observed OSCAR and AVISO data. However, LICOM simulated slightly weaker Wyrki jets than the OSCAR data, which may be attributed to inaccuracies of drag coefficient in the wind stress calculation. In addition, LICOM could reproduce the dominant semiannual oscillations of surface zonal current in the equatorial Indian Ocean in consistency with OSCAR data. LICOM also well reproduced the dominant semiannual oscillations of sea level in the western and eastern Indian Ocean, as well as the annual oscillation in the central part of that ocean, with comparison to AVISO data. Therefore, LICOM model output can be used to evaluate the ITF influence.
|
| Figure 2 Modeled vertical profiles (dashed) of mean density (left) and buoyancy frequency squared (right) compared with WOA13 data (solid) |
|
| Figure 3 Hovmöller plots of seasonal sea level anomalies averaged over 5°S-5°N along the equator from (a) AVISO altimeter data and (b) OPENR simulation, plus zonal equatorial currents (c) from OSCAR data and (d) OPENR simulation |
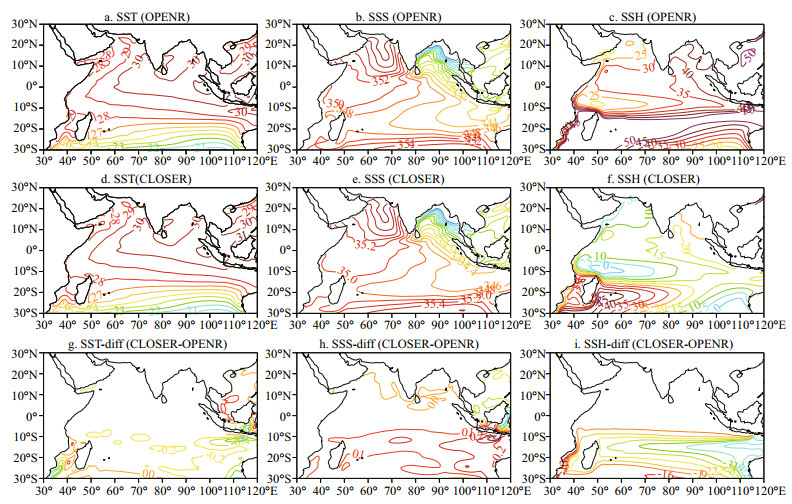
Figure 4 (upper panel) shows simulated mean states of SST, sea surface salinity (SSS), and sea surface height (SSH) from the OPENR run (open ITF passages), in comparison with those from the CLOSER run (closed ITF passages). Differences of SST, SSS and SSH between OPENR and CLOSE are also shown in the bottom panel (Fig. 4). After closing the ITF outflow straits, LICOM simulated lower SST, higher SSS, and lower SSH in the southern Indian Ocean. The influence region of ITF on SST and SSS is mainly near the Sumatra-Java coast and south of 8°S. ITF closure causes lower SSH across the entire Indian Ocean, with large negative values in its southern part. Negative values smaller than -15 cm are not plotted in Fig. 4i. These findings suggest that ITF closure can prevent warmer and fresher water intrusion to the Indian Ocean from the Pacific and depress the thermocline in the former ocean, consistent with previous studies (Lee et al., 2002).
|
| Figure 4 OPENR-simulated SST (a), SSS (b) and SSH (c); CLOSER-simulated SST (d), SSS (e) and SSH (f); difference between OPENR and CLOSER of SST (g), SSS (h) and SSH (i) |
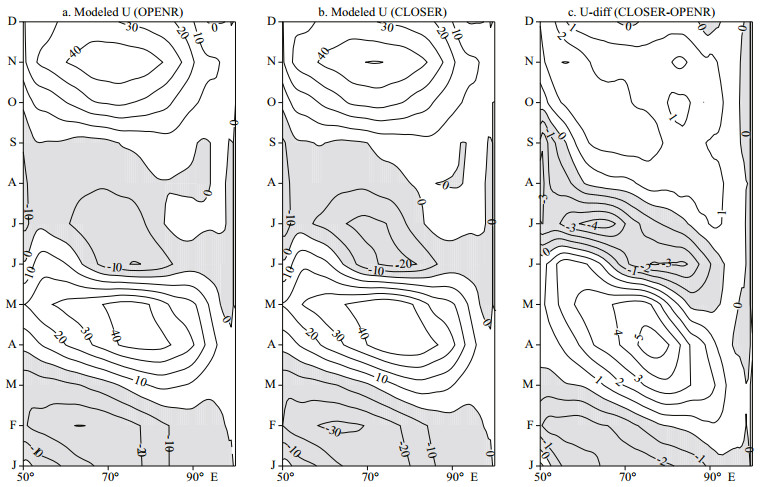
Figure 5 shows simulated seasonal surface zonal currents from OPENR in comparison with CLOSER. The latter experiment simulated a seasonality of zonal current similar to the former. The semiannual oscillation of zonal currents dominated in CLOSER, again consistent with OSCAR observations. The difference (Fig. 5c) between OPENR and CLOSER suggests that the latter can simulate larger amplitudes of surface currents, including Wyrtki jets and westward equatorial currents associated with ITF blockage. The largest amplitude of zonal current difference reached 20% of the surface currents. Therefore, ITF-caused zonal current differences cannot be ignored. The zonal current difference between the two runs also showed semiannual oscillation (Fig. 5c).
|
| Figure 5 (a) OPENR-simulated equatorial zonal current averaged over 5°S-5°N along equator; (b) CLOSER-simulated equatorial zonal current averaged over 5°S-5°N along equator; (c) difference of zonal equatorial currents between OPENR and CLOSER |
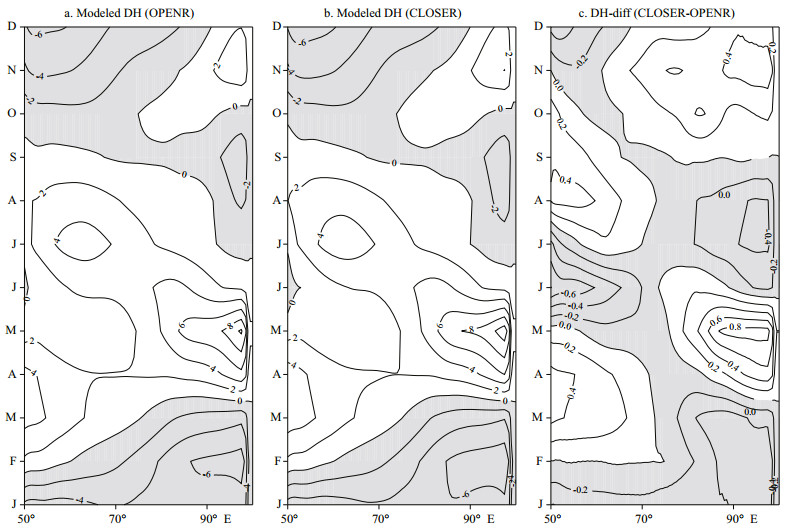
Figure 6 shows the seasonality comparison of sea level difference between OPENR and CLOSER. CLOSER simulated a sea level seasonality similar to that of OPENR, except for a slight difference in amplitude. Semiannual oscillation in the western and eastern Indian Ocean and annual oscillation in the central part of that ocean dominated in both runs. The difference between the two runs also showed semiannual oscillation over the entire ocean but inconsistent amplitude variations in its westerncentral and eastern portions, in contrast with the dominant annual oscillation coexisting with the dominant semiannual oscillation of sea level. The contrasting behavior between modeled sea level and the sea level difference between OPENR and CLOSER suggests different dynamics from the effects of ITF.
|
| Figure 6 (a) OPENR-simulated surface dynamic height averaged over 5°S-5°N along equator; (b) CLOSER-simulated surface dynamic height averaged over 5°S-5°N along equator; (c) difference of surface dynamic height between OPENR and CLOSER |
Comparison of sea level and zonal current between OPENR and CLOSER suggests that ITF blockage cannot alter the pattern of sea level (Fig. 6a, b) and surface zonal current (Fig. 5a, b) but can affect their strength. Semiannual oscillation of the difference for both sea level and zonal current between the two runs may have had similar wave dynamics, different from the suggestions in previous studies (Yuan and Han, 2006; Nagura and McPhaden, 2010).
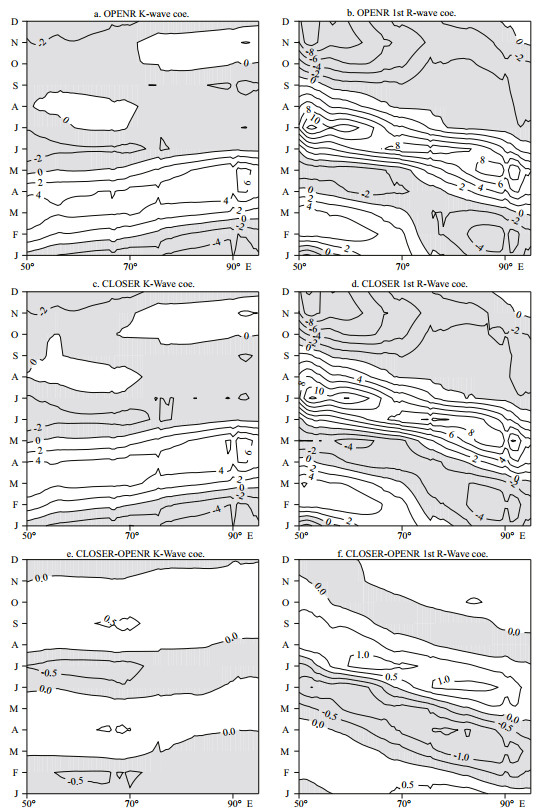
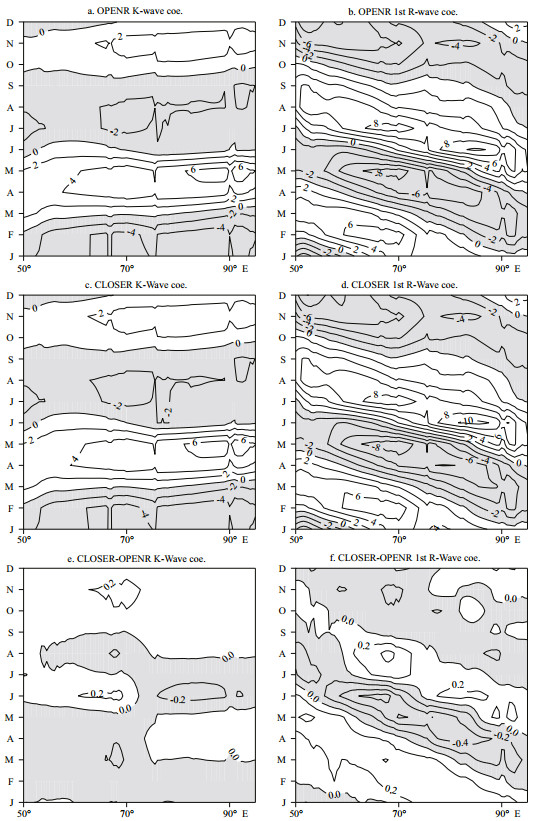
3.3 Wave dynamics in OPENR and CLOSERCoefficients of long equatorial Kelvin and Rossby waves were extracted from the model simulations to study the wave dynamics of sea level and zonal current seasonality. Figure 7 shows coefficients of the decomposed Kelvin wave and first meridional-mode Rossby waves of the first baroclinic mode from the OPENR and CLOSER experiments. Differences of Kelvin and Rossby wave coefficients are shown in the bottom panel. Figure 8 shows the same wave coefficient but for the second baroclinic mode. Here, positive (negative) contours indicate downwelling (upwelling) waves. Although the second meridionalmode Rossby waves participate in western boundary reflection in linear theory because of inclination of that boundary, wave coefficients with small amplitudes are ignored here for simplicity. The structure of the equatorial wave coefficients is reminiscent of the SLA in Fig. 6. Kelvin waves originate from the western boundary and propagate eastward. Both the Kelvin and first meridional-mode Rossby waves of the first baroclinic mode exhibit semiannual oscillation (Fig. 7). Kelvin and Rossby waves of the second baroclinic mode also show semiannual oscillation (Fig. 8). As suggested by Yuan and Han (2006), the structures of wind stress projecting into the second baroclinic mode waves are similar to those of the first baroclinic waves (Fig. 4 in Yuan and Han), except for larger amplitude. Amplitudes of the second baroclinic waves associated with the projected wind stress are much larger than those of the first baroclinic waves (Gent et al., 1983; Reverdin, 1987; Han et al., 1999). The sea level variations of Kelvin and the first meridional-mode Rossby waves exhibit inconsistent phase in the central basin and strongly cancel each other. However, surface currents of the Kelvin and Rossby waves enhance each other in the central basin because the positive (negative) Rossby wave coefficients correspond to westward (eastward) zonal current variations along the equator. Linear reflections of the semiannual harmonics at the meridional boundaries are important in the concurrence of dominant annual harmonics of sea level and dominant semiannual harmonics of surface zonal current in the central equatorial Indian Ocean, as explained in Yuan and Han (2006). Details of the wave dynamics are not repeated here. We focus on the net influence of ITF on those dynamics.
|
| Figure 7 Decomposed Kelvin wave coefficients (a) and first meridional-mode Rossby wave coefficients (b) from OPENR experiment. Decomposed Kelvin wave coefficients (c) and first meridional-mode Rossby wave coefficients (d) from CLOSER experiment, difference (e) between (c) and (a) and difference (f) between (d) and (b) of first baroclinic mode. Contour units are 0.33 m and 1.31 cm/s for Kelvin wave sea level and surface zonal current at equator, respectively, and 0.14 m and -1.61 cm/s for first meridional-mode Rossby waves |
|
| Figure 8 Decomposed Kelvin wave coefficients (a) and first meridional-mode Rossby wave coefficients (b) from OPENR experiment. Decomposed Kelvin wave coefficients (c) and first meridional-mode Rossby wave coefficients (d) from CLOSER experiment, difference (e) between (c) and (a) and difference (f) between (d) and (b) of second baroclinic mode |
Based on the difference of sea level (Fig. 6c) and surface zonal currents (Fig. 5c) along the equator, net influences of ITF on the two display semiannual oscillations. Net influences of ITF on Kelvin and first meridional-mode Rossby waves also reveal semiannual oscillations for the first baroclinic mode. However, the net influence of ITF on those waves show annual oscillations of Kelvin waves in the entire basin and Rossby waves in the western-central basin, plus semiannual oscillation in the eastern basin for the second baroclinic mode. In addition, wave coefficients of the first baroclinic mode larger than those of the second baroclinic mode are evidenced (Figs. 7e-f and 8e-f). These results suggest that possible wave dynamics of the net ITF influence are different from the contrasting behavior of sea level and zonal currents.
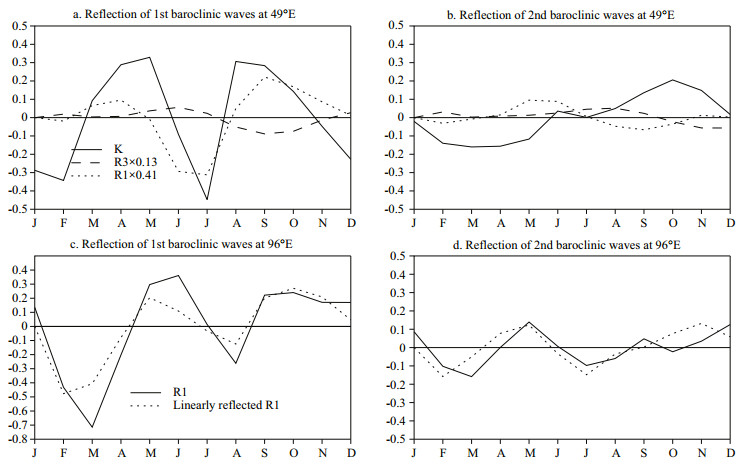
Based on the design of the OPENR and CLOSER experiments, differences of Kelvin and Rossby waves can only occur at the western and eastern boundaries because of the same forcing in LICOM. The influence of ITF on the Indian Ocean is mainly in the southern Indian Ocean and near the outflow straits region (Fig. 4), suggesting that ITF mainly affects offequatorial Rossby waves. Therefore, ITF blockage may alter seasonal circulations at the equator through such waves. Figure 9 shows the difference between OPENR and CLOSER of western and eastern boundary reflections of the first and second baroclinic mode. Reflection coefficients were calculated using linear theoretical values estimated for a straight coastline and low-frequency waves (Clarke, 1983). Western boundary reflection exhibits a semiannual oscillation of Kelvin waves, with larger amplitude of the first baroclinic mode (Fig. 9a) than that of the second baroclinic mode (Fig. 9b), suggesting the dominant role of the first mode. Similarly, eastern boundary reflection displays semiannual oscillation of the first meridional Rossby wave, with larger amplitude of the first baroclinic mode (Fig. 9a). This boundary reflection difference suggests the net ITF influence on seasonal circulation of the equatorial Indian Ocean through western and eastern boundary reflection. The agreement between the solid and dotted curve in Fig. 9c suggests that reflected Rossby waves at 96°E are more attributable to eastern boundary reflection than to waves from Indonesian passages. Figure 6c shows positive SLA during April-May and September-November in the east and July-October and February-April in the west. The time lag between the eastern and western anomalies is 3-4 months, which roughly coincides with the time for a baroclinic first or second mode Rossby wave to cross the basin. Positive anomalies in August-September near the western boundary might represent this westward propagating signal if SLA in April-May in the east propagate westward off the equator and eventually reach the western boundary (the same for negative anomalies). However, SLA along 10°S suggest that the net influence of ITF on the dynamic height (Fig. 6c) is not from the reflection off-equatorial Rossby waves, because no positive anomalies are seen during July-December (figure not shown). Therefore, the net influence of ITF on seasonal circulation in the equatorial Indian Ocean is mainly caused by waves generated in the equatorial part of that ocean, not from the Pacific. Further, eastern boundary reflection is important in ITF blockagecaused variations. This is intuitive from the perspective of wave propagation and reflection, and eastern boundary reflection strengthens when ITF passages are closed. This can lead to larger-amplitude reflected Rossby waves, more efficient basin-mode resonance, and larger-amplitude variability in the equatorial region. In fact, the wave coefficients are consistent with this (Fig. 7f). The amplitude of zonal velocity variability between OPENR and CLOSER also confirms this.
|
| Figure 9 Difference (a) in western boundary reflection of first baroclinic mode between OPENR and CLOSER; (b) same as (a), but for second baroclinic mode. Solid curves indicate difference of Kelvin wave coefficients between OPENR and CLOSER at western boundary. Dotted curves represent difference of Kelvin wave coefficients reflected from the first meridional Rossby wave and dashed curves indicate difference of Kelvin wave coefficients reflected from the third meridional Rossby wave. Difference (c) in eastern boundary reflection of first baroclinic mode between OPENR and CLOSER; (d) same as (c), but for second baroclinic mode. Solid curves represent difference of first meridional Rossby wave coefficients and dotted curves the difference of first Rossby wave coefficient linearly reflected from Kelvin waves (i.e., Kelvin wave coefficients at eastern boundary multiplied by Kelvin wave reflection ratio) |
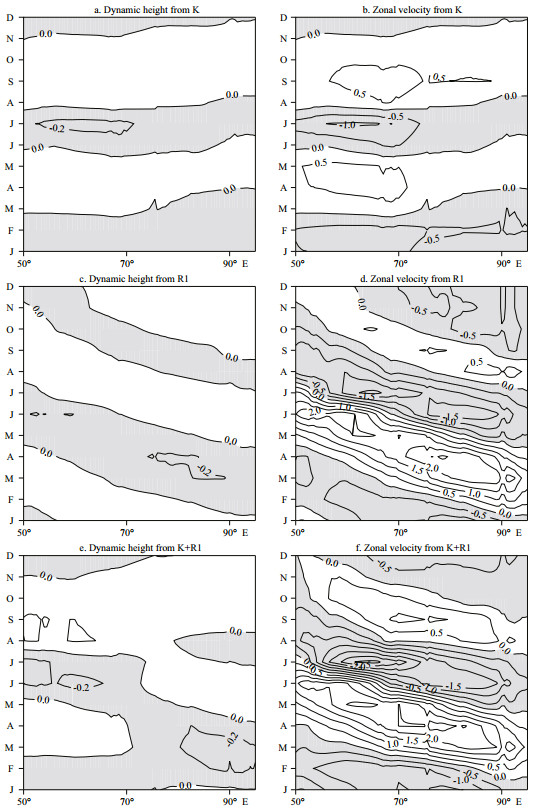
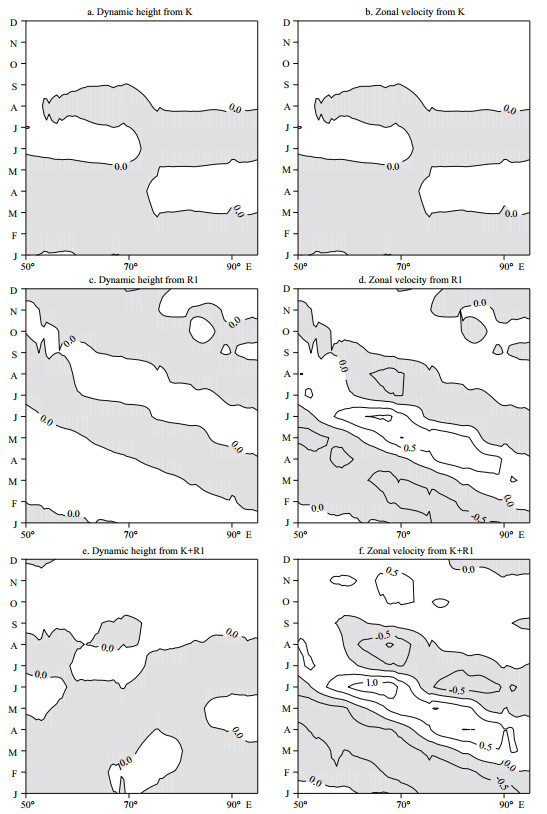
To further investigate the influence of boundary reflection on zonal current and sea level, zonal currents and sea level were reconstructed based on the difference of Kelvin and Rossby wave coefficients. Figure 10 shows the reconstructed sea level and zonal current along the equator, from the difference between OPENR and CLOSER of decomposed Kelvin and Rossby waves of the first baroclinic mode. Figure 11 shows the same as Fig. 10 but for the second baroclinic mode. The reconstructed fields basically reproduce the seasonal variations from LICOM as shown in Yuan and Han (2006). Here we only show results related to the net influence of ITF. The sea level from Kelvin waves, first meridional-mode Rossby waves, and superposition of Kelvin and Rossby waves are shown in the left panel of Fig. 10. Kelvin and first meridional Rossby waves can reproduce the semiannual oscillation, in contrast with the sea level difference between OPENR and CLOSER. This is because the sea level difference shows a different semiannual oscillation in the western-central and eastern Indian Ocean. However, the superposition of Kelvin and Rossby waves of the first baroclinic mode reproduced a consistent semiannual oscillation with sea level difference between OPENR and CLOSER (Fig. 6c), except for a slightly smaller amplitude. For the second baroclinic mode, both the Kelvin and first meridional-mode Rossby waves could not reproduce the semiannual oscillation. Reconstructed sea level from superposition of the Kelvin and first meridionalmode Rossby waves is much smaller in amplitude (Fig. 11c) than that of the first baroclinic mode. These findings suggest that the superposition of Kelvin and Rossby waves of the first mode has a larger contribution than that of the second mode.
|
| Figure 10 Reconstructed surface dynamic height from (a) Kelvin wave; (c) first meridional-mode Rossby wave; (e) superposition of (a) and (c); and reconstructed zonal speed from (b) Kelvin wave; (d) first meridional-mode Rossby wave; (f) superposition of (b) and (d) of first baroclinic mode |
|
| Figure 11 Reconstructed surface dynamic height from (a) Kelvin wave; (c) first meridional-mode Rossby wave; (e) superposition of (a) and (c); and reconstructed zonal speed from (b) Kelvin wave; (d) first meridional-mode Rossby wave; (f) superposition of (b) and (d) of second baroclinic mode |
Surface zonal current from Kelvin waves, first meridional-mode Rossby waves, and the superposition of Kelvin and Rossby waves are shown in the right panel of Fig. 10. The Kelvin and first meridional Rossby waves reproduced the semiannual oscillation, as did the zonal current difference between OPENR and CLOSER (Fig. 5c). However, the dominant structure of zonal velocity was reconstructed by the first meridional-mode Rossby waves of the first baroclinic mode, except for a slight difference in winter. Zonal currents reconstructed from Kelvin waves of the second baroclinic mode were much weaker than those from the first meridional-mode Rossby waves, and the Kelvin waves of the first baroclinic mode reproduced the consistent semiannual oscillation but not the structure of zonal current difference between OPENR and CLOSER (Fig. 5c). For the second baroclinic mode, only the first meridional-mode Rossby wave reproduced the semiannual oscillation of zonal current, except for a phase different than that of the first baroclinic mode. Reconstructed zonal currents from superposition of the Kelvin and first meridional-mode Rossby waves are out of phase (Fig. 11c) with the difference of zonal currents as shown in Fig. 5, and are also weaker than those of the first baroclinic mode. These results suggest that the first meridional-mode Rossby waves of the first baroclinic mode have a greater contribution than that of the second baroclinic mode. In fact, the third baroclinic mode (not shown) also has a minor role in reconstructing zonal current and sea level difference influenced by ITF. However, the first baroclinic mode has a greater contribution than the third mode.
4 CONCLUSIONImpacts of the ITF on the seasonal circulation of the equatorial eastern Indian Ocean were investigated using the ocean-only model LICOM, by opening and closing ITF passages. LICOM had daily wind forcing and heat flux from NCEP reanalysis Ⅰ data of 1948-2011. Our analyses were based on LICOM output from 2000 to 2011. The OPENR experiment reproduced vertical profiles of mean density and buoyancy frequency. It reconstructed annual SLA oscillations in the central Indian Ocean and semiannual oscillations in the eastern part of that ocean using satellite altimeter data, plus semiannual oscillations of surface zonal equatorial currents over the entire ocean using OSCAR current data. The difference of mean state between OPENR and CLOSER demonstrates that the ITF strongly affects the southern Indian Ocean and outflow straits regions. The wave decomposition method was used to analyze the propagation and reflection of equatorial long waves based on OPENR and CLOSER output. Wave analysis indicates that semiannual oscillations of SLA and zonal current at the equator from net ITF influence are mainly dominated by waves generated in the Indian Ocean and not the Pacific. Eastern boundary reflection in the eastern Indian Ocean is important in the variations of seasonal circulation caused by ITF blockage. Reconstructed SLA from net ITF influence between the OPENR and CLOSER experiments suggest that both Kelvin and Rossby waves from the first baroclinic mode have comparable contributions to the semiannual oscillations of SLA difference. However, reconstructed surface zonal current at the equator influenced by ITF suggests that first meridional-mode Rossby waves have much greater contribution than Kelvin waves of the first baroclinic mode. Both reconstructed sea level and zonal currents demonstrate that the first baroclinic modes have greater contributions than other high-order modes. The propagation and reflection of off-equatorial waves will be studied in the future.
5 ACKNOWLEDGMENTValuable suggestions from two anonymous reviewers are gratefully acknowledged.
| Boyer T P, Antonov J I, Baranova O K, Coleman C, Garcia H E, Grodsky A, Johnson D R, Locarnini R A, Mishonov A V, O'Brien T D, Paver C R, Reagan J R, Seidov D, Smolyar I V, Zweng M M. 2013. World Ocean Database 2013. Sydney Levitus, Ed., Alexey Mishonov, Technical Ed., NOAA Atlas NESDIS 72. 209p. |
| Clarke A J, Liu X, 1993. Observations and dynamics of semiannual and annual sea levels near the Eastern Equatorial Indian ocean boundary. J. Phys. Oceanogr., 23(2): 386–399. Doi: 10.1175/1520-0485(1993)023<0386:OADOSA>2.0.CO;2 |
| Clarke A J, 1983. The reflection of equatorial waves from oceanic boundaries. J. Phys. Oceanogr., 13(7): 1193–1207. Doi: 10.1175/1520-0485(1983)013<1193:TROEWF>2.0.CO;2 |
| Durland T S, Qiu B, 2003. Transmission of subinertial Kelvin waves through a strait. J. Phys. Oceanogr., 33(7): 1337–1350. Doi: 10.1175/1520-0485(2003)033<1337:TOSKWT>2.0.CO;2 |
| Feng X, Liu H L, Wang F C, Yu Y Q, Yuan D L, 2013. Indonesian Throughflow in an eddy-resolving ocean model. Chin. Sci. Bull., 58(35): 4504–4514. Doi: 10.1007/s11434-013-5988-7 |
| Gent P R, Oneill K, Cane M A, 1983. A Model of the Semiannual Oscillation in the Equatorial Indian-Ocean. J.Phys. Oceanogr., 13(12): 2148–2160. Doi: 10.1175/1520-0485(1983)013<2148:AMOTSO>2.0.CO;2 |
| Godfrey J S, 1996. The effect of the Indonesian throughflow on ocean circulation and heat exchange with the atmosphere:a review. J. Geophys. Res., 101(C5): 12217–12237. Doi: 10.1029/95JC03860 |
| Gordon A L, Fine R A, 1996. Pathways of water between the Pacific and Indian oceans in the Indonesian seas. Nature, 379(6561): 146–149. Doi: 10.1038/379146a0 |
| Gordon A L, 2005. Oceanography of the Indonesian Seas and their throughflow. Oceanography, 18(4): 14–27. Doi: 10.5670/oceanog |
| Han W Q, McCreary J P, Anderson D L T, Mariano A J, 1999. Dynamics of the eastern surface jets in the equatorial Indian Ocean. J. Phys. Oceanogr., 29(9): 2191–2209. Doi: 10.1175/1520-0485(1999)029<2191:DOTESJ>2.0.CO;2 |
| Jensen T G, 1993. Equatorial variability and resonance in a wind-driven Indian Ocean model. J. Geophys. Res., 98(C12): 22533–22552. Doi: 10.1029/93JC02565 |
| Kuswardani R T D, Qiao F L, 2014. Influence of the Indonesian Throughflow on the upwelling off the east coast of the South Java. Chin. Sci. Bull., 59(33): 4516–4523. Doi: 10.1007/s11434-014-0549-2 |
| Lee T, Fukumori I, Menemenlis D, Xing Z F, Fu L L, 2002. Effects of the Indonesian Throughflow on the Pacific and Indian oceans. J. Phys. Oceanogr., 32(5): 1404–1429. Doi: 10.1175/1520-0485(2002)032<1404:EOTITO>2.0.CO;2 |
| Levitus S, Boyer T P, Conkright M E, O'Brien T, Antonov J, Stephens C, Stathoplos L, Johnson D, Gelfeld R. 1998. World Ocean Database 1998, Vol. 1: Introduction, NOAA Atlas NESDIS 18. NOAA, Silver Spring, MD. 346p. |
| Li W, Liu H H, Zhang X L, 2004. Indonesian Throughflow in an eddy-permitting oceanic GCM. Chin. Sci. Bull., 49(21): 2305–2310. Doi: 10.1360/04wd0045 |
| Liu H L, Li W, Zhang X H, 2005. Climatology and variability of the Indonesian Throughflow in an eddy-permitting oceanic GCM. Adv. Atmos. Sci., 22(4): 496–508. Doi: 10.1007/BF02918483 |
| Liu H L, Yu Y Q, Li W, Zhang X H. 2004. LASG/IAP Climate System Ocean Model (LICOM1. 0): User's Manual. Science Press, Beijing, China. p. 1-10. (in Chinese) |
| McCreary J P, Miyama T, Furue R, Jensen T, Kang H W, Bang B, Qu T D, 2007. Interactions between the Indonesian Throughflow and circulations in the Indian and Pacific Oceans. Prog. Oceanogr., 75(1): 70–114. Doi: 10.1016/j.pocean.2007.05.004 |
| Nagura M, McPhaden M J, 2010. Dynamics of zonal current variations associated with the Indian Ocean dipole. J.Geophys. Res., 115(C11): C11026. Doi: 10.1029/2010JC006423 |
| Pandey V K, Bhatt V, Pandey A C, Das I M L, 2007. Impact of Indonesian throughflow blockage on the Southern Indian Ocean. Curr. Sci., 93(3): 399–406. |
| Potemra J T, 2001. Contribution of equatorial Pacific winds to southern tropical Indian Ocean Rossby waves. J. Geophys.Res., 106(C2): 2407–2422. Doi: 10.1029/1999JC000031 |
| Reverdin G, 1987. The upper equatorial Indian Ocean.The climatological seasonal cycle. J. Phys. Oceanogr., 17(7): 903–927. Doi: 10.1175/1520-0485(1987)017<0903:TUEIOT>2.0.CO;2 |
| Schott F A, McCreary J P Jr, 2001. The monsoon circulation of the Indian Ocean. Prog. Oceanogr., 51(1): 1–123. Doi: 10.1016/S0079-6611(01)00083-0 |
| Wijffels S, Meyers G, 2004. An intersection of oceanic waveguides:variability in the Indonesian Throughflow region. J. Phys. Oceanogr., 34(5): 1232–1253. Doi: 10.1175/1520-0485(2004)034<1232:AIOOWV>2.0.CO;2 |
| Wyrtki K, 1973. Equatorial Jet in Indian Ocean. Science, 181(4096): 264–266. Doi: 10.1126/science.181.4096.264 |
| Yuan D L, Han W Q, 2006. Roles of equatorial waves and western boundary reflection in the seasonal circulation of the equatorial Indian Ocean. J. Phys. Oceanogr., 36(5): 930–944. Doi: 10.1175/JPO2905.1 |
| Yuan D L, Rienecker M M, Schopf P S, 2004. Long wave dynamics of the interannual variability in a numerical hindcast of the equatorial Pacific Ocean circulation during the 1990s. J. Geophys. Res., 109(C5): C05019. |
| Zhou L, Murtugudde R, Jochum M, 2008. Seasonal influence of Indonesian Throughflow in the southwestern Indian Ocean. J. Phys. Oceanogr., 38(7): 1529–1541. Doi: 10.1175/2007JPO3851.1 |
 2017, Vol. 35


