 2017, Vol. 35
Institute of Oceanology, Chinese Academy of Sciences
Article Information
- WU He(武贺), WANG Xin(王鑫), WANG Bingzhen(王兵振), BAI Yang(白杨), WANG Peitao(王培涛)
- Evaluation of tidal stream energy and its impacts on surrounding dynamics in the Eastern Region of Pingtan Island, China
- Chinese Journal of Oceanology and Limnology, 35(6): 1319-1328
- http://dx.doi.org/10.1007/s00343-017-0187-z
Article History
- Received Jul. 7, 2016
- accepted in principle Sep. 9, 2016
- accepted for publication Oct. 20, 2016


2 National Ocean Technology Center, Tianjin 300112, China;
3 National Marine Environmental Forecasting Center, Beijing 100081, China;
4 Key Laboratory of Research on Marine Hazards Forecasting, National Marine Environmental Forecasting Center, State Oceanic Administration, Beijing 100081, China
Global climate change and the decreasing availability of fossil-fuel energy have led to increased interest in renewable energy sources. Compared with other clean energy sources, marine renewable energy has the advantages of predictability and relatively less environmental interference. Tidal stream energy has received increasing attention in coastal countries such as the United Kingdom, United States, and Canada. These countries have developed corresponding plans and policies (ECOES, 2012) for the implementation of tidal stream energy, and they have established a variety of funding programs to promote its development. China has paid great attention to the development of tidal stream energy, and many programs have been conducted in recent years to consider the utilization of this resource, supported by the National Natural Science Foundation of China, National Science and Technology Support Program, 908 Special Funds, Ocean Energy Special Funds, and various other funds.
The tidal stream energy resource is plentiful along the Chinese offshore region. As part of the "Zoning of Marine Energy Resources in Chinese Coastal Rural Areas, " plan, Wang and Lu (2009) computed the potential tidal steam energy of 130 channels according to tidal stream information derived from marine charts. They estimated a theoretical annual amount of tidal stream energy resource of about 13.96 GW. In a recent evaluation of marine energy resources, Han (2015) estimated the tidal stream energy resources of several main channels from ocean modeling, which were validated with measurements of tidal currents and water levels. This assessment showed that the theoretical reserve of the tidal stream energy resource in 99 channels was approximately 8.33 GW. In addition, many other evaluations of tidal stream energy resources have been undertaken by Chinese researchers in a number of specific offshore regions. Based on the method of evaluation of tidal stream energy proposed by Zheng (1987), Kuang and Zhou (1987) performed a preliminary estimation of the tidal stream energy for the area off Chengshantou in Shandong Province using short-term measured data. Using numerical models, Wu et al.(2010, 2011) analyzed the resources of tidal stream energy off Chengshantou and in the Laotieshan straits. He (1982), Wang et al. (2010), and Hou et al. (2014) all estimated the tidal stream energy resources in channels among the Zhoushan Islands in Zhejiang Province. Lü et al. (2010) analyzed the distribution of tidal stream energy resources in the mouth of Jiaozhou Bay, Shandong Province. Wu et al. (2013b) and Chen (2013) reconstructed the tidal system of the Bohai Strait using FVCOM and performed estimations of the tidal stream energy resource. However, most previous works have only analyzed tidal stream energy resources in an undisturbed state, i.e., without operating turbines; thus, the dynamic effects of tidal turbine operation have been neglected. The objective of the current study was to analyze tidal stream energy resources both with and without the deployment of a turbine in a region near Pingtan Island, Fujian Province.
The remainder of the paper is presented as follows. The approach adopted for the assessment of the dynamic impacts due to the introduction of tidal turbines is explained in Section 2, which includes the modifications made to the momentum equation for the incorporation of the turbines. The study domain is also described in Section 2, together with details on the set up and construction of the model. This model was run initially to simulate the hydrodynamics and physical characteristics of the tidal wave near Pingtan Island without the inclusion of the tidal turbines, after validation of the tidal current and water level. The results of the model simulations are presented in Section 3. The conclusions of this research are presented in the final section.
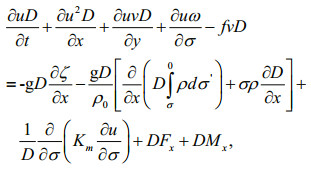
2 MATERIAL AND METHOD 2.1 Numerical modelThe FVCOM (An Unstructured Grid, FiniteVolume Coastal Ocean Model) ocean model used in this study adopts an unstructured triangular gridding in the horizontal direction. This can better fit coastline borders and it is convenient for developing a partial encryption of the region of concern in which tidal stream energy is concentrated. The following equations represent the momentum equation in the xand y-directions:
 (1)
(1)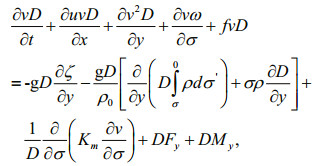 (2)
(2)where u, v, and w represent the velocity components in the x, y, and z directions, respectively; ω is the vertical velocity component for the σ coordinate; D is water depth; ρ is the density of seawater; f is the Coriolis parameter; g is gravitational acceleration; Km is the vertical eddy viscosity diffusion coefficient, which can be calculated using the Mellor Yamada-2.5 turbulent closure model; Fx and Fy represent the horizontal momentum diffusion in the east and north components, respectively; and Mx and My represent the energy dissipation in the east and north components, respectively, due to the introduction of tidal stream energy turbines.
The model region covers the area adjacent to Pingtan Island and part of the Taiwan Strait (Fig. 1) with a minimum grid spacing of 200 m. The depth near Pingtan Island is generally < 30 m. The deepest part of the computational domain (about 80 m) is located in the middle area of the Taiwan Strait. The model has six Sigma layers in the vertical. The open boundary water level conditions are derived from the nine tidal constituents (M2, S2, N2, K2, K1, O1, P1, Q1, and M4) provided by the global tidal model TPXO7.2. The temperature and salinity of the water are set as constants: 20℃ and 32, respectively. The model runs from a cold status in which the current and water level at the initial time are set to zero, and the influences of the wind field, evaporation, atmospheric precipitation, river runoff, and bottom freshwater are ignored.

|
| Figure 1 (a) Model grid and bathymetric chart, (b) zoomed-in representation of section shown by black rectangle in (a) |
There are three principal methods for describing the hydrodynamic impact of a turbine (Chen et al., 2014). The first is the bottom friction approach, in which the tidal energy dissipation associated with the presence of the tidal turbine is approximated by adding a bottom friction coefficient. This method is used commonly in depth-averaged and twodimensional models. For example, Neill et al. (2012) applied this method to evaluate the tidal stream energy resource of the waterway between the island of Alderney and the Cap de la Hague (France). Sutherland et al. (2007) performed similar work using this method in the Johnstone Strait. Furthermore, Wu et al. (2013a) estimated the exploitable energy resource of the tidal stream off Chengshantou and they evaluated its hydrodynamic impact using this approach.
The second method is the momentum sink approach, in which the loss of momentum caused by the introduction of tidal turbines is added to the momentum equations. Chen et al. (2014) studied the characteristics of tidal stream energy resources in an idealized estuary using this parameterization scheme. Considering different layouts of turbine arrays, Fallon et al. (2014) discussed the distribution of tidal energy in the Shannon Estuary (Republic of Ireland). The tidal steam energy resources and the hydrodynamic influence of turbines in several channels or estuaries have also been studied using the second method (Neill et al., 2009; Ramos et al., 2013; Nash et al., 2014; Yang et al., 2014). The characteristics of tidal stream energy resources with the implementation of floating and bottom-fixed types of devices have been studied and compared by Sanchez et al. (2014) near the region of Ria de Ortigueira (Spain). Thiébot et al. (2015) analyzed the influence of a tidal stream turbine array on near-field hydrodynamics and sediment transportation in the Alderney Race (France).
The third method is the blade element actuator disc approach, which couples a blade element model with a three-dimensional Navier-Stokes model to analyze the effects on performance of interacting turbines. This method is generally used for modeling turbines deployed within a 10-m2 area. Bai et al. (2013) discussed the relation between the recovery distance of the tidal current downstream and turbine diameter under idealized conditions. Furthermore, the interaction among tidal arrays has been studied in this way (Bahaj et al., 2007; Gant et al., 2008; Harrison et al., 2010).
The advantages and disadvantages of the three aforementioned methods can be summarized as follows. The method of applying a bottom friction coefficient is convenient, but the variation of the tidal current in the vertical cannot be simulated successfully, even when using a three-dimensional model. The detailed hydrodynamics surrounding operational turbines can be depicted accurately using the third method; however, it is suitable only for rather small areas. As a moderate method with clear physical significance, the second approach is adopted widely, and it can be integrated with a definite blade of a horizontal-axis turbine to determine the specific parameterization scheme. In this study, this approach was used in sigma layers 2–4 to depict the reduction in momentum caused by the implementation of turbines.
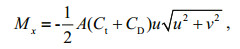
The east and north components of the force of a horizontal-axis turbine can be expressed using the following formulas:
 (3)
(3)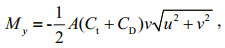 (4)
(4)where Mx and My are the total momentum sink due to turbines in the east and north directions, respectively; A is the area swept by the impeller of the tidal turbine; and Ct and CD are the thrust and drag coefficients of the turbine, respectively. The value of parameter Ct depends mainly on the number of blades of the turbine, its geometric structure, and the velocity of the local flow.
In this study, a small-scale turbine model with two naca63-424 blades was applied (diameter: 4.8 m, tip speed ratio: 6.5). Figure 2 shows the variation of thrust coefficient CT and electric power Pt of the tidal turbine with different current speeds. It can be seen that the cut-in speed is about 0.4 m/s and that the corresponding speed for rated power of 5.27 kW is 1.1 m/s.

|
| Figure 2 Ct and Pt curves of a tidal turbine |
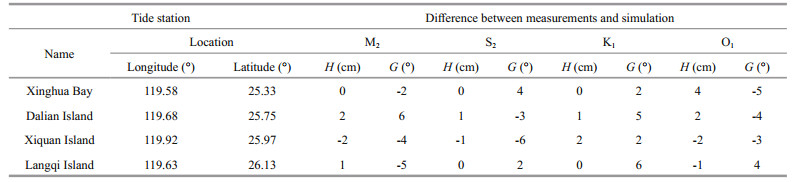
Table 1 shows comparisons of the measured and simulated constituents of tidal level. The tide level data were measured at four gauging stations near Xinghua Bay, Dalian Island, Xiquan Island, and Langqi Island (Fig. 1a). It can be seen that the differences in amplitude of constituents M2, S2, and K1 are very small but the difference of O1 is slightly greater. Furthermore, the phase errors of these constituents are within an acceptable range. Therefore, the reasonable agreement between the predicted and observed tide levels confirms that the model predictions can reproduce the full variation of tide level.
The period for which the model simulation was run for the validation of the tidal currents at two measurement stations was five and three days. The time of measurement of T1 commenced on March 5, 2008 and ended on March 10, 2008, while that of T2 commenced on March 1, 2010 and ended on March 4, 2010. Figure 3a–d illustrates the tidal stream validation results. The hydrodynamic results show that the correlation coefficients between the predicted and measured data are relatively high for tidal phasing for both surveys. They also indicate that the current speed predictions were in reasonable agreement with the measured data, except at station T1, where the model underestimated the magnitude of the current speed slightly on March 7, 2008. It is thought that this discrepancy could be related to the complex bathymetry, which might not be represented accurately in the model.

|
| Figure 3 Comparison of predicted and measured tidal currents for two sites a. tidal stream magnitude of T1; b. tidal current direction of T1; c. tidal current magnitude of T2; d. tidal current direction of T2. |
Figure 4 shows the time series of tidal stream and tidal level over three days near Pingtan Island (D1 in Fig. 1b). It can be seen that the regimes of the tide and tidal steam are both regular semidiurnal and that the tidal wave is dominated mainly by a progressive wave. The phase difference between the tidal level and current is about one hour. The turning of the tidal stream generally occurs at the mid-point between the period of flood and ebb, while the maximum speed during the flood and ebb tides occurs one hour before the slack and still tides. The average durations of the flood and ebb tides are 6 h 47 min and 5 h 13 min, respectively.

|
| Figure 4 Tidal current speed compared with water level near Pingtan Island |
Figure 5 shows the distribution of flow patterns at slack tide and still tide in the region surrounding Haitan Bay. During the flood period, the tidal wave propagates northward, whereas it propagates southward during the ebb period. Tidal asymmetry is apparent, with the flood tide stronger than the ebb. This tidal asymmetry could be caused by the variation of the geometry of the region at different tidal levels. The figure shows several strong streams (largest velocity: > 1.6 m/s) occur in a number of small areas, including the area south of the northern cape, east of the southern cape, and near the bottom of Haitan Bay. During the flood tide, two cyclonic eddies and one anticyclonic eddy are created in the northeast, southwest, and north of Haitan Bay, respectively. During the ebb tide, the northeastern cyclonic eddy disappears, and the eccentricity of the southwestern cyclonic eddy is increased; the size of the northern anticyclonic eddy increases slightly compared with the flood tide.

|
| Figure 5 Velocity distribution: (a) slack tide and (b) still tide |
The regional distributions of average power density for the spring and neap tides are shown in Fig. 6 to be similar, according to methods adopted by the UK Marine Energy Atlas (ABP Marine Environmental Research Ltd., 2008). As in Fig. 5, the areas with the largest power density are found at the south of the northern cape of Haitan Bay, east of the southern cape, and the bottom of the bay, where the annual average power density for the flood tide is 1.1, 0.9, and 1.3 kW/m2, respectively. By contrast, the maximum value of the annual power density for the neap tide is only about 0.3 kW/m2.

|
| Figure 6 Distribution of annual average power density: (a) spring tide and (b) neap tide |
Current velocity is very important when assessing tidal stream energy because the power of a stream varies with the cube of its velocity. However, water depth is also of importance for a number of reasons, one of which is greater water depths allow larger tidal turbines to be installed. The fundamental equation of flux for the assessment of tidal stream energy indicates that the power produced by tidal stream energy is not only proportional to the cube of its velocity but also to the cross-sectional area of the channel in relation to water depth. According to the distribution of power density, the southern end of Haitan Bay should be the ideal location for the deployment of tidal turbines; however, in reality it is unsuitable because the water depth is < 5 m. Therefore, for the selection of appropriate sites for turbine deployment, we introduced a Tidal Stream Exploitability (TSE) index, which was proposed initially by Iglesias (2012). The TSE index can facilitate the selection of tidal power sites in depth-limited zones. It is based on the power available from a tidal stream per unit width, which is determined by incorporating possible tidal asymmetries at the time of maximum speed during both flood and ebb tides.
In this study, the TSE index method was adopted for the selection of a suitable location for testing the tidal stream energy devices. The formula for estimating the TSE index is written as:
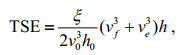 (5)
(5)where ξ is the penalty function of the tidal stream energy; v0 can be considered the reference velocity (corresponding to the rated power); h0 is a reference water depth; vf and ve represent the maximum velocity for the flood and ebb tides, respectively; and h is the water depth. The TSE index reflects tidal stream energy resources, representing a multiple of the average tidal stream energy power at a point based on the reference velocity and water depth. According to the aforementioned diameter of the tidal stream energy turbine and its rated power, the reference velocity taken from the index of tidal stream energy resources in this study was 1.1 m/s and the reference water depth was 8 m. The distribution of the TSE index of the study area (Fig. 7) shows the quality of the tidal stream energy resource within Haitan Bay and most of the surrounding region is lower than the reference value. However, the quality of the tidal stream energy resource on the northern and southern sides of the bay mouth is approximately 1.0–1.5 times the reference value. Therefore, accounting for regional planning and offshore distance, the region near the northern cape of Haitan Bay (point B in Fig. 7) was selected as the best site for the deployment of a tidal turbine in this study.

|
| Figure 7 Distribution of TSE index in the eastern region of Pingtan Island |
The cumulative time in each interval of tidal speed within one month was calculated to illustrate the power output and effective duration of the tidal turbine (Fig. 8). The results show the cumulative time displays a decreasing trend with declining tidal speed, reducing from 76 h at the velocity interval 0.2–0.3 m/s to approximately 20 h at the interval 1.5–1.6 m/s. The cumulative time with velocity > 0.5 m/s is approximately 470 h and it accounts for 65.3% of the total time of operation of the tidal turbine. The cumulative time with velocity > 1.1 m/s is about 150 h and it accounts for 20.9% of the total period. Based on the design of the tidal turbine and on its parameterization scheme adopted by the momentum sink method, the average power at this station is 2.4 kW and the annual electricity generation is about 17.47 MWh.

|
| Figure 8 Statistics for (a) cumulative time of flow velocity at different levels and (b) cumulative time more than the single-stage flow velocity of the testing station |
In order to assess the effects on water level and tidal stream resulting from the operation of the tidal turbine, the differences between the tidal stream with and without the tidal turbine were calculated at the slack and still tides of a spring tide (Fig. 9). It can be observed that the current speed decreased by a certain extent to the south of the northern cape of Haitan Bay where the tidal turbine was deployed. The peak value reduced by 0.036 m/s during the slack tide and by 0.026 m/s during the still tide. The magnitude of the difference in velocity within 2 km of the turbine is approximately 0.01 m/s. The velocity also decreased by about 0.015 m/s near the southwestern part of Haitan Bay, north of the northern cape, and east of the southern cape. Meanwhile, the velocity in some other parts increased slightly because of the resistance effect of the turbine. The velocity was found to increase (by approximately 0.01–0.02 m/s) mainly on the eastern and western sides of the site of the turbine deployment. In addition, the velocity in the region 8-km off the southeast of Haitan Bay also increased by 0.01 m/s. The velocities in other areas of the modeled region remained consistent with those without the operation of the tidal turbine.

|
| Figure 9 Difference of tidal velocity with and without the operation of the turbine at (a) slack tide and (b) still tide |
The installation of a single tidal turbine has weak influence on the water level of the region. It can be observed from Fig. 10 that the tidal level of Haitan Bay and the surrounding area decreased by approximately 0.025 m during the spring tide; water level changes during the middle and neap tides were not significant.

|
| Figure 10 Difference of water level with and without the operation of the turbine during slack tide of the spring tide |
In this study, the spatiotemporal distribution of the tidal energy resource near Pingtan Island in China was analyzed based on simulations of the tidal wave. Appropriate sites for the installation of a tidal turbine were selected, and the potential of the tidal stream energy resources at those sites were estimated by consideration of several factors, e.g., the distribution of tidal power density, bathymetric (or sea floor terrain) conditions, and engineering characteristics of the tidal devices. The influence of the turbine on the hydrodynamics was also studied using the momentum sink approach.
The following principal conclusions were derived. (ⅰ) The greatest power density in Haitan Bay occurs to the south of the northern cape, east of the southern cape, and the southern end of the bay, where the annual average power densities for spring tides are 1.1, 0.9, and 1.3 kW/m2, respectively. (ⅱ) The site near the northern cape of Haitan Bay was considered optimal for the deployment of the tidal turbine. (ⅲ) At the installation site, the cumulative time per month with velocity > 0.5 and > 1.1 m/s is approximately 470 and 150 h, respectively. The average power is 2.4 kW, and the annual electricity output is about 17.47 MWh. (ⅳ) The intervention of the turbine device has little influence on the near-field tidal stream. The tidal stream was reduced slightly in the area south of the northern cape, but the effect weakened further from the turbine. Furthermore, the velocity increased slightly on both sides of the deployment location. (ⅴ) The installation of a single tidal turbine has only slight influence on the water levels of the region.
| ABP Marine Environmental Research Ltd. 2008. Atlas of UK Marine Renewable Energy Resources: Technical Report. http://www.renewables-atlas.info/.Accessed on 2016-06-01. |
| Bahaj A S, Myers L E, Thomson M D, Jorge N. 2007. Characterising the wake of horizontal axis marine current turbines. In: Proceedings of the 7th European Wave and Tidal Energy Conference. EWTEC, Porto, Portugal. |
| Bai G H, Li J, Fan P F, Li G J, 2013. Numerical investigations of the effects of different arrays on power extractions of horizontal axis tidal current turbines. Renewable Energy, 53: 180–186. Doi: 10.1016/j.renene.2012.10.048 |
| Chen J R, 2013. Characteristic analysis of tidal current energy in the Xiamen Bay and Jinmen channel. Marine Science Bulletin, 32(6): 641–647. |
| Chen Y L, Lin B L, Lin J, 2014. Modelling tidal current energy extraction in large area using a three-dimensional estuary model. Computers & Geosciences, 72: 76–83. |
| Fallon D, Hartnett M, Olbert A, Nash S, 2014. The effects of array configuration on the hydro-environmental impacts of tidal turbines. Renewable Energy, 64: 10–25. Doi: 10.1016/j.renene.2013.10.035 |
| Gant S, Stallard T. 2008. Modelling a tidal turbine in unsteady flow. In: Proceedings of the Eighteenth (2008)International Offshore and Polar Engineering Conference. The International Society of Offshore and Polar Engineers, Vancouver, BC, Canada. p. 473-479. |
| Han J X. 2015. China Offshore Ocean: Ocean Renewable Energy. Ocean Press, Beijing, China. (in Chinese) |
| Harrison M E, Batten W M J, Myers L E, Bahaj A S, 2010. Comparison between CFD simulations and experiments for predicting the far wake of horizontal axis tidal turbines. IET Renewable Power Generation, 6(4): 613–627. |
| He S J, 1982. Tidal stream characteristic and tidal energy in Zhoushan region. Energy Engineering(4): 1–5. |
| Hou F, Yu H M, Bao X W, Wu H, 2014. Analysis of tidal current energy in Zhoushan sea area based on high resolution numerical modeling. Acta Energiae Solaris Sinica, 35(1): 125–133. |
| Iglesias G, Sánchez M, Carballo R, Fernández H, 2012. The TSE index-a new tool for selecting tidal stream sites in depth-limited regions. Renewable Energy, 48: 350–357. Doi: 10.1016/j.renene.2012.05.012 |
| Kuang G R, Zhou D J, 1987. Preliminary assessment of tidal stream energy on Chengshanjiao area. Ocean Technology, 6(2): 44–48. |
| Lü X G, Qiao F L, Zhao C, Xia C S, 2010. Numerical evaluation of tidal stream energy resources in the ocean:a case study in Jiaozhou Bay mouth. Acta Energiae Solaris Sinica, 31(2): 137–143. |
| Nash S, O'Brien N, Olbert A, Hartnett M, 2014. Modelling the far field hydro-environmental impacts of tidal farms-a focus on tidal regime, inter-tidal zones and flushing. Computers & Geosciences, 71: 20–27. |
| Neill S P, Jordan J R, Couch S J, 2012. Impact of tidal energy converter (TEC) arrays on the dynamics of headland sand banks. Renewable Energy, 73(1): 387–397. |
| Neill S P, Litt E J, Couch S J, Davies A G, 2009. The impact of tidal stream turbines on large-scale sediment dynamics. Renewable Energy, 34(12): 2803–2812. Doi: 10.1016/j.renene.2009.06.015 |
| Ramos V, Carballo R, Álvarez M, Sánchez M, Iglesias G, 2013. Assessment of the impacts of tidal stream energy through high-resolution numerical modeling. Energy, 61: 541–554. Doi: 10.1016/j.energy.2013.08.051 |
| Sanchez M, Carballo R, Ramos V, Iglesias G, 2014. Floating vs. bottom-fixed turbines for tidal stream energy:a comparative impact assessment. Energy, 72: 691–701. Doi: 10.1016/j.energy.2014.05.096 |
| Sutherland G, Foreman M, Garrett C, 2007. Tidal current energy assessment for Johnstone Strait, Vancouver Island. Proceedings of the Institution of Mechanical Engineers, Part A:Journal of Power and Energy, 221(2): 147–157. Doi: 10.1243/09576509JPE338 |
| The Executive Committee of Ocean Energy Systems (ECOES). 2012. Annual Report: Implementing Agreement on Ocean Energy Systems. The Executive Committee of Ocean Energy Systems. Lisboa, Portugal. |
| Thiébot J, du Bois P B, Guillou S, 2015. Numerical modeling of the effect of tidal stream turbines on the hydrodynamics and the sediment transport-application to the Alderney Race (Raz Blanchard), France. Renewable Energy, 75: 356–365. Doi: 10.1016/j.renene.2014.10.021 |
| Wang C K, Lu W. 2009. Ocean Energy Resources Analysis Method and the Evaluation of the Reserves. Ocean Press, Beijing, China. (in Chinese) |
| Wang Z F, Zhou L M, Zhang G B, Wang A F, 2010. Tidal stream energy assessment in specific channels of Zhoushan sea area. Periodical of Ocean University of China, 40(8): 27–33. |
| Wu H, Wang X, Han L S, 2013a. Assessment of extractable energy of tidal current at Chengshantou Cape. Oceanologia et Limnologia Sinica, 44(3): 570–576. |
| Wu H, Zhao S M, Xu H F, Zhang Z H, 2010. Preliminary assessment of tidal current energy on Chengshantou area. Ocean Technology, 29(3): 98–100. |
| Wu H, Zhao S M, Zhang S, Wang X, Ma Z Z, 2011. Preliminary assessment of tidal energy in Lao Tieshan channel. Marine Science Bulletin, 30(3): 310–314. |
| Wu L Y, Wang X, Xiong X J, 2013b. Assessment of tidal stream energy in the Bohai Strait using a high resolution model. Advances in Marine Science, 31(1): 12–21. |
| Yang Z Q, Wang T P, Copping A, Geerlofs S, 2014. Modeling of in-stream tidal energy development and its potential effects in Tacoma Narrows, Washington, USA. Ocean & Coastal Management, 99: 52–62. |
| Zheng Z N, 1987. Estimating formulae of ocean tidal current energy. Journal of Harbin Shipbuilding Engineering Institute, 8(2): 37–44. |