 2018, Vol. 36
Institute of Oceanology, Chinese Academy of Sciences
Article Information
- QI Jifeng(齐继峰), YIN Baoshu(尹宝树), XU Zhenhua(徐振华), LI Delei(李德磊)
- Spatiotemporal variations of the surface Kuroshio east of Taiwan Island derived from satellite altimetry data
- Chinese Journal of Oceanology and Limnology, 36(1): 77-91
- http://dx.doi.org/10.1007/s00343-018-6314-7
Article History
- Received Dec. 1, 2016
- accepted in principle Jan. 17, 2017
- accepted for publication Feb. 22, 2017


2 University of Chinese Academy of Sciences, Beijing 100049, China
The Kuroshio is the primary poleward western boundary current in the western Pacific, with a mean speed of 1-1.5 m/s. It begins off the coast of Philippines near 12°-13°N, where the North Equatorial Current (NEC) bifurcates (Nitani, 1972). After bifurcating from the NEC off the Philippines, it passes by the Luzon Strait and continues flowing northward along the eastern coast of Taiwan Island. It enters the East China Sea (ECS) through the East Taiwan Channel (ETC). As the western boundary current in the North Pacific subtropical gyre, because of its strong poleward transport of mass and heat, the Kuroshio is important in air-sea interaction and the global heat balance (Qu and Lukas, 2003; Kwon et al., 2010). To the east of Taiwan Island, the Kuroshio greatly impacts flows downstream of the ECS and south of Japan, as well as water exchange and biogeochemical processes in the ECS (Chen, 1996; Guo et al., 2006). Thus, as one component of the Kuroshio, the dynamic aspects of this current east of Taiwan Island, especially variability in its intensity and structure on timescales from days to years, have been extensively studied (Johns et al., 2001; Liang et al., 2003; Hsin et al., 2008, 2013; Chang and Oey, 2011; Jan et al., 2015; Zhu et al., 2015; Yan et al., 2016). By contrast, studies of spatiotemporal variability, which is the main subject of this paper, have been hampered by a lack of long-term observations. With global warming and sea level rise in a changing climate, there is a need to better understand spatiotemporal variation of the Kuroshio east of Taiwan Island and its possible causes. These processes modulate cross-slope exchanges of heat, salt, and nutrients, with potentially important consequences in the regional ecosystems and climate (Oey et al., 2013, 2014).
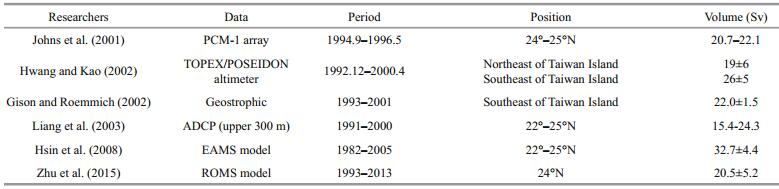
Chu (1974) was one of the first to study spatiotemporal variations of the Kuroshio east of Taiwan Island, using in-situ hydrographic surveys. He reported that the current had strong variability from southeast to northeast of Taiwan Island. Based on a dense array of current moorings, Johns et al. (2001) reported that northward Kuroshio transport northeast of Taiwan Island was ~21.5 Sv (1 Sv= 106 m3/s) and that there were substantial significant 100-day timescale fluctuations with amplitudes as large as 10 Sv. However, recently, Hsin et al. (2008) estimated that the Kuroshio volume transport east of Taiwan Island was ~30 Sv. Northeast of Taiwan Island, Hwang and Kao (2002) found that the Kuroshio transport is ~26 Sv. However, Gilson and Roemmich (2002) estimated this transport at ~21 Sv in that area. Using ROMS model, Zhu et al. (2015) estimated that the transport is 20±5.2 Sv. Table 1 summarizes some studies on the Kuroshio volume east of Taiwan Island. It is evident that this volume varied in a range of 15-26 Sv from studies after 1990. Possible causes for these discrepancies may be attributed to different research methods and data used in computation (Hsin et al., 2008). On seasonal time scales, there is still controversy concerning seasonal variation of the Kuroshio east of Taiwan Island. That is, most studies reported that the Kuroshio northeast of Taiwan Island is stronger in summer and weaker in winter, which may be mainly caused by monsoon winds and heat flux over the shelf region (Tang and Yang, 1993; Oey et al., 2010; Hsin et al., 2008, 2013). However, Chang and Oey (2011) concluded that the Kuroshio northeast of Taiwan Island is stronger in fall and weaker in spring, which may be induced by seasonal eddy activity in the Subtropical Counter Current (STCC). Furthermore, Gilson and Roemmich (2012) reported that the Kuroshio geostrophic transport southeast of Taiwan Island is stronger in summer and weaker in winter, based on nine-year observation.
Previous studies have also suggested that the Kuroshio varies interannually and is important in mass, heat, salinity and nutrient balances in the western Pacific marginal seas. Recent investigations demonstrated that interannual variations of the Kuroshio are essential to climate variability of the northwestern Pacific (Shen et al., 2014). As to lowfrequency variation of the Kuroshio east of Taiwan Island, studies have suggested that it is related to the El Niño-Southern Oscillation (ENSO), Pacific Decadal Oscillation (PDO) index, Philippines Taiwan Oscillation (PTO), and mesoscale eddies coming from the interior Pacific Ocean. However, a consensus has not been reached. Hwang and Kao (2002) found that Kuroshio volume transport east of Taiwan Island has strong correlation with the ENSO index, and this correlation has varying spatial distributions. Southeast of Taiwan Island, the Kuroshio transport variation leads the ENSO index by 9-10 months, with a coefficient of -0.6. However, northeast of Taiwan Island, the transport lags the index by a month, with a maximum correlation coefficient of 0.6. Compared with the ENSO index, investigations have shown that the PDO index has a much closer connection with low-frequency variation of the Kuroshio east of Taiwan Island (Tsui and Wu, 2012). Furthermore, Wu (2013) found that the Kuroshio in the low-latitude western North Pacific is strongly correlated with the PDO index, but not with the ENSO index. The influence of ENSO on the Kuroshio depends on the PDO impact. Andres et al. (2009) discovered that Kuroshio transport variations in the PN section also have a stronger connection with the PDO index. Nevertheless, a trend of decreasing correlation between the two in recent years has been found with use of 20-year model data. This trend was induced by the westward propagation of mesoscale eddies from the STCC (Soeyanto et al., 2014). Based on 18 tide gauge data, Jia et al. (2004) concluded that interannual variations of the Kuroshio east of Taiwan Island are related to those in the wind stress curl above the interior gyre, indicating that the primary periods of the Kuroshio northeast of Taiwan Island are 2-5 years. The STCC region in the northwestern Pacific is one of the most active regions of mesoscale eddies. Therefore, the variability of such eddies may play a key role in determining Kuroshio interannual variability east of Taiwan Island (Zhu et al., 2015). However, there has been controversy about the impact of those eddies on the Kuroshio east of Taiwan Island. For example, Hsin et al. (2013) stated that interannual variation of the Kuroshio is mainly caused by the relative intensity of cyclonic to anticyclonic eddies off eastern Taiwan Island. However, a recent study by Yan et al. (2016) reported that interannual variation of the Kuroshio is closely related to the relative number of anticyclonic to cyclonic eddies west of 125°E, with a correlation of 0.5. Hence, the contrasting assertions of these studies need to be further addressed.
As discussed above, the Kuroshio shows strong spatiotemporal variability along its path, especially east of Taiwan Island, on timescales from seasons to years. Although studies for the east of Taiwan Island based on hydrographic, sea level data, and numerical models have provided a general description of the Kuroshio, understanding of its variability remains limited. The spatiotemporal variability of the Kuroshio east of Taiwan Island has not been precisely quantified and there are substantial errors and large values because of direct observations limited in both spatial and temporal coverage. Recently, satellite altimetry data has been widely used to compensate for the lack of observational data, toward understanding aspects of the entire ocean.
In the present study, we address all the aforementioned problems using 23-year (1993-2015) AVISO Absolute Dynamic Topography (ADT) data. In combination with European Centre for MediumRange Weather Forecasts (ECMWF) reanalysis (ERA-Interim) wind data, these enable further investigation of spatiotemporal variations of the surface Kuroshio east of Taiwan Island and explanations of possible driving mechanisms. This paper is organized as follows. Data and methods are described in Section 2, and results and discussion are presented in Sections 3 and 4, respectively. Section 5 summarizes the work.
2 DATA AND METHODGridded multi-satellite altimeter-based ADT and sea level anomaly (SLA) data from January 1993 to December 2015 were obtained from AVISO (http://www.aviso.oceanobs.com), which merge several altimeter datasets of ERS1 and ERS2, EVVISAT, Jason-1and 2, GFO, and TOPEX/Poseidon. Spatial resolution of the gridded data is 1/4°. The wind data used are reanalysis data from ECMWF ERA-Interim (http://www.ecmwf.int/en/research/climate-reanalysis/era-interim), which are from 1979 to the present. Spatial resolution of the dataset is ~80 km. Other data used include the PDO index (http://jisao.washington.edu/pdo/), ENSO EMI index (http://www.jamstec.go.jp/frsgc/research/d1/iod/DATA/), and Niño 3.4 index (http://www.esrl.noaa.gov/psd/gcos_wgsp/Timeseries/Nino34/).
2.1 Surface velocityAccording to the theory of geostrophic balance, surface geostrophic velocities can be calculated based on the ADT data as follows.
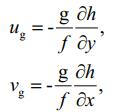
where x and y are the longitude and latitude, respectively, h represents the ADT data, and ug and vg are zonal and meridional components of the geostrophic velocity, respectively, g is gravitational acceleration, f is the Coriolis parameter, which can be calculated by f=2Ωsin(φ), and Ω is angular velocity of the earth's rotation (=7.29×10⁻⁵ s), and φ is latitude on the grid.
2.2 MethodEarlier studies indicate that the axis of the Kuroshio is located between 200 m and 2 000 m, with a maximum velocity of 1-1.5 m/s (Liu and Gan, 2012; Hsin et al., 2013). Accordingly, in the present research, the center of the Kuroshio is defined as the point where the surface velocity is maximum along a section. Thus, the axis of the current can be obtained by connecting these centers one by one. According to the definition of Liu and Gan (2012), the Kuroshio boundaries are defined using the 0.1 m/s isotach of velocity V on various sections. Then, the Kuroshio width can be defined as the diflerence between left and right boundary points. In addition, based on the surface geostrophic velocity, surface transport can be obtained by
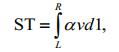
where L and R are the left and right boundary points, respectively. The term α×V represents the velocity normal to the section of the Kuroshio. Between 22°N and 25°N, the value of α is set to 20 degrees north by east, following the direction of the eastern coastline of Taiwan Island. The ADT used was a monthly average, and a seasonal climatology was obtained by averaging 23-year data for each season. The interannual component was extracted from time series as follows: a) subtract the annual cycle from the original series. That cycle is obtained by averaging 23-year data for each month; b) smooth the series by a 13-month, low-passed filter to eliminate intraseasonal and seasonal signals after the first step. After the foregoing two steps, we obtained the seasonal and interannual components. We applied this method of time series to variables such as surface transport and surface velocity.
3 RESULTBased on the data and method described above, the basic characteristics and seasonal and interannual variations of the Kuroshio east of Taiwan Island are presented and discussed in this section.
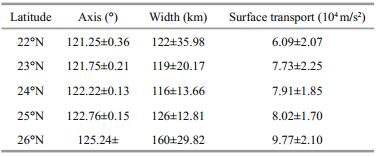
3.1 Basic characteristics of the KuroshioFigures 1 and 2 show that the 23-year (1993-2015) mean state of the Kuroshio, including its axis location, boundary, and surface transport east of Taiwan Island. The Kuroshio flowing in that area and in the ECS can be clearly identified. The annual mean surface velocity field shows that the Kuroshio flows northeastward along the eastern coast of Taiwan Island and enters the ECS via the ETC northeast of that island, and then flows northeastward along the 200-m isobath in the ECS. Figure 2 shows the basic characteristic of strong spatial variability of the Kuroshio. Also shown is that standard deviations (STD) of the axis location indicate that the axis does not exceed 25 km in width east of Taiwan Island (Table 2). In addition, the axis has relatively large variation south of 23°N, with the greatest variability around 22°N. There is relatively little variability north of 24°N. The axis has greater variation in the southeast of Taiwan Island than in the northeast (Table 2). Causes of the relatively large variation of the Kuroshio axis southeast of Taiwan Island may be two Kuroshio branches on both sides of Lan-Yu Island and the influence of mesoscale eddies originating in the STCC (Hsin et al., 2008).

|
| Figure 1 Annual mean surface geostrophic velocity Color shading indicates absolute dynamic topography east of Taiwan Island, black solid curve represents mean Kuroshio axis position and dashed curve the eastern boundary of the Kuroshio. |

|
| Figure 2 Annual mean axis, width, and surface transport of Kuroshio and their standard deviations between 21.5°N and 25.5°N east of Taiwan Island Means and standard deviations are from data of the period January 1993 through December 2015. |
|
As revealed in Fig. 2b, the annual mean width of the Kuroshio east of Taiwan Island is ~140 km, with a STD of about 30 km along the current's path. To the southeast (~22°N) and northeast (~24.5°N) of Taiwan Island, the width of the Kuroshio is 122 and 138 km, respectively, somewhat larger than the results of Hwang and Kao (2002). Their results suggest that the Kuroshio width southeast (~22°N) and northeast (~24.5°N) of Taiwan Island are 96 and 112 km, respectively. This discrepancy may be attributed to diflerent altimeter data products and identification methods for the Kuroshio boundary. Furthermore, the Kuroshio width showed pronounced spatial variation from southeast to northeast, and increased northward from 22° to 25°N. By comparison, the width had relatively large variation around 22°N (Fig. 2d). However, it had relatively little variability northeast of Taiwan Island, around 25°N. Annual mean surface transport of the Kuroshio east of Taiwan Island is estimated at 7.75×10⁴ m2/s along the current path, with a STD of 2.14×10⁴ m2/s. Surface transport of the Kuroshio was stronger to the northeast (25°-26°N) of Taiwan Island and weaker to the southeast (21.5°-22°N), with smaller and larger variability, respectively. Similar to variation of the width, surface transport of the Kuroshio had an increasing tendency toward the north from 22° to 25°N. The STD result indicates that the surface transport has greater variation southeast of Taiwan Island (22°N) than that to its northeast (25°N). Moreover, the Kuroshio southeast of Taiwan Island is much more active than that to its northeast.
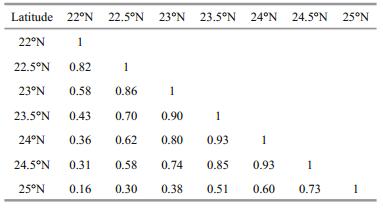
To further examine spatial variability of the surface Kuroshio east of Taiwan Island, we calculated the correlation coefficient between a pair of transects between 22° and 25°N (Table 3). Although there was good correlation between adjacent transects, the correlation coefficient between the southeast (22°N) and northeast (25°N) of Taiwan Island is only 0.16 (significance level=95%). It should be noted that all quoted correlations are above 95% significance level. The above results indicate that the Kuroshio in the upstream region does not directly influence the current in the downstream region. However, on the interannual time scale, the correlation coefficient between the southeast (22°N) and northeast (25°N) of Taiwan Island increased to 0.46 (figure not shown).
|
To further investigate variability of the Kuroshio, spectral analysis and explained variance were applied to the variation of Kuroshio surface transport during the period 1993-2015 (Fig. 3). The results indicate that the primary periods of this transport east of Taiwan Island are 1 and 2.8 yr. Figure 3b shows the contribution of fluctuations in diflerent periods, and explained variances of 1 year high-passed filtered (seasonal), 1-10 year bandpassed filtered (interannual), and 10 year low-passed filtered Kuroshio surface transport as a function of latitude. Obviously, the seasonal signal dominates the variation of Kuroshio surface transport (>70%), and explained variance of the interannual signal (>28%) is secondary along the Kuroshio path east of Taiwan Island. Spatial distributions of the explained variances of the Kuroshio width are similar to those of surface transport (figure not shown). Thus, in the next section, we mainly examine seasonal and interannual variation and the long-term tendency of the surface Kuroshio and their possible causes.

|
| Figure 3 Frequency spectrum of Kuroshio surface transport east of Taiwan Island (a) and latitude-dependent explained variances of a 1-yr high-passed (red), 1–10-yr bandpassed (blue), and 10-yr low-passed (black) filter (b) |
We defined January, February and March as winter months, April, May and June as spring months, July, August and September as summer months, and October, November and December as autumn months. The results indicate that the location of the Kuroshio axis east of Taiwan Island is steady, with relatively little seasonal change (figure not shown). Therefore, we mainly investigated seasonal variations of Kuroshio section width and surface transport. Figure 4 shows these variations.

|
| Figure 4 Seasonal variation of Kuroshio width and surface transport east of Taiwan Island |
For Kuroshio width, most sections had similar seasonal patterns, with a maximum in summer and minimum in winter. The greatest width variability was in the area south of 22°N. Southeast of Taiwan Island, around 22°N, the width was a maximum 147 km in summer, followed by 132 and 119 km in spring and autumn, respectively, and minimum 108 km in winter. The magnitude of seasonal change of Kuroshio width was ~38 km throughout the year. However, northeast of Taiwan Island, around 25°N, the width was a maximum 153 km in summer and minimum 110 km in winter. Latitude dependence of the Kuroshio width had a similar variation except in autumn.
As shown in Fig. 4, the Kuroshio surface transport has an increasing northward tendency north of 22°N, which has strong seasonality throughout the year. The greatest variability of surface transport is in the area south of 22°N. The transport maximizes in summer and minimizes in winter. It is interesting that this seasonality correlates well with seasonal variation of Kuroshio volume transport found in previous studies (Chuang and Liang, 1994; Oey et al., 2010). Southeast of Taiwan Island, around 22°N, the Kuroshio surface transport has a maximum 7.5×10⁴ m2/s in summer, followed by 6×10⁴ and 5×10⁴ m2/s in spring and autumn, and minimum 4.5×10⁴ m2/s in winter. Seasonal fluctuation of this transport is ~3.0×10⁴ m2/s throughout the year. Northeast of Taiwan Island, around 25°N, the Kuroshio surface transport has relatively little variation, with magnitude < 2.4× 10⁴ m2/s. There is a maximum of 9.6×10⁴ m2/s in summer and minimum 7.2×10⁴ m2/s in winter.
3.3 Interannual variability of the KuroshioIn previous studies, both observation and model results indicate that the Kuroshio Current also varies interannually, and is important in regional climate change (Liu and Gan, 2012; Qi et al., 2014; Soeyanto et al., 2014). The present spectral analysis indicated that the primary period of Kuroshio interannual variation is 2.8 yr. A similar result was reported by Jia et al. (2004), who found that the primary period of the Kuroshio east of Taiwan Island was 2-5 years. Our results indicate that the surface transport and Kuroshio width east of Taiwan Island have nearly simultaneous interannual variation, with their positive correlation coefficient reaching 0.81 (significance level=95%). This indicates that Kuroshio surface transport depends mainly on the section width east of Taiwan Island (figure not shown). To further investigate spatiotemporal variability of the Kuroshio east of Taiwan Island, we divided the interannual variation of surface transport into three parts, i.e., the spatial mean (22°-25°N), southeast (22°-23°N) and northeast (24°-25°N). The surface Kuroshio east of Taiwan Island had strong interannual characteristics in the diflerent areas.
Performing discriminative analysis based on the Kuroshio surface transport anomaly and its multiyear average standard deviation (σ=0.89×10⁴ m2/s) allowed the classification of the Kuroshio into two categories, namely, strong (anomaly≥σ) and weak (anomaly≤-σ) Kuroshio years. Strong years were 1995, 2004, 2006, 2008-2009 and 2014-2015; weak years were 1993, 2000-2001, 2005, 2008, 2010 and 2013 (Fig. 5). According to the results of Yu and Kim (2013), 1994-1995, 2004-2005, 2006-2007 and 2009 were the major ENSO events during 1993-2010. The Kuroshio was much stronger during these periods. A question then emerges as to whether the interannual variation of the Kuroshio east of Taiwan Island is related to the ENSO index. This question is discussed in detail later.

|
| Figure 5 Time series anomaly of Kuroshio surface transport east of Taiwan Island Red lines represent standard deviations. The three series are smoothed by a 13-month, low-passed filter. |
Upon comparing variation of the Kuroshio southeast of Taiwan Island (22°-23°N) with that northeast of Taiwan Island (24°-25°N), we found no strong correlation between the northeastern surface Kuroshio and southeastern surface Kuroshio. This result indicates that the Kuroshio in the upstream region east of Taiwan Island cannot directly influence the Kuroshio in the downstream region. This spatial discrepancy is mainly induced by mesoscale eddies originating in the STCC region. These results contrast with those of Hsin et al. (2013), who reported that the correlation coefficient between the Kuroshio to the southeast and northeast of Taiwan Island reached 0.76. This diflerence may be caused by the diflerent boundary definition used in computation. Hisn et al. used a fixed longitude as the Kuroshio eastern boundary east of Taiwan Island. In fact, that eastern boundary is strongly influenced by the mesoscale eddies from the STCC region, and varies with latitude. For the Kuroshio southeast of Taiwan Island, strong years were 1995, 2004, 2008-2009 and 2014; weak years were 1993, 2001, 2005, 2008, 2010, 2013 and 2015. The maximum anomaly (2.52×10⁴ m2/s) was in 2014. The minimum anomaly was observed in 1993 (-2.41×10⁴ m2/s), giving a diflerence with the former figure of 4.93×10⁴ m2/s. In the northeast of Taiwan Island, the strong Kuroshio years were 1995, 1997, 2004, 2006, 2009 and 2014; weak years were 1993, 2000-2001, 2002, 2005, 2008, 2010 and 2013. The maximum anomaly (1.75×10⁴ m2/s) was in 1997 and the minimum anomaly (-1.94×10⁴ m2/s) in 1993, a diflerence of 3.69×10⁴ m2/s. Our results also indicate that the interannual fluctuation of Kuroshio surface transport east of Taiwan Island is large in amplitude than fluctuation on seasonal time scales (by about a factor of 4). This is consistent with the results of Chang and Oey (2011), who indicated that seasonal fluctuation of the Kuroshio northeast of Taiwan Island was weaker (by a factor of 5-10) than that on interannual time scales.
3.4 Long-term variability of the KuroshioAs discussed above, the Kuroshio shows pronounced spatiotemporal variability in its surface transport. Thus, a question emerges as to whether there was a long-term trend of the Kuroshio during 1993-2015. Thus, stepwise regression was used to further examine long-term variability of Kuroshio surface transport. The monthly average surface transport was considered as a linear combination of polynomial functions of time t (Qi et al., 2014):
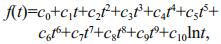 (1)
(1)where t is the month, the first being January 1993, and c0 through c10 are regression coefficients. Coefficients in Eq.1 were obtained from regression analysis. This analysis was applied to the spatial mean, and southeastern and northeastern of the Kuroshio surface transport. The optimum regression equation of this transport was as follows (units 104 m2/s).
 (2)
(2) (3)
(3) (4)
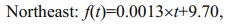
(4)As shown in Fig. 6 (dashed line), linear trends of surface transport are clear and statistically significant. Both showed a linear upward trend during 1993-2015. The calculation indicated that the spatial mean, northeastern and southeastern Kuroshio surface transport east of Taiwan Island increased by 0.30×10⁴, 0.36×10⁴, and 0.22×10⁴ m2/s. Wu et al. (2012) stated that long-term Kuroshio variability during their study period may be associated with global warming, and that it is important to air-sea interaction in the northwestern Pacific.

|
| Figure 6 Interannual variation of Kuroshio surface transport (solid line) and long-term trends (dashed line) of Kuroshio surface transport a. spatial mean (22°–25°N); b. southeast (22-23°N); c. northeast (24°–25°N). |
As mentioned above, the surface Kuroshio east of Taiwan Island has a strong seasonal cycle in its surface transport, which is strongest in summer and weakest in winter. Possible causes for this strong variation have been examined in some studies, concluding that it is attributable to the unique geographic location, where dynamic processes are dominated by heat flux, monsoons, and bottom topography (Chuang and Liang, 1994; Oey et al., 2010; Hsin et al., 2013). In the typical early understanding of the Kuroshio east of Taiwan Island, the monsoon system can influence flow variations in that region (Chuang and Liang, 1994). To further clarify the correlations between the surface Kuroshio and local winds, based on our results, we calculated the monthly anomalies of Kuroshio surface transport and of wind stress along the Kuroshio path east of Taiwan Island. The results are shown in Fig. 7.

|
| Figure 7 Monthly climatology anomaly of (a) surface transport east of Taiwan Island and (b) along-Kuroshio wind stress The wind stress component rotated at an angle of 70° parallel to the Kuroshio east of Taiwan Island. Wind stress was averaged over 121°–122.5°E and 21.5°–26°N. Monthly climatological wind stress is derived from ECMWF ERA-Interim during 1993-2015. |
Figure 7 reveals that the seasonal variation of Kuroshio surface transport east of Taiwan Island is generally consistent with that of local monsoon winds. Both are virtually in phase and display similar trends. From January through July, both the monthly anomaly of surface transport and wind stress along the Kuroshio path increase gradually and maximize in July. Then, both begin a gradual decrease until reaching their minima from November through December. Obviously, the Kuroshio surface transport varies substantially with local monsoon winds. This strong correlation between local monsoon winds and surface transport suggests that the local monsoon winds are the major factor influencing the Kuroshio surface transport east of Taiwan Island, which controls the seasonal variation of the surface Kuroshio east of Taiwan Island.
4.2 Possible causes of interannual variation of the KuroshioWe now focus on possible factors controlling the Kuroshio interannual variation. Studies have reported that this variation east of Taiwan Island has a strong correlation with the meridional wind anomaly, ENSO, PDO, and PTO indexes, and mesoscale eddies originating in the STCC region (Hwang and Kao, 2002; Jia et al., 2004; Andres et al., 2009; Tsui and Wu, 2012; Hsin et al., 2013; Wu, 2013; Soeyanto et al., 2014; Yan et al., 2016). We mainly investigated the relationship between interannual variations of the Kuroshio east of Taiwan Island and the above factors. Given the dominance of the major tropical climate mode, i.e., the ENSO in the western North Pacific (Tozuka and Yamagata, 2003), one might presume that the Kuroshio east of Taiwan Island is closely related to ENSO (Kashino et al., 2009). Cross correlation analysis was used to contrast the relationships with ENSO. Recently, a new type of El Niño Modoki (Ashok et al., 2007) has been emphasized, with its maximum SST anomalies in the tropical central Pacific. As shown in Fig. 8a, interannual variation of the Kuroshio southeast and northeast of Taiwan Island had weak correlation with the ENSO EMI index (correlation coefficient < 0.3). Regarding the Niño 3.4 index southeast and northeast of Taiwan Island, the Kuroshio transport variation led the ENSO index by 9-10 months, with maximum correlation coefficients of 0.18 and 0.28, respectively. Clearly, the ENSO index is ineflective in explaining interannual variation of the Kuroshio east of Taiwan Island.

|
| Figure 8 Cross correlation of Kuroshio surface transport (northeast and southeast of Taiwan Island) with ENSO EMI index (a), Niño 3.4 index (b), PDO index (c), and PTO index (d) |

|
| Figure 9 Surface geostrophic velocity and absolute dynamic topography east of Taiwan Island during PTO strong (a) and weak (b) years |
Aside from the impact of ENSO, the PDO is also considered as one of the factors controlling the interannual variation of Kuroshio east of Taiwan Island (Andres et al., 2009; Wu, 2013; Soeyanto et al., 2014). Compared with the ENSO index, the PDO index has a much stronger connection with that variation. Southeast of Taiwan Island, the Kuroshio transport variation led the PDO index by 9 months, with a maximum correlation coefficient of 0.34. Northeast of Taiwan Island, the Kuroshio transport also led that index by 9 months, with a maximum correlation coefficient of 0.25. Obviously, the PDO index could not have been directly responsible for interannual variation of the Kuroshio east of Taiwan Island. Zhang et al. (2012) stated that this variation of the Kuroshio in the ECS has a strong correlation with the meridional wind anomaly, but our results reveal that this anomaly has a much weaker connection with the Kuroshio east of Taiwan Island (figure not shown).
Based on tide gauge and satellite data, Chang and Oey (2012) found an interannual oscillation of the ocean thermocline east of the Philippines and Taiwan Island, forced by a corresponding oscillation in the wind stress curl. This so-called PTO is believed to control interannual variability of the circulation in the subtropical and tropical western Pacific. As one important component of the western boundary current in the western Pacific, interannual variation of the Kuroshio east of Taiwan Island must be aflected by the PTO.
Monthly-mean ECMWF wind stress data were used to compute corresponding PDO time series for the period 1993-2015. Then, we investigated the PTO impact on interannual variation of the Kuroshio east of Taiwan Island. Correlation analysis indicated that Kuroshio surface transport in that area is strongly correlated with the PTO index. Southeast of Taiwan Island, the Kuroshio transport variation led the PTO index by 6 months, with a maximum correlation coefficient of 0.58. However, northeast of Taiwan Island, that transport lag the PTO index by 4 months, with a maximum correlation coefficient of 0.53. Clearly, the PTO appears to have a significant impact on interannual variation of the Kuroshio east of Taiwan Island.
To further investigate the influence of the PTO on the Kuroshio east of Taiwan Island, a composite analysis was conducted for the current during the strong/weak PTO years. The strong and weak PTO years were determined by combination of the PTO anomaly in individual years and their deviations from multiyear averages. In PTO-strong years, there were two strong anticyclonic eddies east of Taiwan Island, centered at 125°E, 23°N and 123°E, 22.5°N, which induced a stronger surface Kuroshio east of Taiwan Island. However, in PTO-weak years, a similar but cyclonic eddy was found (centered at 125°E, 23°N), which caused a weaker surface Kuroshio east of Taiwan Island. This indicates that the interannual variation of Kuroshio surface transport has a close relationship with the PTO index.
Given the above, we made the reasonable assumption that interannual variation of mesoscale eddies originating in the STCC might be the dominate factor controlling the interannual variation of the Kuroshio east of Taiwan Island. However, whether the interannual variation of mesoscale eddies is caused by the fluctuation the of PTO index? Chang and Oey (2012) found that in years of positive PTO, the thermocline east of the Philippines rises, and deepen east of Taiwan Island. This result in a northward shift of the NEC, increased vertical shear of the STCC/ NEC system, which enhances the baroclinic instability (Wang and Ikeda, 1997), increases eddy activity dominated by warm eddies in the STCC. Therefore, the Kuroshio transport off the northeastern coast of Taiwan Island increases. The reverse applies to the years of negative PTO. Obviously, the PTO-induced mesoscale eddies have a major impact on the surface Kuroshio east of Taiwan Island. Earlier studies have reported that impinging anticyclonic (cyclonic) eddies can increase (decrease) Kuroshio transport east of Taiwan Island (Hsin et al., 2013). However, some controversy has persisted regarding the relative impact of mesoscale eddies on interannual variation of the Kuroshio east of Taiwan Island. For example, Hsin et al. (2013) concluded that the relative intensity of cyclonic to anticyclonic eddies off eastern Taiwan Island is important to the Kuroshio there. However, Yan et al. (2016) asserted that the relative number of anticyclonic to cyclonic eddies east of 125°E is the dominate factor controlling the interannual variation of the Kuroshio east of Taiwan Island.
To further investigate the relative eflect of cyclonic and anticyclonic eddies on interannual variation of the Kuroshio east of Taiwan Island, it is of interest to examine correlation between the Kuroshio there and the relative number (intensity) of mesoscale eddies in the STCC region (21.5°-25.5°N, 123°-140°E). We estimated the number of eddies in the STCC region by finding the maximum or minimum value of relative vorticity (ε=∂Vg/∂x-∂Ug/∂y), which was derived from the ADT-based geostrophic velocity. Eddy intensity was defined as the absolute vorticity at its center, following the method of Hsin et al. (2013). Positive vorticity indicates the presence of a cyclonic eddy in the Northern Hemisphere, and negative vorticity an anticyclonic eddy. As revealed in Fig. 10, the ratio of anticyclonic to cyclonic eddy number had strong interannual variability, as was the case for intensity. The correlation coefficient of Kuroshio surface transport and ratio of anticyclonic to cyclonic eddy number is only 0.18. This outcome means that the number of anticyclonic versus cyclonic eddies is not a direct cause of interannual variation of the Kuroshio east of Taiwan Island.

|
| Figure 10 Correlation between Kuroshio surface transport and ratios of anticyclonic to cyclonic eddies, for numbers (a) and intensities (b) ST represent the surface transport, RN represent the relative number of anticyclonic to cyclonic eddies, RI represent the relative intensity of anticyclonic to cyclonic eddies, and data smoothed by 13-month, low-passed filter. |
Nevertheless, correlation coefficients of the Kuroshio and ratio of anticyclonic to cyclonic eddy intensity reached 0.66 (Fig. 10b). Correlation coefficients between Kuroshio surface transport and the ratio of anticyclonic to cyclonic eddy intensity increased significantly, implying that interannual variation of the relative intensity of anticyclonic versus cyclonic eddies is highly consistent with that of Kuroshio surface transport; this may be induced by the interannual oscillation of PTO. As discussed above, the Kuroshio east of Taiwan Island showed strong spatial variation, so we need to investigate spatial variation of the influence of eddies on the surface Kuroshio east of Taiwan Island.
To address this subject, monthly average Kuroshio surface transport was averaged over 22°-23°N and 24°-25°N to compare the influence of eddies on interannual variation of the Kuroshio to the northeast versus southeast of Taiwan Island. As shown in Fig. 11, the ratio of anticyclonic to cyclonic eddy intensity had strong interannual variation, but this variation depended on the area. It is seen that Kuroshio surface transport southeast of Taiwan Island had strong correlation with the ratio of anticyclonic to cyclonic eddy intensity in the area between 21.5° and 23.5°N, with maximum correlation coefficient 0.61. However, the Kuroshio northeast of Taiwan Island was also strongly correlated with the aforementioned ratio in the area between 23.5° and 25.5°N. This result indicates that the impact of mesoscale eddies on interannual variation of the surface Kuroshio varies by area.

|
| Figure 11 Normalized monthly average ratio of anticyclonic eddy intensity to cyclonic eddy intensity between 125°E and 140°E superimposed by monthly anomalies of Kuroshio surface transport RI represent the relative intensity of anticyclonic to cyclonic eddies, and data smoothed by a 13-month, low-passed filter. |
As discussed above, the relative intensities of anticyclonic eddies to cyclonic eddies in the STCC (123°-140°E) play the most important role in modulating interannual variation of the Kuroshio east of Taiwan Island. However, the relative numbers of anticyclonic versus cyclonic eddies have a much weaker impact on that variation.
5 CONCLUSIONBased on 23-year (1993-2015) ADT data from satellite altimetry, we investigated seasonal and interannual variation of the Kuroshio east of Taiwan Island. The results indicate that the current has a pronounced spatiotemporal variation in its surface transport, width, and axis. The primary periods of that transport are 1 and 2.8 years. The width of the Kuroshio is ~140 km with a standard deviation of 30 km, which is less than that in the East China Sea because of the restriction of Taiwan Island Island. The surface transport averaged over 23 years is ~7.75×10⁴ m2/s. Seasonal variation of Kuroshio axis is not obvious, except to the northeast and southwest of Taiwan Island where the intrusion occurs. The Kuroshio surface transport is strongest in summer and weakest in winter. Diagnostic analysis suggests that local monsoon winds constitute the dominant control on seasonal variability of Kuroshio surface transport east of Taiwan Island.
On interannual time scales, variation of the surface Kuroshio is more closely related to the PTO index than other indices, for example, ENSO, PDO, and the meridional wind anomaly. The Kuroshio east of Taiwan Island had a linear increasing trend during 1993-2015, which may be associated with global warming, and this was important to air-sea interaction in the northwestern Pacific. Composite analysis indicated that PTO-induced fluctuation of relative intensities of anticyclonic to cyclonic eddies in the STCC (125°-140°E) is the major factor controlling the interannual variation of the Kuroshio east of Taiwan Island. Nevertheless, further research is needed to investigate whether the PTO is related to baroclinic instability in the STCC, which results in mesoscale eddies.
| Andres M, Park J H, Wimbush M, et al, 2009. Manifestation of the Pacific decadal oscillation in the Kuroshio. Geophysical Research Letters, 36(16). Doi: 10.1029/2009GL039216 |
| Ashok K, Behera S K, Rao S A, et al, 2007. El Niño Modoki and its possible teleconnection. Journal of Geophysical Research, 112(C11). Doi: 10.1029/2006JC003798 |
| Chang Y L, Oey L Y, 2011. Interannual and seasonal variations of Kuroshio transport east of Taiwan inferred from 29 years of tide-gauge data. Geophysical Research Letters, 38(8): L08603. Doi: 10.1029/2011GL047062 |
| Chang Y L, Oey L Y, 2012. The Philippines-Taiwan oscillation:monsoonlike interannual oscillation of the subtropicaltropical western North Pacific wind system and its impact on the ocean. Journal of Climate, 25(5): 1597–1618. Doi: 10.1175/JCLI-D-11-00158.1 |
| Chen C T A, 1996. The Kuroshio intermediate water is the major source of nutrients on the East China Sea continental shelf. Oceanologica Acta, 19(5): 523–527. |
| Chu T Y, 1974. The fluctuations of the Kuroshio current in the eastern sea area of Taiwan. Acta Anaesthesiologica Taiwanica, 4: 1–12. |
| Chuang W S, Liang W D, 1994. Seasonal variability of intrusion of the Kuroshio water across the continental shelf northeast of Taiwan. Journal of Oceanography, 50(5): 531–542. Doi: 10.1007/BF02235422 |
| Gilson J, Roemmich D, 2002. Mean and temporal variability in Kuroshio geostrophic transport south of Taiwan (1993-2001). Journal of Oceanography, 58(1): 183–195. Doi: 10.1023/A:1015841120927 |
| Guo X Y, Miyazawa Y, Yamagata T, 2006. The Kuroshio onshore intrusion along the shelf break of the East China Sea:the origin of the Tsushima Warm Current. Journal of Physical Oceanography, 36(12): 2205–2231. Doi: 10.1175/JPO2976.1 |
| Hsin Y C, Qiu B, Chiang T L, et al, 2013. Seasonal to interannual variations in the intensity and central position of the surface Kuroshio east of Taiwan. Journal of Geophysical Research, 118(9): 4305–4316. |
| Hsin Y C, Wu C R, Shaw P T, 2008. Spatial and temporal variations of the Kuroshio east of Taiwan, 1982-2005:a numerical study. Journal of Geophysical Research, 113(C4). Doi: 10.1029/2007JC004485 |
| Hwang C, Kao R, 2002. TOPEX/POSEIDON-derived spacetime variations of the Kuroshio Current:applications of a gravimetric geoid and wavelet analysis. Geophysical Journal International, 151(3): 835–847. Doi: 10.1046/j.1365-246X.2002.01811.x |
| Jan S, Yang Y J, Wang J, et al, 2015. Large variability of the Kuroshio at 23.75°N east of Taiwan. Journal of Geophysical Research, 120(3): 1825–1840. |
| Jia Y L, Liu Q Y, Liu W, et al, 2004. The interannual variation of the Kuroshio transport east of Taiwan. Oceanologia et Limnologia Sinica, 35(6): 507–512. |
| Johns W E, Lee T N, Zhang D X, Zantopp R, Liu C T, Yang Y, 2001. The Kuroshio east of Taiwan:moored transport observations from the WOCE PCM-1array. Journal of Physical Oceanography, 31(4): 1031–1053. Doi: 10.1175/1520-0485(2001)031<1031:TKEOTM>2.0.CO;2 |
| Kashino Y, España N, Syamsudin F, et al, 2009. Observations of the North Equatorial current, Mindanao current, and Kuroshio current system during the 2006/07 El Niño and 2007/08 La Niña. Journal of Oceanography, 65(3): 325–333. Doi: 10.1007/s10872-009-0030-z |
| Kwon Y O, Alexander M A, Bond N A, et al, 2010. Role of the Gulf Stream and Kuroshio-Oyashio systems in large-scale atmosphere-ocean interaction:a review. Journal of Climate, 23(12): 3249–3281. Doi: 10.1175/2010JCLI3343.1 |
| Liang W D, Tang T Y, Yang Y J, Ko M T, Chuang W S, 2003. Upper-ocean currents around Taiwan. Deep Sea Research Part Ⅱ, 50(6-7): 1085–1105. Doi: 10.1016/S0967-0645(03)00011-0 |
| Liu Z Q, Gan J P, 2012. Variability of the Kuroshio in the East China Sea derived from satellite altimetry data. Deep Sea Research Part Ⅰ, 59: 25–36. Doi: 10.1016/j.dsr.2011.10.008 |
| Nitani H. 1972. Beginning of the Kuroshio. In: Stommel H, Yoshida K eds. Kuroshio: Its Physical Aspects. University of Tokyo Press, Tokyo, Japan. p. 129-163. |
| Oey L Y, Chang M C, Chang Y L, et al, 2013. Decadal warming of coastal China Seas and coupling with winter monsoon and currents. Geophysical Research Letters, 40(23): 6288–6292. Doi: 10.1002/2013GL058202 |
| Oey L Y, Chang Y L, Lin Y C, et al, 2014. Cross flows in the Taiwan Strait in winter. Journal of Physical Oceanography, 44(3): 801–817. Doi: 10.1175/JPO-D-13-0128.1 |
| Oey L Y, Hsin Y C, Wu C R, 2010. Why does the Kuroshio northeast of Taiwan shift shelfward in winter?. Ocean Dynamics, 60(2): 413–426. Doi: 10.1007/s10236-009-0259-5 |
| Qi J F, Yin B S, Yang D Z, et al, 2014. The inter-annual and inter-decadal variability of the Kuroshio volume transport in the East China Sea. Oceanologia et Limnologia Sinica, 45(6): 1141–1147. |
| Qu T D, Lukas R, 2003. The bifurcation of the north equatorial current in the Pacific. Journal of Physical Oceanography, 33(1): 5–18. Doi: 10.1175/1520-0485(2003)033<0005:TBOTNE>2.0.CO;2 |
| Shen M L, Tseng Y H, Jan S, et al, 2014. Long-term variability of the Kuroshio transport east of Taiwan and the climate it conveys. Progress in Oceanography, 121: 60–73. Doi: 10.1016/j.pocean.2013.10.009 |
| Soeyanto E, Guo X Y, Ono J, et al, 2014. Interannual variations of Kuroshio transport in the East China Sea and its relation to the Pacific Decadal Oscillation and mesoscale eddies. Journal of Geophysical Research, 119(6): 3595–3616. |
| Tang T Y, Yang Y J, 1993. Low frequency current variability on the shelf break northeast of Taiwan. Journal of Oceanography, 49(2): 193–210. Doi: 10.1007/BF02237288 |
| Tozuka T, Yamagata T, 2003. Annual ENSO. Journal of Physical Oceanography, 33(8): 1564–1578. Doi: 10.1175/1520-0485(2003)033<1564:AE>2.0.CO;2 |
| Tsui I F, Wu C R, 2012. Variability analysis of Kuroshio intrusion through Luzon Strait using growing hierarchical self-organizing map. Ocean Dynamics, 62(8): 1187–1194. Doi: 10.1007/s10236-012-0558-0 |
| Wang J, Ikeda M, 1997. Diagnosing ocean unstable baroclinic waves and meanders using the quasigeostrophic equations and Q-vector method. Journal of Physical Oceanography, 27(6): 1158–1172. Doi: 10.1175/1520-0485(1997)027<1158:DOUBWA>2.0.CO;2 |
| Wu C R, 2013. Interannual modulation of the Pacific Decadal Oscillation (PDO) on the low-latitude western North Pacific. Progress in Oceanography, 110: 49–58. Doi: 10.1016/j.pocean.2012.12.001 |
| Wu L X, Cai W J, Zhang L P, et al, 2012. Enhanced warming over the global subtropical western boundary currents. Nature Climate Change, 2(3): 161–166. Doi: 10.1038/nclimate1353 |
| Yan X M, Zhu X H, Pang C G, et al, 2016. Effects of mesoscale eddies on the volume transport and branch pattern of the Kuroshio east of Taiwan. Journal of Geophysical Research, 121(10): 7683–7700. |
| Yu J Y, Kim S T, 2013. Identifying the types of major El Niño events since 1870. International Journal of Climatology, 33(8): 2105–2112. Doi: 10.1002/joc.2013.33.issue-8 |
| Zhang Q L, Hou Y J, Yan T Z, 2012. Inter-annual and interdecadal variability of Kuroshio heat transport in the East China Sea. International Journal of Climatology, 32(4): 481–488. Doi: 10.1002/joc.v32.4 |
| Zhu X M, Liu G M, Wang J, et al, 2015. A numerical study on the relationships of the variations of volume transport around the China Seas. Journal of Marine Systems, 145: 15–36. Doi: 10.1016/j.jmarsys.2014.12.003 |