 2018, Vol. 36
Institute of Oceanology, Chinese Academy of Sciences
Article Information
- ZHANG Yafeng(张亚锋), WANG Xutao(王旭涛), YIN Kedong(殷克东)
- Spatial contrast in phytoplankton, bacteria and microzooplankton grazing between the eutrophic Yellow Sea and the oligotrophic South China Sea
- Chinese Journal of Oceanology and Limnology, 36(1): 92-104
- http://dx.doi.org/10.1007/s00343-018-6259-x
Article History
- Received Sep. 20, 2016
- accepted in principle Nov. 22, 2016
- accepted for publication Feb. 22, 2017


2 Key Laboratory of Marine Resources and Coastal Engineering in Guangdong Province, Guangzhou 510006, China;
3 Scientific Institute of Pearl River Water Resources Protection, Guangzhou 510000, China
The plankton growth rate is an important characteristic of bacterial and eukaryotic microbes in marine systems as growth vs. mortality sets the biomass levels of the entire community (Kirchman, 2015; Marañón, 2015). Generally, two approaches are used to estimate the growth rates of plankton (μ), namely use of biomass (B) and production (P) (μ=P/B) and measurement of the abundance or phytoplankton pigments over time during incubation by the dilution method or by removing potential grazers (Landry and Hassett, 1982; Ducklow, 1999; Laws, 2013; Kirchman, 2015).
Phytoplankton growth rates in the euphotic zone of the ocean are largely controlled by the grazing activities of micro-and mesozooplankton and the recycling of nutrients associated with the catabolism of consumed prey (Laws, 2013). Although the growth rates of the phytoplankton and bacteria estimated from the production and biomass approach are highly significantly correlated with each other (Kirchman et al., 2009), the growth rates of heterotrophic bacteria are more complicated (Kirchman, 2015). Primary production and bacterial production set the contribution of phytoplankton and bacteria to the flow of elements and energy to higher trophic levels (Kirchman, 2015). Accordingly, their relationship can be used to explore the roles of microbes in the carbon cycle of an ecosystem. In general, the ratio of bacterial to primary production increases from eutrophic to oligotrophic conditions (Sturluson et al., 2008; Zhou et al., 2011). However, the impact factors for this variability are not straightforward because of the diverse temperature, plankton size structure, and grazing activity between diflerent trophic waters. Therefore, the first objective of this study was to examine the eflects of environmental factors on carbon flow between trophic levels in diflerent trophic waters.
The Yellow Sea (YS) is a typical shallow epicontinental sea. The water column in the YS is completely mixed and nutrients are abundant in the euphotic zone during winter and early spring (Lin et al., 2005). In contrast, the South China Sea (SCS) is a typical oligotrophic ocean with low nutrients in the surface year-round (Wong et al., 2007). Several studies have investigated microzooplankton grazing activity in both the YS and SCS (Chen et al., 2013; Sun et al., 2013; Zhou et al., 2015), but few have compared their environmental conditions in the spatial gradient. In this study, three cruises were conducted to examine the spatial distribution of salinity, temperature, nutrients, primary production, bacterial abundance and production, as well as microzooplankton grazing rates in the YS and SCS during March and May of 2005. The second objective was to illuminate the changing roles of phytoplankton, bacteria and microzooplankton in the eutrophic to oligotrophic oceans.
2 MATERIAL AND METHOD 2.1 SamplingThree cruises were conducted in the YS during March (19–27) and May (15–20), and in the SCS during May (1–15) of 2005. Vertical profiles of salinity and temperature were obtained using conductivity temperature depth profiler (CTD) and discrete seawater samples were collected in bottles of the CTD rosette at the sampling stations (Fig. 1). All water samples were filtered through 200 μm filters to remove the mesozooplankton. Subsamples for inorganic nutrients (nitrate, nitrite, ammonium and phosphate), chlorophyll a (Chl-a), and bacterial abundance were collected and treated (e.g., filtration) immediately, after which they were stored at -20℃ for laboratory analysis on shore. Samples were incubated on deck to determine the primary production, bacterial production and microzooplankton grazing rates. All incubation bottles, tubes, and carboys were washed with 10% HCl and rinsed thoroughly with distilled water and ambient seawater prior to each incubation.

|
| Figure 1 Sampling stations in the three cruises during March and May in the YS (March-YS, May-YS) and during May in the SCS (May-SCS) |
Primary production was obtained according to the method described by the JGOFS protocols (Knap et al., 1996). Seawater (50 mL) from depths of 100%, 50%, 30%, 10%, and 1% of the surface light were incubated in glass bottles for 24 hours after the addition of 20 μCi NaH14CO3 in dim light. Diflerent layers of neutral density screen were used to achieve a range of incubation light intensities that simulated those at the sampling depths. The bottles were placed in incubation-plexiglass boxes cooled by flowing surface seawater. At the end of the incubation period, the incubated samples were filtered through 5 μm filters and GF/F filters, after which the filters were stored at -20℃ until they were analyzed in the laboratory. A filter was placed into a scintillation vial containing 0.2 mL of 0.5 N HCL for 12 hours to remove inorganic carbon, after which 10 mL of scintillation cocktail was added to the vial. The vials were then counted on a Beckman 1414 CA/LL liquid scintillation counter and the 14C uptake rates were calculated at a DIC concentration of 25 000 mg C/m3. Daily primary production was calculated according to the formula:
Daily primary production (mg C/(m3·d))= (SDPM/V)×(25000)/TDPM/T,
where SDPM is disintegrations per minute (DPMs) in filtered sample; V is the volume of filtered sample; TDPM is the total DPMs added in the sampler; 25 000 is DIC concentration; T is the incubation time (days). Integrated primary production was calculated by integrating primary production over depth.
New production was measured according to the method of the JGOFS protocols (Knap et al., 1996). Sampling protocols followed those in primary production, but with an additional sampling depth below the 1% light depth. After adding 15NO3- and 15NH4+ at an ambient concentration of 10%, the samples were incubated for 6 hours (usually from noon to 5:00 pm). The incubation was terminated by filtering the samples through GF/F filters, which were analyzed in the laboratory using the Dumas combustion method (Nelson and Smith, 1986). New production and regenerated production were measured based on the 15N-labelled nitrate and ammonium uptake rates, respectively. The f-ratio was calculated with the formula: f-ratio=ρNO3-/(ρNO3-+ρNH4+), which represents new production/(new production+ regenerated production) (Eppley and Peterson, 1979).
2.3 Bacterial biomass and productionBacterial abundance was determined by the DAPI direct count method (Porter and Feig, 1980). Bacterial biomass (BB) was calculated with a conversion factor of 20 fg C/cell (Lee and Fuhrman, 1987). Bacterial production was determined by 3H-thymidine incorporation with a conversion factor of 1.18×10¹⁸ cells mol/thymidine (Fuhrman and Azam, 1982). 3H-thymidine (final concentration 10 nmol/L) was added to 2 mL subsamples (triplicate), with one control fixed by trichloroacetic acid (TCA, 5% final concentration). The subsamples were cooled by flowing surface water while incubated for 0.5 h in darkness, after which the incubation was terminated by adding 5% TCA. The subsamples were then rinsed and centrifuged three times with 5% TCA, after which scintillation cocktail was added to the vial. The 3H counts were determined with a Beckman 1414 CA/LL liquid scintillation counter. Integrated bacterial production was calculated by integrating bacterial production over the euphotic depth. Bacterial turnover time was calculated by dividing the bacterial biomass by bacterial production (bacterial biomass (mg C/m3)/ bacterial production (mg C/(m3·d)).
2.4 Microzooplankton grazing rateMicrozooplankton grazing rate (m) and phytoplankton instantaneous growth rate (μ) were estimated by dilution experiments (Landry and Hassett, 1982). Initial seawater (ISW) was filtered through 0.2 μm filters to produce phytoplankton free water (PFW). Five targeted dilutions of ISW (0.2, 0.4, 0.6, 0.8, and 1.0) were prepared and placed in duplicate glass bottles. All bottles were incubated for about 24 hours in a plexiglass incubator with the flow of surface seawater, after which the samples filtered through 5 μm and GF/F filters. Triplicate water samples were also collected at the beginning of each incubation (time zero) to determine the initial concentrations of Chl-a.
Assuming an exponential growth model, we calculated the prey apparent growth rate (μ) in each dilution treatment according to the formula:
μ (/d)=[ln(Pt/Po)]/t,
where t is the duration of the incubation, and P0 and Pt are the initial and final Chl-a concentrations, respectively. Estimates of phytoplankton growth rate and microzooplankton grazing rate were derived from the linear regression of μ against the dilution factor (ISW: (ISW+PFW)).
2.5 Chl-a and inorganic nutrientsFor Chl-a, 1 L (or less) of seawater was filtered through 5 μm and GF/F filters, after which the filters were stored at -20℃ until they were analyzed in the laboratory. Chl-a concentrations were estimated by a calibrated 10-AU Turner Designs© fluorometer after the filters were extracted overnight in 90% acetone at 4℃ (Knap et al., 1996). Nutrients (nitrate, nitrate, ammonium and phosphate) were measured with a Skalar San Plus Auto-analyzer according to the chemical analyses methods in JGOFS (Knap et al., 1996).
We qualified all statistical analyses by using the least squares regression and Pearson's correlation coefficient to explore the linear and correlative relationship.
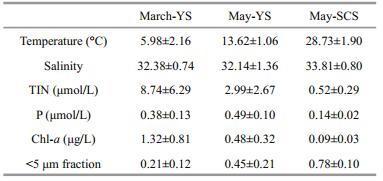
3 RESULT 3.1 Water column structure and nutrientsThere were spatial and temporal differences in salinity and temperature in the YS and SCS (Table 1). The average surface temperatures were 5.98±2.16℃ in March and 13.62±1.06℃ in May in the YS and 28.73±1.90℃ in May in the SCS. The average surface salinity decreased slightly from March (32.38±0.74) to May (32.14±1.36) in the YS, while it was much higher (33.81±0.80) in the SCS. The average surface total inorganic nitrogen (TIN: NO3+NO2+NH4) concentrations in the YS decreased from March (8.74±6.29 μmol/L) to May (2.99±2.67 μmol/L), and they were both higher than those in the SCS (0.52±0.29 μmol/L). The average surface phosphate (P) concentrations in the YS were 0.38±0.13 μmol/L in March and 0.49±0.10 μmol/L in May, while it was much lower (0.14±0.02 μmol/L) in the SCS in May.
|
Vertical profiles of temperature and salinity during the three cruises showed temporal progression in the YS and spatial diflerences from the YS to the SCS (Fig. 2). The water column in the YS was completely mixed during March as there were almost no diff erences in temperature and salinity between the surface and deeper layers. In May, the water column in the YS became stratified, with higher temperature and lower salinity at the surface than in the deeper layer. The mixing layer in the SCS was shallower than in the YS during May, and temperature decreased with increasing depth, while salinity increased.

|
| Figure 2 Vertical profiles of temperature and salinity at some sampling stations in the three cruises: March-YS, May-YS, and May-SCS |
Inorganic nutrients generally increased with depth (Fig. 3). The TIN and P in the well-mixed water column were relatively homogeneous during March in the YS. In contrast with the stratified water column in May, inorganic nutrients above the thermocline in the YS and SCS were both lower than in deeper waters. Overall, the TIN during March in the YS was higher than in May, while the P was relatively higher during May. However, both the TIN and P were much lower in the SCS during May.

|
| Figure 3 Vertical profiles of nutrient concentrations (TIN and P) at sampling stations during the three cruises: March-YS, May-YS and May-SCS |
Surface Chl-a in the YS decreased from March (1.32±0.81 μg/L) to May (0.48±0.32 μg/L), and was lowest in the SCS in May (0.09±0.03 μg/L) (Table 1). However, the percentage of 0.7–5 μm phytoplankton increased from March (0.21±0.12) to May (0.45±0.21) in the YS, and was highest in the SCS in May (0.78±0.10) (Table 1). When compared with the homogeneous distribution of Chl-a in the YS during March, there were chlorophyll maximum layers in the water column during May in both the YS and SCS (Fig. 4). The maximum Chl-a concentration was higher in the YS than in the SCS. The euphotic zone (1% light transmission layer) was shallowest (20 m) in March, deeper (50 m) in May in the YS, and the deepest (100 m) in the SCS in May. Primary production decreased with depth in both the YS and SCS, with higher primary production occurring in the YS, especially in March (Fig. 4).

|
| Figure 4 Vertical profiles of chlorophyll a (Chl-a) and primary production at sampling stations during the three cruises: MarchYS, May-YS and May-SCS |
Bacterial biomass in the YS, particularly in March, was higher than that in the SCS (Fig. 5). The vertical distributions of bacterial biomass were generally distributions of bacterial production during May were similar to those of the bacterial biomass, and both showed slightly higher values at the chlorophyll maximum layer (Fig. 5). Vertical changes in bacterial production were not apparent during March in the YS.

|
| Figure 5 Vertical profiles of bacterial biomass and bacterial production at sampling stations during the three cruises: MarchYS, May-YS and May-SCS |
Microzooplankton grazing rates (m) in the YS decreased from March (0.59±0.23/d) to May (0.30±0.14/d), while in the SCS, m was much higher (0.81±0.20/d) (Table 2). The average m during March for the small phytoplankton (<5 μm) fraction (1.0±0.29/d) was higher than that for the large phytoplankton (>5 μm) (0.54±0.19/d) (paired t-test, DF=5, two-tailed P < 0.01) in the YS. Grazing rates were 0.39±0.19/d and 0.34±0.10/d for small and large phytoplankton during May in the YS, respectively, which were not significantly diflerent. In contrast with the YS during March, microzooplankton preferred large phytoplankton (>5 μm) with a significantly higher m (1.09±0.32/d) over small phytoplankton (< 5 μm, 0.72±0.24/d) in the SCS during May. In addition, the average m/ratio in the YS during March was less than 1, while it was always higher than 1.0/d during May in the YS and SCS. In general, m in the YS was lower than that in the SCS, and microzooplankton preferred the small phytoplankton in the YS and the large phytoplankton in the SCS.

|
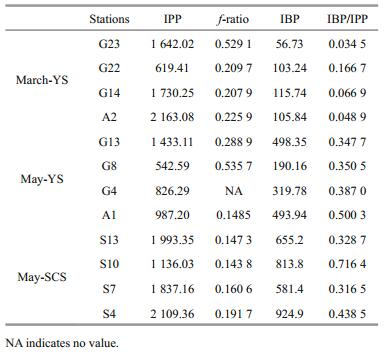
The average water column integrated primary production (IPP), integrated bacterial production (IBP) and f-ratio in the three cruises were compared (Table 3). The average IPP values in the YS were 1 538.69±566.20 mg C/(m2·d) in March and 947.30±322.50 mg C/(m2) in May, which were both lower than 1 768.97±377.98 mg C/(m2) in the SCS during May. The average f-ratio was generally higher in the YS than in the SCS, with values of 0.29±0.14 in March and 0.32±0.16 in May in the YS and 0.16±0.02 in May in the SCS. The IBP in the euphotic layer increased from March (95.39±22.80 mg C/(m2)) to May (375.55±129.01 mg C/(m2)) in the YS, while the IBP in the SCS in May (743.82±134.09 mg C/(m2)) was the highest (Table 3). The ratios of IBP to IPP were 0.08±0.05 and 0.40±0.06 in the YS during March and May, respectively, and 0.45±0.16 in the SCS during May.
|
The water column went through the temporal and spatial shifts from low to high temperature, weak to strong stratification and high to low nutrients during March in the YS and May in the YS and SCS. This progression of the spatial water column provided us with a good opportunity to examine roles of phytoplankton, bacteria and grazing rates between contrasting trophic waters.
4.1 Size structure in contrasting trophic watersCommunity size structure largely controls the trophic organization of planktonic communities and the efficiency with which they export biogenic materials toward the ocean's interior (Finkel et al., 2010; Marañón, 2015). Temperature and resource availability are believed to mainly regulate the phytoplankton size structure in diflerent marine ecosystems (Morán et al., 2010; Marañón et al., 2012; López-Urrutia and Morán, 2015; Marañón, 2015). We also observed a good correlation between the ratio of >5 μm Chl-a and temperature (Fig. 6). However, there were gaps between the >5 μm fraction Chl-a and primary production (Fig. 6). Because of changes in metabolic processes of gain (carbon fixation) and loss (exudation, respiration), size class depends not only on growth, but also on loss processes such as predation (Marañón, 2015). Therefore, it is reasonable to believe that grazing activity, by impacting the loss processes of phytoplankton biomass, also regulates phytoplankton size structure.

|
| Figure 6 Relationships between >5 μm chlorophyll a (Chl-a, solid circles) or primary production (PP, open circles) and temperature in the YS and SCS cruises |
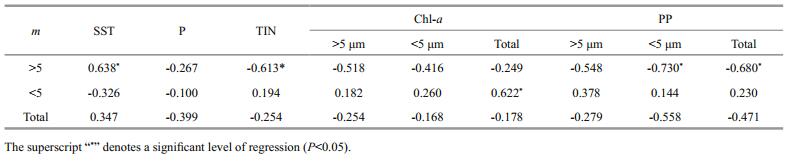
Microzooplankton (< 200 μm) plays an important role in transferring organic matter to higher trophic levels in the euphotic zone in the sea, which can result in 60%–80% loss of daily primary production (Calbet and Landry, 2004; Chen et al., 2013; Zhou et al., 2015). In general, microzooplankton grazing rates in oligotrophic waters are always greater than in eutrophic waters (Laws, 2003; Strom et al., 2007; Chen et al., 2013), and the loss ratio of phytoplankton to microzooplankton (m/) is also greater in oligotrophic waters dominated by small species (Laws, 2003), which is consistent with our results (Table 2). As the size-structured models suggested that an increase in phytoplankton size produced a reducing eflect on microzooplankton grazing (Chen and Liu, 2010), the grazing data showing that the microzooplankton grazing rate in the YS is less than that in the SCS supports this model. In addition, higher temperature favors microzooplankton grazing activity in the SCS over the YS (Table 4), as the increase in temperature stimulates the grazing activity of microzooplankton on large phytoplankton, which could result in a shift toward a smaller size dominant community (Montagnes et al., 2008; Sommer and Lengfellner, 2008). It appears that grazers feeding on large phytoplankton (>5 μm) are more responsive to environmental factors such as temperature, inorganic nutrients (TIN) and primary production, while those feeding on smaller phytoplankton (< 5 μm) were only correlated with the total Chl-a concentration (Table 4). Other studies in the SCS have shown that microzooplankton grazing partially contributes to the dominance of small phytoplankton (Zhou et al., 2015). Therefore, temperature, resource availability and grazing activity together regulate the community size structure in the SCS.
|
The roles of top-down and bottom-up control in regulating bacterial biomass vary in contrasting trophic waters (Laws, 2013; Kirchman, 2015). Our finding that bacterial biomass was significantly correlated with both inorganic (TIN) and organic (Chl-a) resource supply in the YS and SCS support the view that bottom-up control played an important role in the oligotrophic system (Fig. 7). The temporal and spatial gradient of resource supply could have contributed to the higher Chl-a and bacterial biomass observed in the YS than in the SCS. This is similar to the observation along the gradient of nutrients from the Zhujiang (Pearl) River estuarine plume to off shore of the oligotrophic SCS (Zhou et al., 2011). In addition, the eflects of grazing activity on bacterial biomass should also be considered. Previous studies demonstrated that a small protist community (< 20 μm) dominated the phytoplankton community in the oligotrophic water (Chiang et al., 2002; Tsai et al., 2008), and that protozoa ingested four-fold more bacteria than phytoplankton in the oligotrophic ocean (De Laender et al., 2010), indicating that grazers might be responsible for the lowest bacterial biomass in the SCS. Vaqué et al. (2014) found that phytoplankton, ciliate and bacterial biomass decreased as the nutrient concentrations decreased along a trophic gradient from coastal upwelling to oligotrophic waters in the subtropical northern Atlantic Ocean, but that bacterial biomass losses to grazers were generally higher at off shore than upwelling stations.

|
| Figure 7 Relationships of bacterial biomass (BB) vs TIN and Chl-a (a and b); bacterial production (BP) vs P (c); and bacterial turnover time vs 0.7–5 μm size phytoplankton fraction (d) in the YS and SCS cruises Solid lines indicate a significant correlation at P < 0.01. |
Bacterial production is a trade-off between temperature and nutrients supply (Adams et al., 2010; Sinsabaugh and Shah, 2010). During the cruises, we observed a positive correlation between bacterial production and inorganic P (Fig. 7), which agreed with the results reported by Yuan et al.(2011a, b), who found that inorganic P was potentially the most limiting nutrient for bacterial production in waters influenced by the Zhujiang River estuarine and the northern SCS. However, the correlation between bacterial production and temperature was weak in the present study. This might have been due to the very low P in the SCS, which obscured the eflects of temperature, as less than 0.2 μmol/L P could limit bacterial production as reported by Yuan et al. (2011b). Higher bacterial production in the YS during May than March confirmed the role of temperature on bacterial production, which weighed more than P in the YS. Bacterial turnover time, the reciprocal of growth rate, can reflect the activity of the microbial loop. Our results revealed a significant correlation between bacterial turnover time and the small phytoplankton (0.7–5 μm) fraction (Fig. 7). These findings indicated that nutrient recycling within the microbial loop tended to be dominant when nutrients became more deficient for large phytoplankton. Similar results were observed in the SCS (Ning et al., 2005; Yuan et al., 2011a).
4.3 Role of the microbial loop in the carbon cycle between the YS and SCSThe ratio of bacterial production to primary production (BP:PP) indicates the recycling efficiency of organic matter through bacteria. On average, bacterial production accounts for 30% of the primary production in lakes and coastal marine systems, but the ratio could be as high as 0.8 in tropical regions, and even exceed 1 in oligotrophic oceans (Hoppe et al., 2002; Gasol et al., 2009). The lower ratio for the YS (about 10%) during the spring bloom in March than in May (about 30%) indicated increased bacterial activities and the flux of a greater portion of primary production through bacteria as the nutrients were depleted. In the SCS, the ratio increased by up to about 48%, indicating a more important role played by bacteria in the carbon cycle. Such high consumption of primary production by bacteria has also been found in several lakes and oceanic waters (Thingstad et al., 1998; Zohary et al., 2005; Alonso-Sáez et al., 2007). Lai et al. (2014) found contrasting relationships among bacterial production, dissolved organic carbon and primary production in the transition zone from the eutrophic northern South China Sea shelf to the oligotrophic basin. We found that bacteria played a more important role as the euphotic zone became more oligotrophic from March to May in the YS and from the YS to SCS in May, as the BP: PP ratio was positively correlated with temperature and the small phytoplankton (0.7–5 μm) fraction (Fig. 8).

|
| Figure 8 The relationships of BP:PP vs temperature (a), BP:PP vs 0.7–5 μm size phytoplankton fraction (b), f-ratio or IBP:IPP vs temperature in the YS and SCS cruises (c) Solid lines indicate significant correlation at P < 0.01. |
In the water column, the lower f-ratio in the SCS than in the YS indicates greater dependence of primary production on regenerated nutrients, which is consistent with the high microzooplankton grazing activity and the strong stratification in the SCS (Fig. 8). The ratio of integrated bacterial production to integrated primary production (IBP:IPP) indicates heterotrophy or autotrophy in the euphotic zone, and the global average ratio is usually less than 25% (Ducklow, 1999). The average ratio in the YS during March is in agreement with this value (Table 3). However, the ratio of IBP:IPP in the YS during the post-bloom period was slightly higher, and that in the SCS was as high as 45%, indicating that the heterotrophic condition increased in the YS from March to May (bloom to post bloom period), whereas the SCS was heterotrophic (Fig. 8). Although previous studies have suggested that a high temperature or high concentration of DIC in deep water relative to nutrients resulted in the SCS being a source of CO2 to the atmosphere (Zhai et al., 2007; Dai et al., 2013), biological activity also contributed to this phenomenon. Therefore, as the temporal and spatial environmental conditions shift from low to high temperature, weak to strong stratification and high to low nutrients (eutrophy to oligotrophy), the temperature, nutrient supply, and microzooplankton grazing activity together actuated the classical food chain dominated plankton community to the microbial loop dominated community, and from autotrophy towards heterotrophy.
5 CONCLUSIONAs the water column went through temporal and spatial shifts from low to high temperature, weak to strong stratification and high to low nutrients, primary production, Chl-a concentration, bacterial biomass and f-ratio decreased, while microzooplankton grazing activity and IBP: IPP increased. These variations forced the community to evolve from a classical food chain dominated to a microbial loop dominated population, as well as from autotrophy to heterotrophy, while the water changed from a carbon sink to a carbon source.
| Adams H E, Crump B C, Kling G W, 2010. Temperature controls on aquatic bacterial production and community dynamics in arctic lakes and streams. Environ. Microbiol., 12(5): 1319–1333. Doi: 10.1111/emi.2010.12.issue-5 |
| Alonso-Sáez L, Arístegui J, Pinhassi J, Gómez-Consarnau L, González J M, Vaqué D, Agustí S, Gasol J M, 2007. Bacterial assemblage structure and carbon metabolism along a productivity gradient in the NE Atlantic Ocean. Aquatic Microbial Ecology, 46(1): 43–53. |
| Calbet A, Landry M R, 2004. Phytoplankton growth, microzooplankton grazing, and carbon cycling in marine systems. Limnology and Oceanography, 49(1): 51–57. Doi: 10.4319/lo.2004.49.1.0051 |
| Chen B Z, Liu H B, 2010. Relationships between phytoplankton growth and cell size in surface oceans:interactive effects of temperature, nutrients, and grazing. Limnology and Oceanography, 55(3): 965–972. Doi: 10.4319/lo.2010.55.3.0965 |
| Chen B, Zheng L, Huang B, Song S, Liu H, 2013. Seasonal and spatial comparisons of phytoplankton growth and mortality rates due to microzooplankton grazing in the northern South China Sea. Biogeosciences, 10(4): 2775–2785. Doi: 10.5194/bg-10-2775-2013 |
| Chiang K P, Kuo M C, Chang J, Wang R H, Gong G C, 2002. Spatial and temporal variation of the Synechococcus population in the East China Sea and its contribution to phytoplankton biomass. Continental Shelf Research, 22(1): 3–13. |
| Dai M H, Cao Z M, Guo X H, Zhai W D, Liu Z Y, Yin Z Q, Xu Y P, Gan J P, Hu J Y, Du C J, 2013. Why are some marginal seas sources of atmospheric CO2?. Geophysical Research Letters, 40(10): 2154–2158. Doi: 10.1002/grl.50390 |
| De Laender F, Van Oevelen D, Soetaert K, Middelburg J J, 2010. Carbon transfer in a herbivore-and microbial loopdominated pelagic food webs in the southern Barents Sea during spring and summer. Marine Ecology Progress Series, 398: 93–107. Doi: 10.3354/meps08335 |
| Ducklow H W, 1999. The bacterial component of the oceanic euphotic zone. FEMS Microbiology Ecology, 30(1): 1–10. Doi: 10.1111/fem.1999.30.issue-1 |
| Eppley R W, Peterson B J, 1979. Particulate organic matter flux and planktonic new production in the deep ocean. Nature, 282(5740): 677–680. Doi: 10.1038/282677a0 |
| Finkel Z V, Beardall J, Flynn K J, Quigg A, Rees T A V, Raven J A, 2010. Phytoplankton in a changing world:cell size and elemental stoichiometry. Journal of Plankton Research, 32(1): 119–137. Doi: 10.1093/plankt/fbp098 |
| Fuhrman J A, Azam F, 1982. Thymidine incorporation as a measure of heterotrophic bacterioplankton production in marine surface waters:evaluation and field results. Marine Biology, 66(2): 109–120. Doi: 10.1007/BF00397184 |
| Gasol J M, Vázquez-Domínguez E, Vaqué D, Agustí S, Duarte C M, 2009. Bacterial activity and diffusive nutrient supply in the oligotrophic Central Atlantic Ocean. Aquatic Microbial Ecology, 56(1): 1–12. |
| Hoppe H G, Gocke K, Koppe R, Begler C, 2002. Bacterial growth and primary production along a north-south transect of the Atlantic Ocean. Nature, 416(6877): 168–171. Doi: 10.1038/416168a |
| Kirchman D L, Morán X A G, Ducklow H, 2009. Microbial growth in the polar oceans-role of temperature and potential impact of climate change. Nature Reviews Microbiology, 7(6): 451–459. Doi: 10.1038/nrmicro2115 |
| Kirchman D L, 2015. Growth rates of microbes in the oceans. Annual Review of Marine Science, 8: 285–309. |
| Knap A H, Michaels A, Close A R, Ducklow H, Dickson A G. 1996. Protocols for the Joint Global Ocean Flux Study(JGOFS) Core Measurements. Report No. 19 170(Scientific Committee on Oceanic Research, International Council of Scientific Unions Intergovernmental Oceanographic Commission, 1996). |
| Lai C C, Fu Y W, Liu H B, Kuo H Y, Wang K W, Lin C H, Tai J H, Wong G T F, Lee K Y, Chen T Y, Yamamoto Y, Chow M F, Kobayashi Y, Ko C Y, Shiah F K, 2014. Distinct bacterial-production-DOC-primary-production relationships and implications for biogenic C cycling in the South China Sea shelf. Biogeosciences, 11(1): 147–156. Doi: 10.5194/bg-11-147-2014 |
| Landry M R, Hassett R P, 1982. Estimating the grazing impact of marine micro-zooplankton. Marine Biology, 67(3): 283–288. Doi: 10.1007/BF00397668 |
| Laws E A, 2003. Mesozooplankton grazing and primary production:an alternative assessment. Limnology and Oceanography, 48(3): 1357–1359. Doi: 10.4319/lo.2003.48.3.1357 |
| Laws E A, 2013. Evaluation of in situ phytoplankton growth rates:a synthesis of data from varied approaches. Annual Review of Marine Science, 5: 247–268. Doi: 10.1146/annurev-marine-121211-172258 |
| Lee S, Fuhrman J A, 1987. Relationships between biovolume and biomass of naturally derived marine bacterioplankton. Applied and Environmental Microbiology, 53(6): 1298–1303. |
| Lin C, Ning X, Su J, Lin Y, Xu B, 2005. Environmental changes and the responses of the ecosystems of the Yellow Sea during 1976-2000. Journal of Marine Systems, 55(3-4): 223–234. Doi: 10.1016/j.jmarsys.2004.08.001 |
| López-Urrutia Á, Morán X A G, 2015. Temperature affects the size-structure of phytoplankton communities in the ocean. Limnology and Oceanography, 60(3): 733–738. Doi: 10.1002/lno.10049 |
| Marañón E, Cermeño P, Latasa M, Tadonléké R D, 2012. Temperature, resources, and phytoplankton size structure in the ocean. Limnology and Oceanography, 57(5): 1266–1278. Doi: 10.4319/lo.2012.57.5.1266 |
| Marañón E, 2015. Cell size as a key determinant of phytoplankton metabolism and community structure. Annual Review of Marine Science, 7: 241–264. Doi: 10.1146/annurev-marine-010814-015955 |
| Montagnes D J S, Morgan G, Bissinger J E, Atkinson D, Weisse T, 2008. Short-term temperature change may impact freshwater carbon flux:a microbial perspective. Global Change Biology, 14(12): 2823–2838. Doi: 10.1111/gcb.2008.14.issue-12 |
| Morán X A G, López-Urrutia Á, Calvo-Díaz A, Li W K W, 2010. Increasing importance of small phytoplankton in a warmer ocean. Global Change Biology, 16(3): 1137–1144. Doi: 10.1111/gcb.2010.16.issue-3 |
| Nelson D M, Smith W O Jr, 1986. Phytoplankton bloom dynamics of the western Ross Sea ice edge-Ⅱ. Mesoscale cycling of nitrogen and silicon. Deep Sea Research Part A. Oceanographic Research Papers, 33(10): 1389–1412. Doi: 10.1016/0198-0149(86)90042-7 |
| Ning X R, Li W K W, Cai Y M, Shi J X, 2005. Comparative analysis of bacterioplankton and phytoplankton in three ecological provinces of the northern South China Sea. Marine Ecology Progress Series, 293: 17–28. Doi: 10.3354/meps293017 |
| Porter K G, Feig Y S, 1980. The use of DAPI for identification and enumeration of bacteria and blue-green algae. Limnology and Oceanography, 25: 943–948. Doi: 10.4319/lo.1980.25.5.0943 |
| Sinsabaugh R L, Shah J J F, 2010. Integrating resource utilization and temperature in metabolic scaling of riverine bacterial production. Ecology, 91(5): 1455–1465. Doi: 10.1890/08-2192.1 |
| Sommer U, Lengfellner K, 2008. Climate change and the timing, magnitude, and composition of the phytoplankton spring bloom. Global Change Biology, 14(6): 1199–1208. Doi: 10.1111/j.1365-2486.2008.01571.x |
| Strom S L, Macri E L, Olson M B, 2007. Microzooplankton grazing in the coastal Gulf of Alaska:variations in topdown control of phytoplankton. Limnology and Oceanography, 52(4): 1480–1494. Doi: 10.4319/lo.2007.52.4.1480 |
| Sturluson M, Nielsen T G, Wassmann P, 2008. Bacterial abundance, biomass and production during spring blooms in the northern Barents Sea. Deep Sea Research Part Ⅱ:Topical Studies in Oceanography, 55(20-21): 2186–2198. Doi: 10.1016/j.dsr2.2008.05.001 |
| Sun J, Feng Y Y, Zhou F, Song S Q, Jiang Y, Ding C L, 2013. Top-down control of spring surface phytoplankton blooms by microzooplankton in the Central Yellow Sea, China. Deep Sea Research Part Ⅱ:Topical Studies in Oceanography, 97: 51–60. Doi: 10.1016/j.dsr2.2013.05.005 |
| Thingstad T F, Zweifel U L, Rassoulzadegan F, 1998. P limitation of heterotrophic bacteria and phytoplankton in the northwest Mediterranean. Limnology and Oceanography, 43(1): 88–94. Doi: 10.4319/lo.1998.43.1.0088 |
| Tsai A Y, Chiang K P, Chang J, Gong G C, 2008. Seasonal variations in trophic dynamics of nanoflagellates and picoplankton in coastal waters of the western subtropical Pacific Ocean. Aquatic Microbial Ecology, 51(3): 263–274. |
| Vaqué D, Alonso-Sáez L, Arístegui J, Agustí S, Duarte C M, Sala M M, Vázquez-Domínguez E, Gasol J M, 2014. Bacterial production and losses to predators along an open ocean productivity gradient in the subtropical North East Atlantic Ocean. Journal of Plankton Research, 36(1): 198–213. Doi: 10.1093/plankt/fbt085 |
| Wong G T F, Tseng C M, Wen L S, Chung S W, 2007. Nutrient dynamics and N-anomaly at the SEATS station. Deep Sea Research Part Ⅱ:Topical Studies in Oceanography, 54(14-15): 1528–1545. Doi: 10.1016/j.dsr2.2007.05.011 |
| Yuan X C, He L, Yin K D, Pan G, Harrison P J, 2011a. Bacterial distribution and nutrient limitation in relation to different water masses in the coastal and northwestern South China Sea in late summer. Continental Shelf Research, 31(11): 1214–1223. Doi: 10.1016/j.csr.2011.04.012 |
| Yuan X C, Yin K D, Harrison P J, He L, Xu J, 2011b. Variations in apparent oxygen utilization and effects of p addition on bacterial respiration in subtropical Hong Kong waters. Estuaries and Coasts, 34(3): 536–543. Doi: 10.1007/s12237-010-9329-7 |
| Zhai W D, Dai M H, Cai W J, Wang Y C, Hong H S, 2007. Erratum to "The partial pressure of carbon dioxide and air-sea fluxes in the northern South China Sea in spring, summer and autumn""[marine chemistry 96 (2005) 87-97]. Marine Chemistry, 103(1-2): 209. Doi: 10.1016/j.marchem.2006.06.014 |
| Zhou L B, Tan Y H, Huang L M, Hu Z F, Ke Z X, 2015. Seasonal and size-dependent variations in the phytoplankton growth and microzooplankton grazing in the southern South China Sea under the influence of the East Asian monsoon. Biogeosciences, 12(22): 6809–6822. Doi: 10.5194/bg-12-6809-2015 |
| Zhou W H, Long A M, Jiang T, Chen S Y, Huang L M, Huang H, Cai C H, Yan Y, 2011. Bacterioplankton dynamics along the gradient from highly eutrophic Pearl River Estuary to oligotrophic northern South China Sea in wet season:implication for anthropogenic inputs. Marine Pollution Bulletin, 62(4): 726–733. Doi: 10.1016/j.marpolbul.2011.01.018 |
| Zohary T, Herut B, Krom M D, Mantoura R F C, Pitta P, Psarra S, Rassoulzadegan F, Stambler N, Tanaka T, Thingstad T F, Woodward E M S, 2005. P-limited bacteria but N and P co-limited phytoplankton in the Eastern Mediterranean-a microcosm experiment. Deep Sea Research Part Ⅱ:Topical Studies in Oceanography, 52(22-23): 3011–3023. Doi: 10.1016/j.dsr2.2005.08.011 |