 2018, Vol. 36
Institute of Oceanology, Chinese Academy of Sciences
Article Information
- LIN Jia(林佳), ZHU Qing(祝青), HONG Yuehui(洪跃辉), YUAN Lirong(袁丽蓉), LIU Jinzhong(刘金钟), XU Xiaoming(徐小明), WANG Jianghai(王江海)
- Synchronous response of sedimentary organic carbon accumulation on the inner shelf of the East China Sea to the water impoundment of Three Gorges and Gezhouba Dams
- Chinese Journal of Oceanology and Limnology, 36(1): 153-164
- http://dx.doi.org/10.1007/s00343-017-6216-0
Article History
- Received Aug. 11, 2016
- accepted in principle Sep. 14, 2016
- accepted for publication Sep. 26, 2016


2 Guangzhou Institute of Geochemistry, Chinese Academy of Sciences, Guangzhou 510640, China
Coastal seas account for approximately 10% of the total marine area, but play a disproportionate role in global carbon cycling. Over 80% of total organic carbon (TOC) is buried on the continental shelf and slope, where they subsequently become a large active carbon pool in the marine system and an important sink/source for global carbon cycling (Muller-Karger et al., 2005; Zhu et al., 2006; Yang et al., 2010; Li et al., 2013). Because coastal seas are situated in the transitional area between the continent and open ocean, the TOC deposited in this area is a complex mixture of terrestrial and marine sources. Therefore, coastal sedimentary TOC is a product of land-sea interactions and can be a powerful proxy for tracing marine primary productivity and terrestrial input (Suess, 1980; Tesi et al., 2007).
The East China Sea (ECS) is the largest river-dominated coastal sea in the western Pacific Ocean. The variations in sedimentary TOC in the ECS are aff ected by numerous factors. The enormous input from large rivers, mainly the Changjiang (Yangtze) River, primarily controls the sediment source on the inner shelf of the ECS. The Changjiang River annually releases about 4.3×10⁸ tons of suspended matters into its estuary (Yang et al., 2003). The East Asian monsoon and the complex current system are also critical factors that influence the organic carbon transport (Chen et al., 2003; Li et al., 2012). Additionally, over the last few decades, intense human activities in the coastal zone contributed significant sedimentary TOC to the ECS (Li et al., 2015b, 2016). Therefore, studying carbon sedimentary records from marine cores may reveal the controlling factors on carbon burial and help to better understand the relationship between natural processes and anthropogenic disturbance in the ECS.
Previous studies on ECS carbon records mainly focused on surface sediments (Huang et al., 2011; Lin et al., 2012; Li et al., 2014). Although TOC has been employed to indicate terrestrial input and marine primary productivity (Zhu et al., 2014; Li et al., 2015b), few investigators have performed corrections for decomposition (Zhu et al., 2014). Moreover, the temporal resolution of the sedimentary carbon records from the ECS are generally 3-8 years; few highresolution (annual) carbon records are available (Zhu et al., 2014). Since the water impoundment of Gezhouba Dam (GD) and the Three Gorges Dam (TGD) began, sediments (including TOC) and nutrients in the Changjiang River have partially been trapped in these great reservoirs, resulting in changes to sediments (Gao et al., 2012; Li et al., 2015a) and the marine ecosystem (Tsai et al., 2010) of the ECS inner shelf. However, to the best of our knowledge, a high-resolution sedimentary TOC record before and after the water impoundment of these dams and its eff ect on the ECS has not been presented. In this study, the TOC contents from a sediment core with a high sedimentation rate from the ECS inner shelf were systematically measured. Combining with the data of black carbon (BC) and 210Pb dating, an improved model was chosen to correct the TOC contents for its decomposition during early diagenesis. We reconstructed century-scale high-resolution TOC sequences from the ECS inner shelf, in which the synchronous responses of sedimentary TOC accumulation to the water impoundment of the TGD and GD were recognized. Our results better reflect the interaction between human activities and natural processes and describe the ecological eff ects induced by the water impoundment of large dams.
2 MATERIAL AND METHOD 2.1 Study areaThe ECS is east of the Chinese mainland and covers ~1.25×10⁶ km2 with an average water depth > 200 m. It lies the Ryukyu Islands to the east, is bounded by the Yellow Sea to the north and links the South China Sea to the south through the Taiwan Strait. The ECS receives suspended sediments discharged by larger rivers, including the Changjiang, Qiantangjiang, Jiaojiang, Oujiang and Minjiang, but its sediment sources are mainly aff ected by the Changjiang River (Xu, 1985). The ECS is characterized by a complicated hydrodynamic system dominated by the Changjiang discharge, Kuroshio Current and Coastal Current (Song et al., 2016; Fig. 1). The Changjiang water, extending as a surface plume, flows southwards in boreal winter and northeastwards in summer. The Kuroshio Current travels northwards along the Okinawa Trough, bringing warm and saline water to the region. On the inner shelf, the warm and saline Taiwan Warm Current, an off shoot of the Kuroshio Current, flows northwards through the Taiwan Strait and enters the ECS (Guan and Mao, 1982). Along the coast off shore of Zhejiang and Fujian provinces, the Coastal Current flows southwards; it is intense in boreal winter, but weak in summer (Zhu et al., 2011).

|
| Figure 1 Map illustrating the location of sediment core DH5-1 and the circulation of the East China Sea (Song et al., 2016) KC: Kuroshio Current; TWC: Taiwan Warm Current; ECSCC: East China Sea Coastal Current; CDW: Changjiang discharge water. The hatched areas represent deposition of fine-grained sediments. |
Within the complicated hydrodynamic system of the ECS, two large fine-grained sediment depositional areas are present, one southwest of Cheju Island and the other on the inner shelf. The former is the main depositional center in the northern part of the ECS. The inner shelf depositional area, which is the focus of this study, extends southwards from the Changjiang River estuary to off shore Zhejiang and Fujian provinces with sediment thicknesses of 0-40 m (Liu et al., 2009).
Sediment core DH5-1 (28°26.16'N, 122°11.07'E) was collected from the middle of the inner shelf finegrained sediment zone in May 2012 using a box corer (Fig. 1). The core is 7 cm in diameter and 177 cm in length. After recovery, the core was sealed in clean polyvinyl chloride pipes and frozen onboard. It was delivered to the laboratory and stored at -20℃ before analysis.
2.3 Dating of sediment core DH5-1The 210Pb dating technique was used to determine the sediment age and sedimentation rates of core DH5-1. Fourteen subsamples (0.25 cm, 2.25 cm, 4.25 cm, 6.25 cm, 10.25 cm, 14.25 cm, 18.25 cm, 24.25 cm, 36.25 cm, 42.25 cm, 56.25 cm, 64.25 cm, 72.25 cm, 80.25 cm) were taken from the core and ground into powder to a grain size < 74 μm. The 210Pb dating was performed at the Guangzhou Institute of Geochemistry (Chinese Academy of Sciences). The average analytical error was < 3%. More details on the analytical procedures can be found in Xu et al. (2016a).
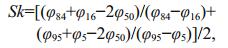
2.4 Grain size analysisCore DH5-1 was sectioned every 5 mm; this sampling resolution was determined in reference to the average sedimentation rate obtained by 210Pb dating. Approximately 50 mg of each subsample was used for grain size analysis. All subsamples were analyzed using a Mastersizer 2000 laser particle analyzer (Malvern, Worcestershire, UK) with the measurement range of 0.02–2 000 μm, size resolution of 0.01 μm, and measurement error < 2%. Prior to grain size measurements, the subsamples were spread out evenly by ultrasonic vibration, oxidized with 10% H 2O2 to remove organic matter, and dispersed in a 0.05% sodium hexametaphosphate solution to separate discrete particles. The grain size parameters, including mean grain size (Mz), sorting coefficient (σ), skewness (Sk), kurtosis (Kg) and median grain size (Md), were calculated accordingly. The parameters of σ, Sk and Kg were determined as follows:
 (1)
(1) (2)
(2) (3)
(3)where φ5, φ16, φ25, φ50, φ75, φ84 and φ95 are particle sizes at diff erent frequencies. Grain sizes were classified into three fractions, sand (> 63 μm), silt (4–63 μm), and mud (< 4 μm).
2.5 TOC and BC analysisSubsamples sectioned every 5 mm from core DH5-1 were freeze-dried, homogenized and pulverized into powders < 74 μm. About 100 mg of each subsample was placed into a disposable semi-permeable ceramic crucible, and treated with 3 mol/L HCl for 12 h to remove carbonates. The carbonate-free subsamples were then used for TOC analysis. The carbonate-free samples were further burned in an SG-GL1100 tube furnace at 375℃ for 24 h under continuous air to remove labile TOC before analyzing the BC contents (Gustafsson et al., 2001; Xu et al., 2016b). Both the TOC and BC were determined by using a CS230 C/S analyzer (LECO, St. Joseph, MI, USA) at the Guangzhou Institute of Geochemistry (Chinese Academy of Sciences). The detection limit of TOC or BC was (2.3±0.3) μg/g.
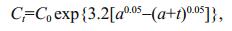
2.6 Sedimentary TOC correctionWhen using the sedimentary TOC record to reconstruct marine primary productivity and terrestrial input, the influence of early diagenesis needs to be considered. In this study, measured carbon was divided into labile organic carbon (LOC) and inert BC (Schmidt and Noack, 2000; Cheng et al., 2006), and only LOC was corrected for decomposition. We employed a modified model that combines a 2-G model and a power model to correct the measured TOC of each subsample. In the power model (Middelburg, 1989), the first-order kinetics for the decomposition of sedimentary TOC is described as:
 (4)
(4)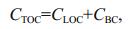 (5)
(5)where Ct is the concentration of LOC at time t, which exponentially decreases with time (t); C0 is the initial concentration of LOC at the water-sediment interface; CTOC is the concentration of TOC equal to the sum of BC and LOC; a represents the apparent initial age, which is used to distinguish the reactivity of LOC at the sediment surface under diff erent circumstances (Janssen, 1984; Middelburg, 1989). To obtain the parameter a for core DH5-1, the first LOC value at the sediment surface and the average LOC value of the upper section near the surface were selected. By substituting these two LOC values and the corresponding t into Eq.4, the a value for DH5-1 was determined. Finally, the initial concentration of LOC and corrected TOC (TOCcor) for each subsample was determined via substituting the known a into Eqs.4 and 5.
2.7 Detection and correction of stable carbon isotope ratios of sedimentary TOCThe carbonate-free subsamples were also used to measure the stable carbon isotope ratios of sedimentary TOC. Isotopic analyses were performed on an elemental analyzer isotope ratio mass spectrometer (EA-IRMS) at the Laboratory of Bioorganic Geochemistry (School of Marine Sciences, Sun YatSen University). Briefly, the gas stream of each subsample generated in the vario ISOTOPE cube elemental analyzer (Elementar, Hanau, Germany) was run into an IsoPrime 100 isotope ratio mass spectrometer (Elementar, Manchester, UK). The CO2 gas was analyzed by comparison with a reference gas (δ13C=-33.21‰), which was calibrated against reference material (IAEA-NBS-22) with a δ13C value of (-30.03±0.04)‰. All per mil designations are relative to Vienna PeeDee Belemnite. During every analytical batch, an empty tin capsule was measured as a blank to monitor background values, and a reference sulfanilamide (δ13C=(-28.13±0.02)‰) was used to evaluate reproducibility and accuracy. The analytical standard deviation and the deviation between the measured data and predetermined data were ±0.2‰.
Since the mid-18th century, atmospheric heavy carbon isotopes have been depleted because of the release of CO2 from the consumption of fossil fuels, which contain a lower abundance of 13C and almost no 14C (Keeling et al., 2013). This is called the Suess eff ect and it can be corrected for by using a polynomial equation provided by Schelske and Hodell (1995):
 (6)
(6)where t is time in chronological year, and -6.31‰ is the δ13C of atmospheric CO2 in 1840. The depletion in δ13C since 1840, yielded by Eq.6, was subtracted from the measured δ13C for each sample.
2.8 River discharge and sediment loadsThe measured annual discharge and sediment loads of the Changjiang River were obtained from the Datong hydrologic station, located at the lower reaches of the Changjiang River.
3 RESULT 3.1 ChronologyThe results from 210Pb dating are presented in Table S1. The 210Pb, 226Ra and 210PbEX activities of 14 subsamples from core DH5-1 range from 3.157 4 to 7.979 4 dpm/g, 0.624 7 to 0.877 1 dpm/g, and 2.307 8 to 7.208 2 dpm/g, respectively. The correlation equation between 210PbEX activity and depth is:
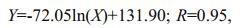 (7)
(7)where X, Y and R represent depth (in cm), 210PbEX activity, and the correlation coefficient, respectively.
The relationship between 210Pb and depth indicates continuous deposition at a nearly constant rate in core DH5-1. The linear equation between the logarithmic values of depth and 10PbEX yields an average sedimentation rate of (22.4±0.2) mm/a over 1931-2011 AD, which is consistent with previous results from the same area (Liu et al., 2009; Shi et al., 2010).
3.2 Grain size analysisGrain size and related parameters in core DH5-1 are presented in Table S2. Briefly, proportions of sand, silt and mud range from 0.23% to 12.77% (average 2.75%), 68.88% to 96.08% (average 82.42%), and 3.20% to 28.27% (average 14.83%), respectively, and the grain size parameters of Mz, σ, Sk, Kg and Md are 4.79-6.83 (average 6.02) 1.50-1.94 (average 1.66), 0-0.64 (average 0.31), 0.90-1.23 (average 1.08), and 5.54-6.86 (average 5.81), respectively. The profiles of grain-size composition and related parameters exhibit relatively stable trends as a whole except in 0-33 cm and 80-93 cm (Fig. 3). The higher contents of silt and mud in core DH5-1 and the relatively steady variations in grain size and related parameters indicate nearly continuous sedimentation.

|
| Figure 2 210Pb dating of sediment core DH5-1 |

|
| Figure 3 Grain size variations and their related parameters in core DH5-1 |
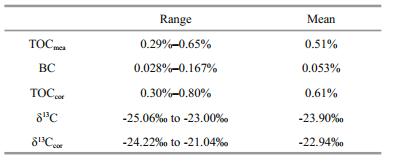
Sedimentary TOC and BC concentrations in sediment core DH5-1 are presented in Table S3, and their ranges and means are listed in Table 1. The measured TOC (TOCmea) widely fluctuates from 0.29% to 0.56% (average 0.51%), while BC ranges from 0.028% to 0.167% (average 0.053%).
|
To determine initial TOC contents, an improved decomposition model was adopted and yielded an initial age (a) of 18.68 yrs, which was then used to correct TOCmea, hereafter TOCcor. The TOCcor ranges from 0.30% to 0.80% with an average of 0.61% (Tables 1 and S3). As illustrated in Figure 4a and b, the profiles of TOCcor and TOCmea exhibit a very similar pattern. In Fig. 4b, TOCcor increases between 1931 and 1941 AD, and then slightly decreases from 1941 to 1985 AD. During the latter period, two n-shaped peaks occur at 1963-1967 AD and 1973-1977 AD. After 1985, there is an overall increasing trend from 0.30% to 0.66%; however, there are two intervals, 1985-1987 AD and 2003-2006 AD, in which notable TOC minima occur with reductions of 37% and 50%, respectively.

|
| Figure 4 Profiles of TOCmea, TOCcor and δ13C values in core DH5-1 |
The measured δ13C (δ13Cmea) of sedimentary TOC ranges from -25.06‰ to -23‰ (average -23.90‰). After correcting the Suess eff ect, the δ13C values range from -24.22‰ to -21.04‰ (average -22.94‰). Overall, δ13C in core DH5-1 exhibits an increasing trend from 1931 to 2011 AD, but a negative shift is evident from 1985 to 1987 AD (Fig. 4c).
4 DISCUSSION 4.1 Data quality of sedimentary TOCmea and TOCcorIn this study, we employed an improved method to measure sedimentary TOC (Xu et al., 2018a). Because the pretreatment of each subsample was performed in a disposable ceramic crucible with microporecontrolled capability, TOC loss from acidification procedures was completely eliminated. Moreover, to avoid the loss of volatile TOC, freeze-drying was used during pretreatment. Thus, these modified analytical methods ensured the high quality of the TOCmea data.
Since sedimentary TOC can be altered during early diagenesis, we employed an improved decomposition model, which combines 2-G and continuum models to obtain the true variation of initial TOC contents. This model yielded an initial age (a) of 18.68 yrs, which is consistent with sediments from bay environments (Middelburg, 1989). The parameter a reflects the reactivity of LOC at the sediment surface and the extent of LOC alteration during transport from the overlying water column to sediment (Middelburg, 1989; Jia et al., 2013). Thus, the low a value may denote a short transport distance and high chemical activity of LOC at the water-sediment interface.
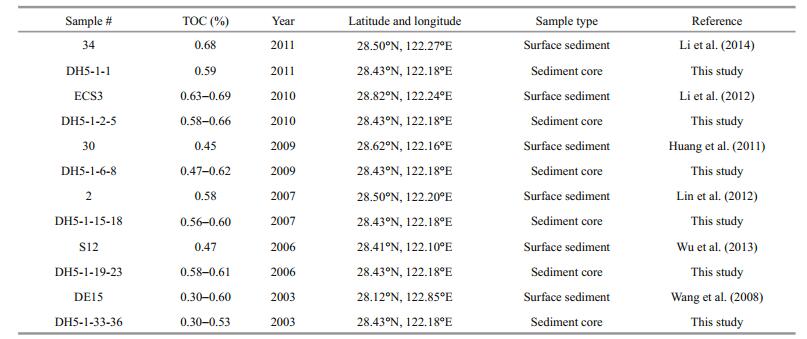
Based on the LOC and BC (Table S3), as well as the initial age a, we corrected TOCmea to obtain TOCcor (Tables 1 and S3). The quality of our TOCcor data may be evaluated in comparison with the TOC contents in surface sediments in the corresponding year. We collected previously reported TOC values in surface sediments near our study area to represent the initial TOC values in the sampling year. The comparative analysis suggests that our TOCcor data are consistent those of surface sediments near core DH5-1 (Table 2).
Sediments in coastal seas receive TOC from both land and sea. The C/N ratio and their stable carbon isotopic composition have been widely used as proxies for discriminating between a predominantly marine and terrestrial source for sedimentary TOC. However, the C/N ratios in sediments are easily impacted by alternative degradation of organic matter in early diagenesis, while the stable carbon isotopic composition of sedimentary TOC is more stable (Minoura et al., 1997; Gao et al., 2012). Therefore, the δ13C values of sedimentary TOC were employed to distinguish the proportion of terrestrial and marine TOC.
It is well known that sedimentary TOC derived from diff erent sources possesses diff erent carbon isotope compositions. Typical δ13C values of marine phytoplankton, terrestrial C3 plants, and terrestrial C4 plants range from -19‰ to -22‰, -26‰ to -28‰, and -10‰ to -17‰, respectively (Meyers, 1997; Farquhar et al., 2003). The δ13C value can thus be used to trace the provenance of organic carbon. In this study, a two end-member model (Minoura et al., 1997) was used to calculate the contribution of terrestrial (fter) and marine (fmar) TOC:
 (8)
(8) (9)
(9)Therefore,
 (10)
(10) (11)
(11)On the ECS inner shelf, a δ13C value of -19‰ was used for the marine TOC (δ13Cmar) end-member (Wu et al., 2003), and -25.5‰ was used for the terrestrial TOC (δ13Cter) end-member (Liu et al., 2007; Wu et al., 2007). The contributions of terrestrial and marine TOC were thus determined based on the δ13C mar and δ13C ter end-members and corrected δ13C values (Table S3; Fig. 5a and b). The results indicate that fter ranges from 31.08% to 80.27% (average 60.68%), while fmar fluctuates from 19.73% to 68.92% (average 39.32%). Subsequently, TOCter ranges from 0.11% to 0.35% (average 0.38%) and TOCmar varies between 0.10% and 0.49% (average 0.24%). This suggests that TOC sources in core DH5-1 are controlled by the terrestrial TOC input in general, which is probably derived from the especially large rivers, such as the Changjiang, Jiaojiang, and Qiangtangjiang. Furthermore, the results suggest that TOCter dominated the sedimentary TOC source before the 1990s, after which the predominant source shifted to TOCmar (Fig. 5a). Since 1931 AD, the fter decreased continuously while the fmar increased gradually, indicating that some factors influenced these parameters, causing the decline of terrestrial material input or an increase in marine productivity in the study area.

|
| Figure 5 Profiles of (a) fter and fmar, (b) TOCter, and TOCmar, and comparison with (c) records of annual discharge and sediment loads at the Datong hydrological station in the Changjiang River |
The TOCter exhibits a clear decreasing trend since the 1930s, while the TOCmar shows an increasing trend (Fig. 5b). Previous studies suggested that the sediment source of the ECS was mainly controlled by the Changjiang River (Xu, 1985; Yang et al., 2003). Even though several other rivers, such as the Qiantangjiang, Jiaojiang and Oujiang, flow into the ECS, they contribute limited sediments to the ECS because of their relatively small discharge and weak erosional action (Jin, 1992). Regression analysis shows that there is a significant positive correlation (R=0.79) between the TOCter and annual sediment load of the Changjiang River (Fig. 6a; Table S4), implying that the sedimentary TOC in core DH5-1 was mainly derived from the Changjiang River. There was no clear correlation between TOCter and annual discharge (R=0.07; Fig. 6b; Table S4). Additionally, there is only a weak correlation between TOCmar and annual sediment loads (R=0.29; Fig. 6c; Table S4), and no correlation with annual discharge (R=0.003; Fig. 6d; Table S4). In both the TOCter and TOCmar profiles, two n-shaped maxima are apparent from 1959 to 1969 AD and 1973 to 1977 AD (Fig. 5a and b), which are coeval with higher discharge and sediment loads (Fig. 5c). In contrast, two obvious v-shaped minima occur from 1985 to 1987 AD and 2003 to 2006 AD (Fig. 5a and b), which coincide with lower discharge and sediment loads (Fig. 5c).

|
| Figure 6 Correlation between (a) TOCter and Changjiang River annual sediment load, (b) TOCter and Changjiang River annual discharge, (c) TOCmar and annual sediment load, and (d) TOCmar and annual discharge |
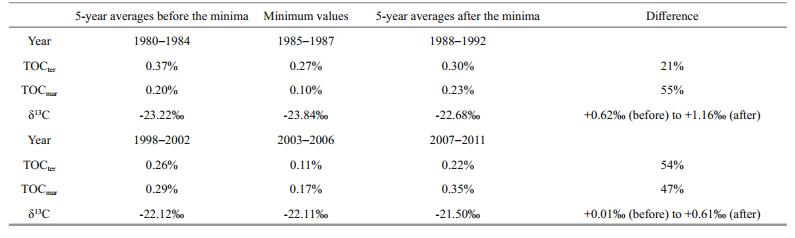
Two v-shaped minima in both TOCter and TOCmar profiles occur at 1985-1987 AD and 2003-2006 AD, which are coeval with the water impoundment of the GD and TGD, respectively. The Dajiang Reservoir, a main part of the GD, started to impound water and generate electricity from 1985 to 1987 AD and the TGD reservoir began to impound water from 2003 to 2006 AD (Zou et al., 2011). Thus, we conclude that the occurrence of the TOC minima temporally correspond to the water impoundment of the GD and TGD reservoirs.
Table 3 presents the 5-year averages of TOCter, TOCmar and δ13C before and after the two TOC minima. We found that the reduction is 21% for TOCter and 55% for TOCmar in 1985-1987 AD and 54% for TOCter, and 47% for TOCmar for 2003-2006 AD (Table 3; Fig. 4). After comprehensively analyzing the tempo-spatial connection between the TOC minima and water storage of the huge dams in the Changjiang River, we suggest that the minima, which have a duration of 3-4 years (Fig. 4), may be derived from the water impoundment of the GD and TGD reservoirs. This inference is strongly supported by previous studies. Gao et al. (2012) and Li et al. (2015a) suggested that the construction and impoundment of the two dams on the Changjiang River greatly altered sedimentary TOC accumulation in the ECS inner shelf by trapping land-derived TOC and nutrients within the reservoirs. Ran et al. (2009) suggested that the water impoundment of the TGD trapped up to 18.4% and 15.4% of N and P, respectively, and induced eutrophication within the reservoirs. Zhang et al. (2014) found that the TOC concentration in suspended material in the reservoirs was 1.14% before the impoundment in 2003, and 9.01% after the impoundment in 2008. Lin et al. (2007) and Yu et al. (2011) proposed that the decrease in TOC fl ux into the ECS was mainly originated from the retention of terrestrial sediments by the TGD reservoir. Li et al. (2011) calculated that about 50% of the annual sediment load was trapped by the TGD reservoir during 2003-2006 AD.
4.4 Ecological eff ects on the ECS inner shelf induced by water impoundment of the GD and TGDGenerally, the construction of a dam on the upper reaches of a large river can severely impact the downstream ecological environment, especially the coastal sea into which this river flows. In this case, the water impoundment of the GD and TGD reservoirs on the upper part of the Changjiang River produced two synchronous responses on the ECS inner shelf. One is the decline of freshwater discharge into the ECS, which accordingly led to a shoreward shift of the freshwater front and a seawater intrusion (Jiao et al., 2007). Simultaneously, the interaction zone between the freshwater and seawater fronts also moved closer to the coast (Gong et al., 2006; Jiao et al., 2007; Tsai et al., 2010). These abrupt changes altered the marine ecosystem, resulting in the death of marine organisms, particularly photosynthetic ones, and a decrease in sedimentary TOC accumulation on the inner shelf (Jiao et al., 2007). Additionally, there was a decrease in land-based nutrients reaching the inner shelf, which directly results in a drop in marine primary productivity (Gong et al., 2006).
Our δ13C data from sediment core DH5-1 (Fig. 4c) show an obvious negative shift relative to those before the water impoundment of the GD in 1985-1987 AD. Usually, a decline of land-derived sedimentary TOC causes a positive shift in δ13C in marine sediments, whereas a decrease in marine TOC produces a negative shift in δ13C. In this case, a negative shift in δ13C occurred in 1985-1987 AD, suggesting that the TOCmar decrease overcompensated for any positive shift caused by TOCter decline (Table 3; Figs. 4 and 5). Therefore, the water impoundment of the GD resulted in an abrupt shoreward movement of the seawater front, inducing a dramatic change in the inner shelf marine environment. This sudden change led to the death of marine organisms so that the evident decrease in sedimentary TOCmar was originated from biomass decline.
|
Previous studies indicated that the water capacity of the TGD reservoir is 24.9 times larger than the GD reservoir. In principle, the water impoundment of the TGD reservoir should also result in a negative shift of δ13C values. However, no negative shift is evident during 2003-2006 AD. After water impoundment of the GD reservoir and the subsequent die-off of marine biota, the remaining marine organisms in the seawater and freshwater interaction zone possessed stronger environmental adaptations to the new conditions of the inner shelf waters. When the water impoundment of the TGD reservoir occurred, the marine ecosystem damage was less, and the decrease in TOCmar nearly compensated for the positive shift caused by the TOCter decline (Table 3; Figs. 4 and 5). It should be noted that although the water impoundments may have serious ecological impacts on the ECS inner shelf in the short term, the ecosystem appeared to develop a strong self-remediation ability within ~3 yrs (GD reservoir) to 4 yrs (TGD reservoir).
The above deduction is supported by the following evidence. Jiao et al. (2007) reported that the water impoundment of the TGD in 2003 resulted in a significant decrease in the total bacterial abundance on the ECS inner shelf. Gong et al. (2006) found that primary production in the interaction zone decreased by 86% from 1998 to 2003 AD, and linked this to the construction of the TGD. Cao et al. (2006) stated that salinity in the lower reaches of the Changjiang River increased three times during the water impoundment of the TGD, mainly as a result of the shoreward seawater intrusion. Cai et al. (2007) reported that N/P and Si/P ratios after the water impoundment in 2003 were 40% and 6% higher, respectively, while the Si/N ratio was 26% lower in the Changjiang River estuary. Gong et al. (2006) reported that dinoflagellates had replaced diatoms as the dominant marine organism group after the water impoundment of the TGD in 2003 (Furuya et al., 2003).
5 CONCLUSIONCentury-scale high-resolution records of TOCcor, TOCter and TOCmar were obtained from sediment core DH5-1, collected from the inner shelf of the ECS. The TOC in core DH5-1 was significantly influenced by the Changjiang River water and sediment discharge. The presence of two TOC minima at 1985-1987 AD and 2003-2006 AD represents the depletion events that are closely related to the water impoundment of the GD and TGD reservoirs. They reflect the important synchronous responses of sedimentary TOC and ecological eff ects within the ECS inner shelf to impoundment events of the GD and TGD. Although the water impoundments had serious short-term consequences for marine organisms, the ecology of the shelf recovered in a relatively short time in the two dam systems (~3 yrs for the GD; 4 yrs for the TGD).
6 ACKNOWLEDGMENTWe are grateful to Mr. LI Kechang at the Guangzhou Institute of Geochemistry, Chinese Academy of Sciences, for performing the 210Pb dating experiment.
Electronic supplementary materialSupplementary material (Supplementary Tables S1–S4) is available in the online version of this article athttps://doi.org/10.1007/s00343-017-6216-0.
| Cai C, Yu Z M, Song X X, Sheng Z L, 2007. Characteristics of nutrient structures and limitation in the Yangtze River estuary before and after water storage of the Three Gorges project. Environmental Science, 28(1): 64–69. |
| Cao Y, Chen J Y, Zhang E F, Cheng S L, Chao W C, 2006. Influence of Three Gorge reservoir filled with water on freshwater resource in the Yangtze River estuary. Advances in Water Science, 17(4): 554–558. |
| Chen C S, Zhu J R, Beardsley R C, Franks P J S, 2003. Physical-biological sources for dense algal blooms near the Changjiang River. Geophysical Research Letters, 30(10): 1515. |
| Cheng C H, Lehmann J, Thies J E, Burton S D, Engelhard M H, 2006. Oxidation of black carbon by biotic and abiotic processes. Organic Geochemistry, 37(11): 1 477–1 488. Doi: 10.1016/j.orggeochem.2006.06.022 |
| Farquhar G D, Ehleringer J R, Hubick K T, 2003. Carbon isotope discrimination and photosynthesis. Annual Review of Plant Physiology and Plant Molecular Biology, 40(1): 503–537. |
| Furuya K, Hayashi M, Yabushita Y, Ishikawa A, 2003. Phytoplankton dynamics in the East China Sea in spring and summer as revealed by HPLC-derived pigment signatures. Deep Sea Research Ⅱ:Topical Studies in Oceanography, 50(2): 367–387. Doi: 10.1016/S0967-0645(02)00460-5 |
| Gao L, Li D J, Zhang Y W, 2012. Nutrients and particulate organic matter discharged by the Changjiang (Yangtze River):seasonal variations and temporal trends. Journal of Geophysical Research, 117(G4): G04001. |
| Gong G C, Chang J, Chiang K P, Hsiuing T M, Huang C C, Duan S W, Codispoti L A, 2006. Reduction of primary production and changing of nutrient ratio in the East China Sea:effect of the Three Gorges Dam?. Geophysical Research Letters, 33(7): L07610. |
| Guan B X, Mao H L, 1982. A note on circulation of the East China Sea. Chinese Journal of Oceanology and Limnology, 1(1): 5–16. Doi: 10.1007/BF02852887 |
| Gustafsson Ö, Bucheli T D, Kukulska Z, Andersson M, Largeau C, Rouzaud J N, Reddy C M, Eglinton T I, 2001. Evaluation of a protocol for the quantification of black carbon in sediments. Global Biogeochemical Cycles, 15(4): 881–890. Doi: 10.1029/2000GB001380 |
| Huang C C, Gong G C, Ko F C, Lee H J, Chen H Y, Wu J M, Hsu M L, Peng S C, Nan F H, Santchi P H, 2011. Polycyclic aromatic hydrocarbons in surface sediments of the East China Sea and their relationship with carbonaceous materials. Marine Pollution Bulletin, 63(5-12): 464–470. Doi: 10.1016/j.marpolbul.2011.03.001 |
| Janssen B H, 1984. A simple method for calculating decomposition and accumulation of 'young' soil organic matter. Plant and Soil, 76(1-3): 297–304. Doi: 10.1007/BF02205588 |
| Jia G D, Xu S D, Chen W F, Lei F, Bai Y, Huh C A, 2013. 100-year ecosystem history elucidated from inner shelf sediments off the Pearl River estuary, China. Marine Chemistry, 151: 47–55. Doi: 10.1016/j.marchem.2013.02.005 |
| Jiao N Z, Zhang Y, Zeng Y H, Gardner W D, Mishonov A V, Richardson M J, Hong N, Pan D L, Yan X H, Jo Y H, Chen C T A, Wang P X, Chen Y Y, Hong H S, Bai Y, Chen X H, Huang B Q, Deng H, Shi Y, Yang D C, 2007. Ecological anomalies in the East China Sea:impacts of the Three Gorges Dam?. Water Research, 41(6): 1 287–1 293. Doi: 10.1016/j.watres.2006.11.053 |
| Jin X L, 1992. Marine Geology of the East China Sea. Ocean Press, Beijing, Chinap.1-215. |
| Keeling C D, Bacastow R B, Carter A F, Piper S C, Whorf T P, Heimann M, Mook W G, Roeloffzen H. 2013. A threedimensional model of atmospheric CO2 transport based on observed winds: 1. Analysis of observational data. In: Peterson D H ed. Aspects of Climate Variability in the Pacific and the Western Americas. American Geophysical Union, Washington. p. 165-236. |
| Li D, Yao P, Bianchi T S, Zhang T T, Zhao B, Pan H H, Wang J P, Yu Z G, 2014. Organic carbon cycling in sediments of the Changjiang estuary and adjacent shelf:implication for the influence of Three Gorges Dam. Journal of Marine Systems, 139: 409–419. Doi: 10.1016/j.jmarsys.2014.08.009 |
| Li G G, Hu B Q, Bi J Q, Leng Q N, Xiao C Q, Yang Z C, 2013. Heavy metals distribution and contamination in surface sediments of the coastal Shandong Peninsula (Yellow Sea). Marine Pollution Bulletin, 76(1-2): 420–426. Doi: 10.1016/j.marpolbul.2013.08.032 |
| Li G, Wang X T, Yang Z F, Mao C P, West A J, Ji J F, 2015a. Dam-triggered organic carbon sequestration makes the Changjiang (Yangtze) river basin (China) a significant carbon sink. Journal of Geophysical Research:Biogeosciences, 120(1): 39–53. Doi: 10.1002/2014JG002646 |
| Li J L, Zhang B H, Hu X P, Wang Y M, Ding Y, Liu F, 2015b. Terrestrial input and nutrient change reflected by sediment records of the Changjiang River estuary in recent 80 years. Acta Oceanologica Sinica, 34(2): 27–35. Doi: 10.1007/s13131-015-0617-8 |
| Li Q F, Yu M X, Lu G B, Cai T, Bai X, Xia Z Q, 2011. Impacts of the Gezhouba and Three Gorges reservoirs on the sediment regime in the Yangtze River, China. Journal of Hydrology, 403(3-4): 224–233. Doi: 10.1016/j.jhydrol.2011.03.043 |
| Li X X, Bianchi T S, Allison M A, Chapman P, Mitra S, Zhang Z R, Yang G P, Yu Z G, 2012. Composition, abundance and age of total organic carbon in surface sediments from the inner shelf of the East China Sea. Marine Chemistry, 145-147: 37–52. Doi: 10.1016/j.marchem.2012.10.001 |
| Li Z Q, Wu Y, Liu S M, Du J Z, Zhang J, 2016. An 800-year record of terrestrial organic matter from the East China Sea shelf break:links to climate change and human activity in the Changjiang basin. Deep Sea Research Part Ⅱ:Topical Studies in Oceanography, 124: 64–73. Doi: 10.1016/j.dsr2.2015.01.006 |
| Lin J, Wu Y, Zhang J, Yang S, Zhu Z Y, 2007. Seasonal variation of organic carbon fluxes in the Yangtze River and influence of Three-Gorges engineering. China Environmental Science, 27(2): 246–249. |
| Lin T, Hu L M, Shi X F, Li Y Y, Guo Z G, Zhang G, 2012. Distribution and sources of organochlorine pesticides in sediments of the coastal East China Sea. Marine Pollution Bulletin, 64(8): 1 549–1 555. Doi: 10.1016/j.marpolbul.2012.05.021 |
| Liu K K, Kao S J, Hu H C, Chou W C, Hung G W, Tseng C M, 2007. Carbon isotopic composition of suspended and sinking particulate organic matter in the northern South China Sea-From production to deposition. Deep Sea Research Part Ⅱ:Topical Studies in Oceanography, 54(14-15): 1 504–1 527. Doi: 10.1016/j.dsr2.2007.05.010 |
| Liu S F, Shi X F, Liu Y G, Zhu A M, Yang G, 2009. Sedimentation rate of mud area in the East China Sea inner continental shelf. Marine Ceology & Quaternary Geology, 29(6): 1–7. |
| Meyers P A, 1997. Organic geochemical proxies of paleoceanographic, paleolimnologic, and paleoclimatic processes. Organic Geochemistry, 27(5-6): 213–250. Doi: 10.1016/S0146-6380(97)00049-1 |
| Middelburg J J, 1989. A simple rate model for organic matter decomposition in marine sediments. Geochimica et Cosmochimica Acta, 53(7): 1 577–1 581. Doi: 10.1016/0016-7037(89)90239-1 |
| Minoura K, Hoshino K, Nakamura T, Wada E, 1997. Late Pleistocene-Holocene paleoproductivity circulation in the Japan Sea:sea-level control on δ13C and δ15N records of sediment organic material. Palaeogeography, Palaeoclimatology, Palaeoecology, 135(1-4): 41–50. Doi: 10.1016/S0031-0182(97)00026-6 |
| Muller-Karger F E, Varela R, Thunell R, Luerssen R, Hu C M, Walsh J J, 2005. The importance of continental margins in the global carbon cycle. Geophysical Research Letters, 32(1): L01602. |
| Ran X B, Yao Q Z, Gong Y, Chen H T, Mi T Z, Liu P X, Yu Z G, 2009. Nutrient budget of Three Gorges Reservoir pre and post impoundment. Journal of Hydroecology, 2(2): 1–8. |
| Schelske C L, Hodell D A, 1995. Using carbon isotopes of bulk sedimentary organic matter to reconstruct the history of nutrient loading and eutrophication in Lake Erie. Limnology and Oceanography, 40(5): 918–929. Doi: 10.4319/lo.1995.40.5.0918 |
| Schmidt M W I, Noack A G, 2000. Black carbon in soils and sediments:analysis, distribution, implications, and current challenges. Global Biogeochemical Cycles, 14(3): 777–793. Doi: 10.1029/1999GB001208 |
| Shi X F, Liu S F, Qiao S Q, Liu Y G, Fang X S, Wu Y H, Zhu Z W, 2010. Depositional features and palaeoenvironmental records of the mud deposits in Min-Zhe coastal mud area, East China Sea. Marine Geology & Quaternary Geology, 30(4): 19–30. |
| Song J, Guo J R, Bao X W, Mu L, Li J, Liu Y L, 2016. Study of the water exchange between the Kuroshi and the East China Sea. Marine Science Bulletin, 35(2): 178–186. |
| Suess E, 1980. Particulate organic carbon flux in the oceanssurface productivity and oxygen utilization. Nature, 288(5788): 260–263. Doi: 10.1038/288260a0 |
| Tesi T, Miserocchi S, Goñi M A, Langone L, Boldrin A, Turchetto M, 2007. Organic matter origin and distribution in suspended particulate materials and surficial sediments from the western Adriatic Sea (Italy). Estuarine, Coastal and Shelf Science, 73(3-4): 431–446. Doi: 10.1016/j.ecss.2007.02.008 |
| Tsai A Y, Gong G C, Sander R W, Wang C J, Chiang K P, 2010. The impact of the Changjiang River plume extension on the nanoflagellate community in the East China Sea. Estuarine, Coastal and Shelf Science, 89(1): 21–30. Doi: 10.1016/j.ecss.2010.05.005 |
| Wang X C, Sun M Y, Li A C, 2008. Contrasting chemical and isotopic compositions of organic matter in Changjiang(Yangtze River) estuarine and East China Sea shelf sediments. Journal of Oceanography, 64(2): 311–321. Doi: 10.1007/s10872-008-0025-1 |
| Wu Y, Eglinton T, Yang L Y, Deng B, Montluçon D, Zhang J, 2013. Spatial variability in the abundance, composition, and age of organic matter in surficial sediments of the East China Sea. Journal of Geophysical Research:Biogeosciences, 118(4): 1 495–1 507. Doi: 10.1002/2013JG002286 |
| Wu Y, Zhang J, Li D J, Wei H, Lu R X, 2003. Isotope variability of particulate organic matter at the PN section in the East China Sea. Biogeochemistry, 65(1): 31–49. Doi: 10.1023/A:1026044324643 |
| Wu Y, Zhang J, Liu S M, Zhang Z F, Yao Q Z, Hong G H, Cooper L, 2007. Sources and distribution of carbon within the Yangtze River system. Estuarine, Coastal and Shelf Science, 71(1-2): 13–25. Doi: 10.1016/j.ecss.2006.08.016 |
| Xu D Y, 1985. Mud sedimentation on the East China Sea continental shelf. Marine Geology & Quaternary Geology, 5(2): 17–26. |
| Xu X M, Hong Y H, Zhou Q Z, Liu J Z, Yuan L R, Wang J H, 2018a. Century-scale high-resolution black carbon records in the sediment cores from the South Yellow Sea, China. Journal of Oceanology and Limnology, 36(1): 115–127. Doi: 10.1007/s00343-017-6214-2 |
| Xu X M, Zhu Q, Zhou Q Z, Liu J Z, Yuan J P, Wang J H, 2018b. An improved method to quantitatively measure the sequences of total organic carbon and black carbon in marine sediment cores. Journal of Oceanology and Limnology, 36(1): 105–114. Doi: 10.1007/s00343-017-6229-8 |
| Yang G P, Wang W L, Lu X L, Ren C Y, 2010. Distribution, flux and biological consumption of carbon monoxide in the southern Yellow Sea and the East China Sea. Marine Chemistry, 122(1-4): 74–82. Doi: 10.1016/j.marchem.2010.08.001 |
| Yang S Y, Jung H S, Lim D I, Li C X, 2003. A review on the provenance discrimination of sediments in the Yellow Sea. Earth-Science Reviews, 63(1-2): 93–120. Doi: 10.1016/S0012-8252(03)00033-3 |
| Yu H, Wu Y, Zhang J, Deng B, Zhu B, 2011. Impact of extreme drought and the Three Gorges Dam on transport of particulate terrestrial organic carbon in the Changjiang(Yangtze) River. Journal of Geophysical Research, 116(F4): F04029. |
| Zhang Y L, Kaiser K, Li L, Zhang D N, Ran Y, Benner R, 2014. Sources, distributions, and early diagenesis of sedimentary organic matter in the Pearl River region of the South China Sea. Marine Chemistry, 158: 39–48. Doi: 10.1016/j.marchem.2013.11.003 |
| Zhu C, Wang Z H, Xue B, Yu P S, Pan J M, Wagner T, Pancost R D, 2011. Characterizing the depositional settings for sedimentary organic matter distributions in the lower Yangtze River-East China Sea Shelf System. Estuarine, Coastal and Shelf Science, 93(3): 182–191. Doi: 10.1016/j.ecss.2010.08.001 |
| Zhu Z Y, Wu Y, Zhang J, Du J Z, Zhang G S, 2014. Reconstruction of anthropogenic eutrophication in the region off the Changjiang estuary and central Yellow Sea:from decades to centuries. Continental Shelf Research, 72: 152–162. Doi: 10.1016/j.csr.2013.10.018 |
| Zhu Z Y, Zhang J, Wu Y, Lin J, 2006. Bulk particulate organic carbon in the East China Sea:tidal influence and bottom transport. Progress in Oceanography, 69(1): 37–60. Doi: 10.1016/j.pocean.2006.02.014 |
| Zou Z H, Lu G B, Li Q F, Xia Z Q, Bing J P, 2011. Water temperature change caused by large-scale water projects on the Yangtze River mainstream. Journal of Hydroelectric Engineering, 30(5): 139–144. |