 2018, Vol. 36
Institute of Oceanology, Chinese Academy of Sciences
Article Information
- TANG Baojun(唐保军), Hans Ulrik RIISGÅRD
- Relationship between oxygen concentration, respiration and filtration rate in blue mussel Mytilus edulis
- Chinese Journal of Oceanology and Limnology, 36(2): 395-404
- http://dx.doi.org/10.1007/s00343-018-6244-4
Article History
- Received Oct. 14, 2016
- accepted in principle Dec. 8, 2016
- accepted for publication Feb. 7, 2017


2 East China Sea Fisheries Research Institute, Chinese Academy of Fishery Sciences, Shanghai 200090, China
In Mytilus edulis, the filter-feeding blue mussel, the big W-shaped gills are much larger than needed for oxygen uptake (respiration), because the gills have evolved from an original primary function as pure respiratory structures to simultaneous feeding structures with a many-fold increase in ventilation (Jørgensen, 1966, 1990; Famme and Kofoed, 1980; Jørgensen et al., 1986; Gosling, 2015; Riisgård and Larsen, 2015).
The effects of declining dissolved oxygen concentration on respiration rate have been studied in several species of filter-feeding bivalves, because such studies reveal the mechanisms that control oxygen uptake (Taylor and Brand, 1975, Famme and Kofoed, 1980; Jørgensen et al., 1986; Soral and Widdows, 1997; Jansen et al., 2009; Artigaud et al., 2014; Sanders et al., 2014). The oxygen consumption rate in filter-feeding bivalves has been found to be more or less constant (i.e. independent) during exposure to a wide range of oxygen concentrations. It has thus been suggested that these bivalves regulate oxygen uptake ("oxyregulators"), while the oxygen uptake rapidly declines with the ambient oxygen concentration ("oxyconformers") below a certain critical oxygen concentration, e.g. Grieshaber et al. (1994), Jansen et al. (2009), Artigaud et al. (2014). However, the importance of the ventilation rate (filtration rate) for oxygen consumption has been studied by Jørgensen et al. (1986) in the blue mussel, via a screw that enables to passively control the opening degree of the valves. The study reports that the relationship between ventilation and oxygen consumption can be interpreted in terms of resistance to the diffusion of oxygen. Thus, according to Jørgensen et al. (1986), uptake of oxygen takes place via diffusion across the boundary layer at the interphase and within the tissues of the body. At a high filtration rate (=ventilation rate) the boundary layer is thin, but at reduced filtration rates the boundary layer becomes thick, resulting in reduced oxygen uptake (Jørgensen et al., 1986).
Due to the large gills, which are over-dimensioned for purely respiratory purposes, it can be expected that the oxygen uptake may be rather unaffected by the filtration rate until it falls below a specific filtration rate where the boundary layer rapidly begins to increase in thickness, resulting in reduced respiration. On this background it can be hypothesized that the respiration rate of fully opened and maximally filtering M. edulis would be relatively insensitive to decreasing ambient oxygen concentrations. In the present study, this hypothesis has been tested via measurements of the oxygen uptake in mussels at various initial oxygen concentrations established via N2-bubbling of the ambient water in a respiration chamber with constantly algae-fed mussels to stimulate the mussels to fully open their valves and exploit their filtration rate capacity.
2 MATERIAL AND METHOD 2.1 Collection of experimental animalsBlue mussels, M. edulis were collected at the inlet of Kerteminde Fjord, Denmark, in December 2014 and were kept in running seawater from the collecting site at the nearby Marine Biological Research Centre until the experiments were performed over the course of the following weeks. Mussels with very similar shell length (L) were selected and divided into two groups for the experiments (Group #1: n=20, L=63.5±6.1 mm; Group #2: n=20, L=66.8±4.1 mm).
2.2 Experimental set-upThe experimental design allowed near simultaneous measurements of the filtration-and respiration rates of a group of mussels placed in a closed experimental chamber with bio-filtered seawater (V=14.2 L). Algal cells were added and initial oxygen concentrations of 9 (saturation), 6, 3, 2, 1, and 0 mg O2/L, respectively, were obtained via N2-bubbling of the seawater. The experimental chamber was a cylindrical plexiglas tube (diameter=28.5 cm, cm) enclosed at both ends, except for a smaller hole (diameter=12.5 cm) at the top, which could be closed with a lid, resulting in an airtight chamber. The chamber was submerged in a temperature-controlled water bath (13.5±0.6℃) placed on a big magnetic stirrer, which rotated an 8-cm long magnetic bar, thus ensuring a strong mixing of the seawater within the experimental chamber. Rotating magnet and mussels were kept apart by placing the mussels close to the outer wall, while the magnet was kept at the center of the chamber. The oxygen concentration in the chamber was measured via three Redflash sensor spots fixed on the chamber wall 5, 12, and 18 cm above the bottom. When the oxygen concentration had been reduced to the required level, the mussels were fed algal cells (Rhodomonas salina) by addition of an initial concentration of about 5 000 cells/mL in order to measure the filtration rate of fully opened mussels as the water volume of water cleared of suspended algal cells per unit of time elapsed. At each oxygen level, the filtration rate was measured for three times by adding new algal cells to re-establish the initial concentration (5 000 cells/mL). Subsequently, after filtration rate measurements were completed, the chamber was sealed and the respiration rate of the mussels was measured during the following 60 min. The shell-opening degree of the mussels was observed and noted during all filtration and respiration measurements. After each measurement, the oxygen concentration in the chamber was gradually increased to saturation level in 2 h by air bubbling.
In order to determine the critical oxygen concentration below which M. edulis begins to close its valves, a group of five mussels were initially exposed to 1 mg O2/L for 2 h (salinity of 20, and 18.2±0.5℃) before the concentration was increased to 5 mg O2/L in 20 min, and subsequently decreased to 1 mg O2/L in 20 min. The filtration rate was simultaneously measured along with the recording of the valve-opening degree of the mussels via a digital camera (Olympus μTough-8010).
2.3 Measurement of filtration rateThe filtration rate of a group of mussels placed in the experimental chamber was measured using the clearance method. Here, the filtration rate is measured as the volume of water cleared of suspended particles that are 100% efficiently retained by the gills per unit of time. The reduction in the number of particles as a function of time was followed by taking water samples at fixed time intervals (every 5 or 10 min) from the experimental chamber with well-mixed seawater to which about 6 μm diameter algal cells (R. salina) were added. The particle concentration was measured with an electronic particle counter (Elzone 5380). The filtration rate (F) was determined from the exponential decrease in algal concentration (verified as a straight line in a semi-ln plot) as a function of time using the formula (Riisgård et al., 2011):
 (1)
(1)where V=volume of seawater in the experimental chamber, n=number of mussels, and b=slope of regression line in a semi-ln plot for the reduction in algal concentration with time.
2.4 Measurement of respiration rateThe respiration rate of M. edulis was measured as the consumption of oxygen with a fibre-optic oxygen meter (FireSting O2, Pyro Science GmbH, Aachen, Germany) for the measurement of the dissolved oxygen concentration in a closed respiration chamber. A fibre-optic oxygen meter, using "redflash" technology, was connected via a USB-cable to a computer with Pyro Oxygen Logger software installed. Redflash indicators that were excited with red light (620 nm) show luminescence in the near infrared, which decreases with increasing oxygen concentration. The analogous signal is transported via fibre-optical cable, resulting in a digital readout within the software package and interpreted as oxygen concentration. For oxygen sensing, three channels were used, while an external temperature sensor was running. Prior to respiration measurements a two-point calibration (100% oxygen saturation and full oxygen depletion to 0% via N2-bubbling) was conducted. The optical fibre was placed at the wall of the respiration chamber above a redflash spot and the oxygen concentration (mg O2/L) was recorded every 1 or 5 min via Pyro Oxygen Logger software. The oxygen concentration was plotted as a function of time, and a linear regression line was added. The respiration rate (R, mg O2/min) was calculated as:
 (2)
(2)where b=slope of the regression line, V=water volume in respiration chamber, and n=number of mussels. Due to strong mixing of the water in the chamber the three oxygen-sensing channels showed almost identical reduction rates (i.e. similar regression lines).
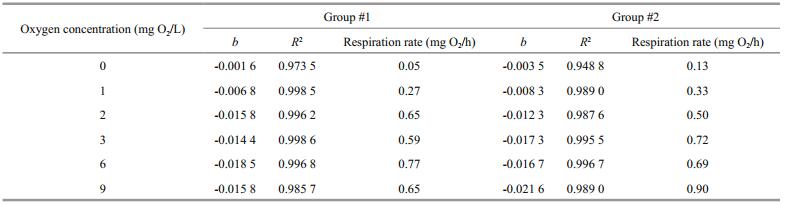
The respiration rate of M. edulis in air-saturated seawater that was measured in the present study is in agreement with the value estimated via the equations: W (g)=3.48×10⁻⁶L(mm)3.08 (Riisgård et al., 2014) and R (μL O2/h)=475W(g)0.663 (Hamburger et al., 1983), where W=dry weight of soft parts, and L=shell length. Thus, the mean individual respiration rate of the mussels of group #2 (exposed to 9 mg O2/L) was measured as 0.9 mg O2/h (Table 1), which can be compared with the estimated (using the above equations for a 66.8-mm mussel) value of 0.87 mg O2/h.
The flagellate R. salina (about 6 μm in diameter) was cultured phototrophically in repeated batch cultures at 20℃ in 5 L bottles containing 3 L seawater (salinity of 20), enriched with f/2-medium. Cultures were continuously illuminated by fluorescent light tubes. Aeration and mixing were carried out via compressed air injection. Every day 1 L of algal suspension was withdrawn and replaced by fresh medium.
2.6 Statistical analysisLinear models (LM) were fit in R (R Core Team, 2015) to investigate differences in filtration and respiration rates at oxygen concentrations > 2 mg O2/L.
3 RESULTThe first series of measurements of M. edulis respiration and filtration rate (group #1) at different initial oxygen concentrations are shown in Fig. 1 and Table 2. Figure 1a shows the decreasing oxygen concentration in the respiration chamber at different initial oxygen concentration levels, while Fig. 1b shows the estimated individual respiration rates of the mussels. The measurements were taken in the following sequence of varying oxygen concentrations: 6, 3, 2, 1, 0, and finally 9 mg O2/L. Figure 1c shows a semi-ln plot of algal concentrations as a function of time in filtration rate experiments, retaining the same mussels and exposing them to various oxygen concentrations. Figure 1d shows the subsequently estimated individual filtration rates as a function of initial oxygen concentration. Inserted numbers in Fig. 1b and d show the sequence of measurements, made at one-day intervals (No. 1 to 5) and 40 d after 10 h exposure of the mussels to 0 mg O2/L (No. 6). The inserted regression lines in Fig. 1b and d are based on respiration and filtration rates measured in the oxygen-concentration interval of 2 to 9 mg O2/L, revealing only a slight tendency of a decreasing effect of oxygen concentration. However, at 1 and 0 mg O2/L, a pronounced decrease in both respiration and filtration rate was observed, and simultaneous observation of the shell-opening degree revealed that the mussels increasingly closed their shells (Fig. 6). Furthermore, when those mussels that had been exposed to 0 mg O2/L were subsequently exposed to 9 mg O2/L, they re-opened their shells, and normal respiration rate was resumed. However, their filtration rate remained low for nearly 20 days, slowly increasing to a (near) normal rate 40 d later (Fig. 2). Due to these results, a second series of measurements was performed with a new group of M. edulis (group #2), this time with just the stepwise sequence from 9 to 0 mg O2/L (Fig. 3 and Table 2).

|
| Figure 1 M. edulis(group #1) a. decrease in initial oxygen concentration in the respiration chamber; b. individual respiration rate (R) measured at various initial oxygen concentration levels; c. semi-ln plot of algal concentration (C, cells/mL) as a function of time in filtration rate experiments that use the same mussels, but exposed to various ambient oxygen concentrations; d. individual filtration rate (F) as a function of oxygen concentration. The inserted numbers in b and d show the sequence of measurements made with one-day intervals (No. 1 to 5), as well as after 40 d recovery (No. 6) following a 12 h exposure of the mussels to 0 mg O2/L (see Fig. 2). The regression lines shown in figures b and d are based on data obtained in the oxygen-concentration interval of 2 to 9 mg O2/L. |

|
| Figure 6 Valve opening degree of mussels fed algal cells and following exposure to different oxygen concentrations The photos were taken 30 min after the oxygen concentration was reduced to the indicated level. |

|
| Figure 2 M. edulis (group #1) Filtration rate of mussels measured following a 10 h exposure to 0 mg O2/L. |

|
| Figure 3 M. edulis(group #2) a. decrease in initial oxygen concentration in the respiration chamber; b. individual respiration rate (R) measured at various initial oxygen concentration levels ranging between 9 and 0 mg O2/L; c. semi-ln plot of algal concentration (C, cells/mL) as a function of time during filtration rate experiments with identical mussels that wre exposed to various ambient oxygen concentrations; d. individual filtration rate (F) as a function of oxygen concentration. Inserted numerals in Fig.b and d mark the sequence of measurements made with one-day intervals (No. 1 to 6). The regression lines shown in figures b and d are based on data obtained in the oxygen-concentration interval of 2 to 9 mg O2/L. |
Figure 3 confirms the measurements shown in Fig. 1, with the only exception that no measurements were made after exposure of the mussels to 0 mg O2/L. Judging from the regression line in Fig. 3b a slight decrease in respiration rate appears to be caused by an associated decrease in oxygen concentration (from 9 to 2 mg O2/L), after which the respiration rate decreased rapidly, in combination with shell closure and cessation of filtration activity. Statistical tests revealed that the slope of regression lines shown in Figs. 1 and 3 are not significantly different from zero, except for Fig. 3b. Furthermore, the respiration rates of both groups of mussels significantly increased with increasing oxygen concentrations > 2 mg O2/L (Fig. 4; LM, t=3.19, P=5.9×10⁻¹²). According to the regression equation in Fig. 3, a decrease of in oxygen concentration from 9 to 2 mg O2/L (or 78 %), resulting in only a 25 % decrease in respiration rate.

|
| Figure 4 Mean individual respiration rate (R) in two groups of mussels at various initial oxygen concentrations The depicted regression line shown is based on data obtained in the oxygen-concentration interval of 2 to 9 mg O2/L, while the mussels were fully opened, in contrast to an increasing degree of valve closure below 2 mg O2/L. |
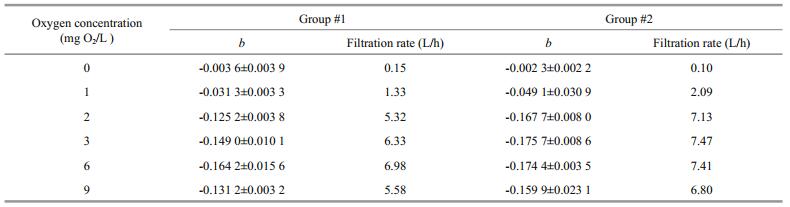
The valves of the mussels had fully opened during the filtration rate measurements performed at oxygen-concentration levels of 9, 6 and 3 mg O2/L and thus, the filtration rates were almost identical (Fig. 5). However, when the oxygen concentration was further reduced to 2 mg O2/L the mussels began to close, decreasing their mean individual filtration rate from 7.8 to 4.9 L/h within 30 min (Fig. 5). The valve-opening degree further decreased at 1 mg O2/L, and three of the mussels completely closed their valves following a 1-h exposure to 0 mg O2/L (Fig. 6). Subsequently, as the oxygen concentration was increased to 5 mg O2/L, the mussels gradually opened their valves to full opening after 20 min. As the oxygen concentration decreased to 1 mg O2/L again during the next 20 min, the mussels once again closed or reduced their valve-opening degree (Fig. 7).

|
| Figure 5 Mean individual filtration rates (F) of a group of five mussels measured three times successively following exposure to different oxygen levels 0-30 min (○), 40-70 min (×), and 80-110 min (■). |

|
| Figure 7 Shell-valve opening of the mussels during a period when the oxygen concentration increased from 1 to 5 mg O2/L within 20 min, followed by a decreased to 1 mg O2/L in 20 min |
The present study supports the hypothesis that the respiration rate of fully opened and maximally filtering M. edulis is relatively insensitive to decreasing ambient oxygen concentrations. This is due to the over-dimensioning of the filter-feeding gills, which is in agreement with the suggestion that the oxygen uptake is solely determined by the passive oxygen diffusion rate of the water flowing across the gill epithelium as well as other outer body surfaces. Thus exposure of mussels to decreasing oxygen concentrations from 9 to 2 mg O2/L is only accompanied by a slow, yet significant reduction in respiration rate (Fig. 4), while the filtration rate remains high and constant (Fig. 1d and Fig. 3d). However, at oxygen concentrations < 2 mg O2/L M. edulis responds by gradually closing the shells, resulting in a rapidly decreasing filtration rate and concurrent reduction of the respiration rate (Figs. 4 and 5). These observations support the hypothesis that M. edulis is able to save energy during starvation periods by reducing its shell-opening degree whereby the filtration rate (ventilation rate) and thus the respiration rate become strongly reduced (Riisgård and Larsen, 2015).
The presented relationships between oxygen concentration and oxygen uptake in fully opened mussels are consistent with the findings of Fame and Kofoed (1980) and Jørgensen et al. (1986), which indicate that the oxygen uptake in M. edulis is controlled by the diffusion rate of oxygen, which decreases with decreasing oxygen concentration of the ambient water. Jansen et al. (2009) measured respiration rates of M. galloprovincialis as a function of oxygen concentration in respiration chambers with filtered water, but without addition of algal cells. Therefore, the mussels have probably not fully opened and ventilated maximally above the critical oxygen concentration, below which incipient valve closure was observed in the present study. However, the general patterns of an initially slowly decreasing respiration rate with decreasing oxygen concentration observed by Jansen et al. (2009, Fig. 2 therein) are comparable with the present study. Similarly, the pattern of respiration versus oxygen concentration recently reported for Mytilus spp. by Artigaud et al. (2014) is comparable to the present findings (Fig. 4). This includes a rapid decrease in respiration below a critical oxygen concentration, designated the "breakpoint" by Artigaud et al. (2014), and observed to correlate with incipient valve-closure in the present study.
The present observation that the filtration rate of M. edulis is independent of variations in oxygen concentrations above 2.0 mg O2/L (Figs. 1d, 3d, 5) is in agreement with Fame and Kofoed (1980) who reported the ventilation rate of M. edulis to be constant for an oxygen tension above 40 to 50 mm Hg, and likewise, Bayne (1971a) reported that ventilation rates of M. edulis were relatively constant during declining oxygen tensions down to about 70 mm Hg, below which the filtration rate rapidly decreased. Several studies have suggested hypoxia to induce a physiological compensatory mechanism in invertebrates, including an increase in water ventilation, which aids to maintain a high and constant oxygen consumption rate during moderate hypoxia (Bayne, 1971b; Herreid Ⅱ, 1980; Brand and Morris, 1984; Grieshaber et al., 1994; Artigaud et al., 2014). However, no sign of such physiological compensations (i.e. increased filtration rate) in M. edulis were observed during the present study for oxygen concentrations above 2.0 mg O2/L. This, along with the valve-closing response observed below this value, hampers the description of M. edulis as a "poor to moderate oxyconformer" with the ability to switch to "oxyconformity" below a certain oxygen concentration "breakpoint", cf. Artigaud et al. (2014). As oxygen concentration was reduced below 2 mg O2/L in the present study, M. edulis responded to the resulting and steadily increasing hypoxia by closing its valve-opening degree, thus strongly reducing the filtration and respiration rate (Figs. 1b, d, 3b, d, 5, and 6). Similarly, Wang and Widdows (1993) found the filtering activity of juvenile and adult M. edulis to decline with decreasing oxygen concentration, and a significant anaerobic component occurred at oxygen level below 1 kPa for mussels ranging in size from 5 to 33 m. As pointed by Pörtner and Farrell (2008), when organisms are transferred from moderate to extreme stress conditions, anaerobic metabolism will be triggered at a critical threshold value for the given stressor, which result in a much lower production rate of ATP (de Zwaan et al., 1991; Sokolova et al., 2012). The sharp decline of respiration rate suggested that 2 mg O2/L might be the oxygen concentration level inducing anaerobic metabolism in mussels. Moreover, it seems to be a common energy-saving mechanism in bivalve molluscs to strongly reduce their activity when exposed to low oxygen conditions (Shumway et al., 1983; Widdows and Shick, 1985; Sobral and Widdows, 1997). Valve closure of M. edulis results in an immediate reduction of oxygen consumption rate (Famme, 1980), and with partial valve-closure, effective irrigation of the mantle cavity reduces, thus increasing the thickness of the diffusive boundary layer. This leads to a steep decrease in oxygen uptake with decreasing ventilation (Jørgensen et al., 1986). The presented observations of a relationship between respiration and oxygen concentration, and the valve-closure phenomenon at low to very low oxygen concentrations should be interpreted within this context.
Although many bivalves can endure hypoxic conditions, using glycogen in anaerobic metabolic pathways (Grieshaber et al., 1994), hypoxia and anoxia may nevertheless result in harmful effects. Shumway et al. (1983) reported that LT50 values of clam Mulinia lateralis ranged from 2 to 11 d following exposure to anoxia. Under severe hypoxia, all juvenile surf clam Donax serra died within 7 d (Laudien et al., 2002). When M. edulis was exposed to 0 mg O2/L in the present study the valves still remained slightly open, but the filtration rate was close to zero. Subsequent transfer to air-saturated water, resulted in a very slow recovery of the filtration rate (Fig. 2), suggesting damage to the feeding organs during the 10 h of exposure to 0 mg O2/L. Bayne (1971a) reported that the recovery of the M. edulis ventilation rate did not differ from rates recorded during the decline of oxygen tension. However, in this case the mussels were exposed for only 2 h to an oxygen tension of about 20 mm Hg rather than anoxia. In most habitats, animals do not experience a complete lack of oxygen, but are rather exposed to hypoxic conditions (Grieshaber et al., 1994). Although mussels can endure long-term hypoxia, they can only survive short term exposure to anoxia. The observed reduction in filtration rate after prolonged exposure to 2 mg O2/L (Fig. 5) as well as the observed acute valve-opening response to varying oxygen concentrations (Fig. 7) suggest that an approximate concentration of 2 mg O2/L is the critical. Below this concentration M. edulis is no longer able to maintain its normal aerobic metabolism.
5 CONCLUSIONThe filtration rate of M. edulis is independent of variations in oxygen concentrations above 2.0 mg O2/L. From 9 to 2 mg O2/L, the decrease of oxygen concentration only caused a slow and slight reduction in respiration rate. However, at oxygen concentrations below 2 mg O2/L, both the respiration and filtration rate decreased rapidly, and simultaneously, the mussels increasingly closed their shells. As the mussels that had been exposed to 0 mg O2/L were subsequently exposed to oxygen concentration above 2 mg O2/L, they re-opened their shells, and normal respiration rate was resumed. Long-term (more than 10 h) anoxia stress might damage the feeding organs of M. edulis. Out study indicated that below 2 mg O2/L M. edulis is no longer able to maintain its normal aerobic metabolism, and there seems to be an energy-saving mechanism in bivalve molluscs to strongly reduce their activity when exposed to low oxygen conditions. In further study, measurement of anaerobic end products could contribute to determining the threshold of oxygen concentration that triggers the anaerobic metabolism in M. edulis,
6 ACKNOWLEDGEMENTThanks are due to Josephine Goldstein for help with the statistical tests, and to Katerina Charitonidou for technical assistance.
| Artigaud S, Lacroix C, Pichereau V, Flye-Sainte-Marie J, 2014. Respiratory response to combined heat and hypoxia in the marine bivalves Pecten maximus and Mytilus spp. Comp. Biochem. Physiol. A, 175: 135–140. Doi: 10.1016/j.cbpa.2014.06.005 |
| Bayne B L, 1971a. Ventilation, the heart beat and oxygen uptake by Mytilus edulis L. in declining oxygen tension. Comp. Biochem. Physiol. A, 40(4): 1065–1085. Doi: 10.1016/0300-9629(71)90295-7 |
| Bayne B L, 1971b. Oxygen consumption by three species of lamellibranch mollusc in declining ambient oxygen tension. Comp. Biochem. Physiol. A, 40(4): 955–970. Doi: 10.1016/0300-9629(71)90284-2 |
| Brand A R, Morris D J, 1984. The respiratory responses of the dog cockle Glycymeris glycymeris (L.) to declining environmental oxygen tension. J. Exp. Mar. Biol. Ecol., 83(1): 89–106. Doi: 10.1016/0022-0981(84)90119-9 |
| de Zwaan A, Cortesi P, van den Thillart G, Roos J, Storey K B, 1991. Differential sensitivities to hypoxia by two anoxiatolerant marine molluscs:a biochemical analysis. Mar.Biol., 111(3): 343–351. Doi: 10.1007/BF01319405 |
| Famme P, Kofoed L H, 1980. The ventilatory current and ctenidial function related to oxygen uptake in declining oxygen tension by the mussel Mytilus edulis L. Comp. Biochem. Physiol. A, 66(2): 161–171. Doi: 10.1016/0300-9629(80)90147-4 |
| Famme P, 1980. Effect of shell valve closure by the mussel Mytilus edulis L. on the rate of oxygen consumption in declining oxygen tension. Comp. Biochem. Physiol. A, 67(1): 167–170. Doi: 10.1016/0300-9629(80)90423-5 |
| Gosling E, 2015. Marine Bivalve Molluscs. WileyBlackwell, Hoboken. |
| Grieshaber M K, Hardewig I, Kreutzer U, Pörtner H O. 1994. Physiological and metabolic responses to hypoxia in invertebrates. In: Bock K W ed. Aryl Hydrocarbon or Dioxin Receptor: Biologic and Toxic Responses. Springer, Berlin Heidelberg, Germany. p. 43-147. |
| Hamburger K, Møhlenberg F, Randløv A, Riisgård H U, 1983. Size, oxygen consumption and growth in the mussel Mytilus edulis. Mar. Biol., 75(2-3): 303–306. Doi: 10.1007/BF00406016 |
| Herreid Ⅱ C F, 1980. Hypoxia in invertebrates. Comp.Biochem. Physiol. A, 67(3): 311–320. Doi: 10.1016/S0300-9629(80)80002-8 |
| Jansen J M, Hummel H, Bonga S W, 2009. The respiratory capacity of marine mussels (Mytilus galloprovincialis) in relation to the high temperature threshold. Comp.Biochem. Physiol. A, 153(4): 399–402. Doi: 10.1016/j.cbpa.2009.03.013 |
| Jørgensen C B, Møhlenberg F, Sten-Knudsen O, 1986. Nature of relation between ventilation and oxygen consumption in filter feeders. Mar. Ecol. Prog. Ser., 29: 73–88. Doi: 10.3354/meps029073 |
| Jørgensen C B, 1966. Biology of Suspension Feeding. Pergamon Press, Oxford, UK. |
| Jørgensen C B. 1990. Bivalve Filter Feeding: Hydrodynamics, Bioenergetics, Physiology and Ecology. Olsen & Olsen, Fredensborg, Denmark. |
| Laudien J, Schiedek D, Brey T, Pörtner H O, Arntz W E, 2002. Survivorship of juvenile surf clams Donax serra (Bivalvia, Donacidae) exposed to severe hypoxia and hydrogen sulphide. J. Exp. Mar. Biol. Ecol., 271(1): 9–23. Doi: 10.1016/S0022-0981(02)00030-8 |
| Pörtner H O, Farrell A P, 2008. Physiology and climate change. Science, 322(5902): 690–692. Doi: 10.1126/science.1163156 |
| R Development Core Team. 2015. A language and environment for statistical computing. R Foundation for Statistical Computing, Vienna, Austria, http://www.R-project.org/. |
| Riisgård H U, Egede P P, Saavedra I B, 2011. Feeding behaviour of mussels, Mytilus edulis, with a mini-review of current knowledge. J. Mar. Biol.. Doi: 10.1155/2011/312459 |
| Riisgård H U, Larsen P S, Pleissner D, 2014. Allometric equations for maximum filtration rate in blue mussels Mytilus edulis and importance of condition index. Helgoland Mar. Res., 68(1): 193–198. Doi: 10.1007/s10152-013-0377-9 |
| Riisgård H U, Larsen P S, 2015. Physiologically regulated valve-closure makes mussels long-term starvation survivors:test of hypothesis. J. Molluscan Stud., 81(2): 303–307. Doi: 10.1093/mollus/eyu087 |
| Sanders T, Widdicombe S, Calder-Potts R, Spicer J I, 2014. Environmental hypoxia but not minor shell damage affects scope for growth and body condition in the blue mussel Mytilus edulis (L.). Mar. Environ. Res., 95: 74–80. Doi: 10.1016/j.marenvres.2013.12.013 |
| Shumway S E, Scott T M, Shick J M, 1983. The effects of anoxia and hydrogen sulphide on survival, activity and metabolic rate in the coot clam, Mulinia lateralis (Say). J.Exp. Mar. Biol. Ecol., 71(2): 135–146. Doi: 10.1016/0022-0981(93)90069-Z |
| Sobral P, Widdows J, 1997. Influence of hypoxia and anoxia on the physiological responses of the clam Ruditapes decussatus from southern Portugal. Mar. Biol., 127(3): 455–461. Doi: 10.1007/s002270050033 |
| Sokolova I M, Frederich M, Bagwe R, Lannig G, Sukhotin A A, 2012. Energy homeostasis as an integrative tool for assessing limits of environmental stress tolerance in aquatic invertebrates. Mar. Environ. Res., 79: 1–15. Doi: 10.1016/j.marenvres.2012.04.003 |
| Taylor A C, Brand A R, 1975. Effects of hypoxia and body size on the oxygen consumption of the bivalve Arctica islandica (L.). J. Exp. Mar. Biol. Ecol., 19(2): 187–196. Doi: 10.1016/0022-0981(75)90046-5 |
| Wang W X, Widdows J, 1993. Metabolic responses of the common mussel Mytilus edulis to hypoxia and anoxia. Mar. Ecol. Prog. Ser., 95: 205–214. Doi: 10.3354/meps095205 |
| Widdows J, Shick J M, 1985. Physiological responses of Mytilus edulis and Cardium edule to aerial exposure. Mar. Biol., 85(3): 217–232. Doi: 10.1007/BF00393242 |