 2018, Vol. 36
Institute of Oceanology, Chinese Academy of Sciences
Article Information
- LIAN Yuxi(连玉喜), HUANG Geng(黄耿), Małgorzata GODLEWSKA(MałgorzataGODLEWSKA), CAI Xingwei(蔡杏伟), LI Chang(李昌), YE Shaowen(叶少文), LIU Jiashou(刘家寿), LI Zhongjie(李钟杰)
- Hydroacoustic estimates of fish biomass and spatial distributions in shallow lakes
- Chinese Journal of Oceanology and Limnology, 36(2): 587-597
- http://dx.doi.org/10.1007/s00343-017-6221-3
Article History
- Received Sep. 7, 2016
- accepted in principle Oct. 17, 2016
- accepted for publication Nov. 21, 2017


2 Research Center of Aquatic Organism Conservation and Water Ecosystem Restoration in Anhui Province, Anqing Normal University, Anqing 246133, China;
3 University of Chinese Academy of Sciences, Beijing 100049, China;
4 Polish Academy of Sciences, European Regional Centre for Ecohydrology, ul. Tylna 3, 90 36;4 Łódź, Poland
Shallow lakes are usually abundant with fish and provide plenty of fish production. However, fish resources in lakes are seriously threatened by environmental pollution, overfishing, and obstacles between rivers and lakes (Allan and Castillo, 2007; Antonio et al., 2007). Therefore, assessing fisheries resources is very important to protect and utilize the fish stocks in lakes. Traditional fisheries assessment methods are time consuming and laborious (Doroszczyk et al., 2007). Hydroacoustics is an innovative method to investigate and estimate fish stocks, which is quick, able to sample a large volume, and is non-intrusive (Misund, 1997; Simmonds and MacLennan, 2005). Hydroacoustics are commonly used to estimate fish biomass at sea and in deep inland waters (Godlewska et al., 2004, 2009, 2011; Simmonds and MacLennan, 2005; Taylor et al., 2005; Kubečka et al., 2009); however, hydroacoustics are rarely used in shallow waters because sampling volume is too small when sounding vertically at shallow depths (Burczynski and Johnson, 1986). Sounding can be done horizontally in shallow waters, but sound reflecting from the water surface and the bottom introduces noise when sounding horizontally (Kubečka et al., 1994; Mous, 1996; Kubečka, 1996; Thorne, 1998). However, modern hydroacoustic devices provide very narrow beams, which increase the range, and software (such as BioSonics Visual Analyzer, and Sonar 5, Echoview) deletes unwanted noise. So it seems current hydroacoustic devices can provide reliable estimates of fish biomass in shallow waters.
In fact, horizontal hydroacoustics have been applied to estimate fish abundance for some time (Kubečka, 1996; Yule, 2000; Knudsen and Sægrov, 2002; Godlewska et al., 2012; Hightower et al., 2013). However, little is known about the accuracy of acoustic evaluation, as it is difficult to count all of the fish in the experimental body of water for verification. Only a few experiments have compared the acoustic evaluation and direct statistics of all fish (Cadic et al., 1998; Godlewska et al., 2012) and their results looked very promising. Many shallow lakes occur along the middle and lower reaches of the Changjiang River, where commercial fisheries and winter fishing are carried out. The United Fishing Method has high fishing efficiency for target-size cyprinids in shallow lakes, which is called "driving, blocking, gill netting, and trapping" (Li and Xu, 1995). Winter fishing provides a good chance to test the accuracy of fish abundance assessments using hydroacoustics. We carried out a hydroacoustic assessment in two lakes before winter fishing started and compared the results evaluated by hydroacoustics with catch by fishermen.
2 MATERIAL AND METHOD 2.1 Study areaNiushan Lake is a shallow mesotrophic lake along the middle reaches of the Changjiang River (l14°27'–l14°38'E, 30°16'–30°22'N) (Fig. 1), with a surface area of 4.0 km2. The bottom of Niushan Lake is quite flat with a mean depth of 3.0 m and a maximum depth of 5.1 m. The main function of this lake is aquaculture and nearly no macrophytes are present. Kuilei Lake is located in the lower reaches of the Changjiang River (l20°39'–l20°51'E, 31°21'–31°30'N) (Fig. 1), with a surface area of 6.7 km2. The bottom of Kuilei Lake varies with a mean depth of 2.7 m and a maximum depth of 8.8 m. The main function of this lake is water supply, and aquaculture plays a supporting role. The bottom of the lake during the hydroacoustic study was covered with macrophytes. Some differences existed in the physical and chemical characteristics of the two lakes (Table 1), but the dominant fish species in Niushan Lake and Kuilei Lake were quite similar and were as follows: Silver Carp (Hypophthalmichthys molitrix), Bighead Carp (Aristichthys nobilis), Grass Carp (Ctenopharyngodon idellus), Black Carp (Mylopharyngodon piceus), Yellowcheck Carp (Elopichthys bambusa), Sneakhead (Ophiocephalus argus), Carp (Cyprinus carpio), Crucian Carp (Carassius auratus), Perch (Siniperca chuatsi), Topmouth Culter (Culter alburnus), and Mongolian Redfin (Culter mongolicus mongolicus) (Ye, 2007; Zhang, 2011).

|
| Figure 1 Map of study lakes and acoustic transects Map drawing No. GS(2008)1312 from National Administration of Surveying, Mapping and Geoinformation of China. |

The United Fishing Method, such as "driving, blocking, gill netting, and trapping" in winter, was applied to the fisheries in Niushan Lake and Kuilei Lake (Li and Xu, 1995). First, the fishermen drive the fish away from their previous habitat on one side of the lake using noise or other methods, then they block the water path with a gillnet (500 m×10 m, 2a=8 cm). This process is repeated over several days or weeks until most of the fish are concentrated in a trap net (500 m×10 m, 2a=6 cm), which is set on the other side of the lake.
Fish in the trap net were divided into large fish, which met the target-size criterion and were kept, and small fish, which were released back into the lake. The target size of Silvercarp and Bighead Carp in Niushan Lake and Kuilei Lake was about 45 cm. The United Fishing Method has a very high capture efficiency in large fisheries, and > 80% of target-size cyprinids are caught in shallow lakes (Li and Xu, 1995). Random sampling was conducted to identify catch composition, and 251 and 560 fish were sampled in Niushan Lake and Kuilei Lake, respectively. All samples were identified to species, measured to the nearest mm, and weighed to the nearest 0.1 g.
2.3 Acoustic samplingThe hydroacoustic survey was performed on Niushan Lake on 20 November 2013 and on Kuilei Lake on 22 November 2013 before all fishing activities commenced. The acoustic estimates were carried out at night, 1 h after sunset, because fish disperse more evenly at night than during the day, which was confirmed by our previous study (Ye et al., 2013) and other data (Duncan and Kubecka, 1993; Guillard et al., 1994; Ptak and Appenzeller, 1998; Lyons, 1998), The density and biomass of the fish resources were estimated using a Simrad EY60, with a 120 kHz split beam elliptical transducer, beam angle of 4°×10° at the 3 dB level. The transducer was mounted on a stainless-steel bracket located on the starboard about one-third the distance to the bow, and 0.8 m below the water surface. The transducer beamed perpendicular to the vessel, with an inclination angle of 2°–3° toward the horizontal. These two lakes are very shallow, so the detection range was 10–20 m. Pulse duration was 128 μs, and repetition rate was 5 pings/s, with a 32-μs sample interval. Boat speed was maintained at 5–6 km/h. The echosounder was connected to a portable computer, which provided a real-time display and data storage. A global positioning system (Garmin 60CSx) was used to determine the geographical coordinates. The equipment was calibrated before the surveys using a 23-mm diameter copper sphere, following the standard method (Foote et al., 1987). The survey transects were parallel to the short axis of the lake (Fig. 1). The degree of coverage values was calculated for each survey using the formula: Λ=D/√A (Aglen, 1983), which ranged from 4.7 to 8.3. These coverage values were higher than the minimum level recommended in the literature (Aglen, 1983; Guillard and Vergès, 2007; Godlewska et al., 2009).
We also determined depth and detected macrophytes with a Biosonics MX. The Biosonics MX has a 200-kHz single beam circle transducer with a beam angle of 8.5°×8.5° at the 3 dB level. The transducer was mounted on a stainless-steel bracket on the port about one-third the distance to the bow and 0.3 m below the water surface. The transducer beamed vertical; pulse duration was 400 μs, and repetition rate was 5 pings/s. The echosounder was controlled by another computer, which provided a real-time display and data storage.
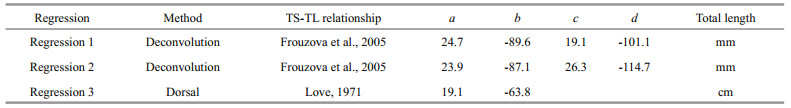
2.4 Data analysisThe hydroacoustic data were analyzed using Sonar5-pro ver. 6.0.1 software (Balk and Lindem, 2006). Before analyses, the raw data were converted using time varied gain (TVG)=40 lgR. To set the range, we applied a maximum range detection algorithm with the following parameters: smooth height was 21, width was 3, and threshold was -60 dB; targets < 40 pings were removed, and the search began at 3 m. Then, the maximum range was corrected, fish were distinguished from plants manually, which was based on macrophyte detection by the Biosonics MX. Fish abundance was estimated by echo-integration using the Sv/target strength (TS) scaling method based on single echo detection (SED). The target threshold was fixed at -50 dB based on the recorded fish TS distribution. The species size-TS relationships of the fish populations in the two lakes have not been studied, so we applied different regressions available in the literature (Table 2). Species in regression 1, regression 2 and regression 3 were a mixture of typical European freshwater fish species, European carp and different species pooled from 16 families and 8 orders, respectively (Love, 1971; Frouzova et al., 2005).
|
The applied threshold of -50 dB allowed detection of fish targets > 4 cm in total length (TL). Although there were several species of fish in the two lakes, the most important commercial fish were Silver Carp and Bighead Carp, and they had a similar length-weight relationship, so we chose the regression for Bighead Carp, which was dominant in the fishermen's catch, i.e., W=0.0061×TL3.167, where W is weight in g, TL is total length in cm (Ye et al., 2007).
Due to the small number of SED, we set a big length for the elementary sampling distance unit (ESDU); the ESDU in Niushan Lake and Kuilei Lake was 400 pings. Then, we calculated the arithmetic mean fish density (ind./ha) and fish biomass estimates (kg/ha) for each transect. Total fish biomass of the entire lake was calculated as the weighted average of all transects (Simmonds and MacLennan, 2005):

where B is the weighted mean biomass, n is the number of transects in the lake, Bi is the biomass along transect I, and Vsi is the sampled volume of transect i.
We only calculated biomass corresponding to fish length > 45 cm for comparison with the catch data, which was based on the fish size distribution and abundance received acoustically (in case of Frouzova we used deconvoluted fish size).
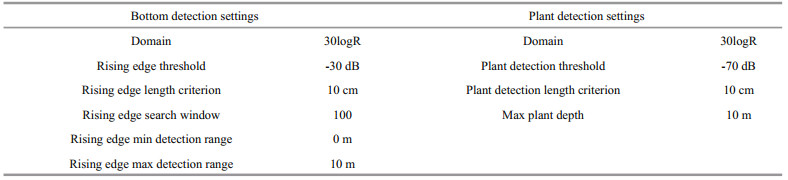
Depth and macrophyte coverage were analyzed with Bisonics Visual Habitat MX, and the parameter settings shown in Table 3. The results were exported after the bottom line and outline of the plants were corrected manually.
We calculated the biomass and defined the coordinates for the center of the ESDU to represent the GPS of biomass for mapping. Then, we applied the inverse-distance weighting method to map the spatial distribution of fish with the GPS and fish biomass using Arcmap 10.2 software. Depth and macrophyte coverage in the two lakes were mapped with the same method.
We matched the coordinates of fish abundance and water depth. Therefore, we could study the relationship between fish abundance and water depth after the depth information for abundance or biomass was obtained.
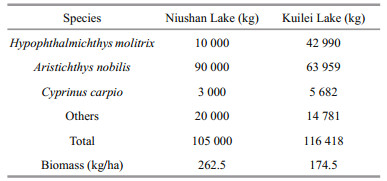
3 RESULT 3.1 Fish size distributionRough fisheries production and composition are shown in Table 4. We randomly sampled 251 fish in Niushan Lake and 560 fish in Kuilei Lake from the harvest. The smallest fish was 43.6 cm in Niushan Lake and 45.2 cm in Kuilei Lake. Mean total length and weight of fish in Niushan Lake were (61.39±5.69) cm and (2.62±0.75) kg and those in Kuilei Lake were (65.5±9.48) cm and (2.92±2.47) kg. The fish in Kuilei Lake were slightly larger than those in Niushan Lake (Fig. 2).

|
| Figure 2 Distribution of fish total length from catches in Niushan Lake and Kuilei Lake |
The TS distributions in Niushan Lake and Kuilei Lake were similar (Fig. 3). For example, -50 dB < TS < -40 dB in Niushan Lake was about 81.2% and for Kuilei Lake it was about 84.0%, so fish in Niushan Lake tended to have bigger TS on average ((-36.1±3.7) dB vs. (-34.6±4.6) dB).

|
| Figure 3 Target strength distribution in Niushan Lake and Kuilei Lake |
When the different TS-TL regressions were applied to convert TS to TL, there were differences among the three regressions. Love's regression produced a higher proportion of small fish, whereas the regression for typical European species by Frouzova et al. (2005) resulted in a higher proportion of large fish (Fig. 4).

|
| Figure 4 Total length of fish according to different target strength-total length regressions in Niushan Lake and Kuilei Lake |
The distribution of fish abundance in Niushan Lake was quite even, with a mean of (584.4±141.2) ind./ha (threshold=-50 dB). We applied the different TS-TL regressions to evaluate biomass, and the biomass from the transects was more variable: (320.0±242.6) kg/ha (regression 1), (350.7±249.7) kg/ha (regression 2), and (259.1±94.9) kg/ha (regression 3) (Fig. 5), which was attributed to different fish sizes among transects.

|
| Figure 5 Fish biomass in Niushan Lake with the different total length-length regressions (-50 dB < target strength < -18 dB) |
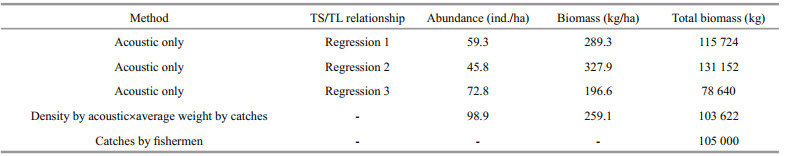
We evaluated the biomass of fish >45 cm in Niushan Lake using four different methods, and mean biomass was 196.6–327.9 kg/ha (Table 5), whereas mean biomass calculated from fishermen's catch was 262.5 kg/ha (Table 4). Thus, the method of multiplying mean abundance and average weight matched the fishermen's catch best.
|
The distribution of fish abundance in Kuilei Lake was quite variable; the mean was (905.7±640.2) ind./ha (threshold=-50 dB). When the three different TS-TL regressions were applied to evaluate biomass, the biomass from the transects also varied: (456.0± 437.5) kg/ha (regression 1), (536.4±500.3) kg/ha (regression 2), and (614.2±594.4) kg/ha (regression 5) (Fig. 6).

|
| Figure 6 Fish biomass in Kuilei Lake using the different total length-length regressions (-50 dB < target strength < -18 dB) |
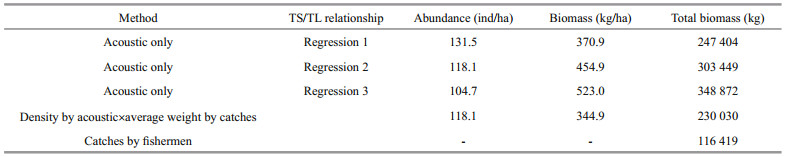
Mean biomass of fish > 45 cm in Kuilei Lake evaluated with the different methods was 344.9– 454.9 kg/ha (Table 6), whereas the mean biomass from the fishermen's catch was 174.5 kg/ha (Table 4), showing a large gap between the assessment results and the fishermen's catch.
|
Fish in Niushan Lake were distributed quite evenly, and fish abundance was 530–720 ind./ha in most of the lake (threshold=-50 dB) (Fig. 7). This pattern may be attributed to low habitat heterogeneity and that the bottom of Niushan Lake is quite flat (Fig. 7) with few macrophytes. The higher density appeared in the southwest and northeast parts of the lake where depth was > 3.6 m, and the highest density appeared in the center and eastern parts of the lake. It seemed that deeper water was associated with higher abundance, but Pearson's correlation test was not significant (rabundance-depth=0.278, P > 0.05). This tendency was even more obvious in Kuilei Lake (rabundance-depth=0.587, P < 0.05) because of more variation in depth. Kuilei Lake was quite shallow in the center, but much deeper near shore, particularly in the east (Fig. 8). The lake was characterized by low fish abundance in the center and higher density near shore, with the highest abundance occurring in the northeast part of the lake, where water depth was maximum. Fish abundance and water depth were high associated (Figs. 7 and 8).

|
| Figure 7 Water depth (a) and fish abundance (b) (-50 dB < target strength < -18 dB) in Niushan Lake |

|
| Figure 8 Water depth (a) and fish abundance (b) (-50 dB < target strength < -18 dB) in Kuilei Lake |
The fish abundance and water depth maps (Figs. 7 and 8) suggested that the fish tended to gather in deep water, so depth may be the key factor affecting fish distribution in these shallow lakes. The transects with high fish density in Niushan Lake corresponded to a mean water depth > 3.2 m. The deepest water also had the highest fish density in Kuilei Lake. The 10 species of macrophytes in Kuilei Lake were Potamogeton malaianus, Myriophyllum spicatum, Vallisneria natans, Vallisneria spinulosa, Potamogeton pectinatus, Potamogeton recurvatus, Ceratophyllum demersum, Najas minor, Najas marina, and Hydrilla verticillata, and mean coverage was 63%. Macrophyte coverage was negatively related with fish density, as lower fish abundance was observed in water with high macrophyte coverage (Fig. 9).

|
| Figure 9 Macrophyte coverage in Kuilei Lake |
Water depth and fish abundance were only weakly correlated (Figs. 10 and 11).

|
| Figure 10 Fish abundance estimated from the transects and mean water depth in Niushan Lake |

|
| Figure 11 Fish abundance estimated from the transects and mean water depth in Kuilei Lake |
Fish abundance differed in the two lakes. The fish abundance distribution in Niushan Lake was relatively stable, whereas it varied more in Kuilei Lake. The coefficient of variation was 0.71 for the 16 transects in Kuilei Lake, whereas it was 0.24 for the nine transects in Niushan Lake. The reason for this difference may be the different topography of the two lakes. The horizontal distribution pattern of fish is always correlated with water depth (Brosse et al., 1999; Prchalová et al., 2009), and fish abundance tends to increase with water depth in lakes in the middle and lower reaches of the Changjiang River basin (Ye et al., 2013). The bottom topography varied more in Kuilei Lake than that in Niushan Lake, so fish dispersal in Kuilei Lake was uneven, whereas that in Niushan Lake was quite even.
The fish distribution pattern could be the result of a tradeoff among predation risk, foraging opportunities, and reproduction (Levy, 1990; Scheuerell and Schindler, 2003). Predation pressure can affect fish distribution to a large extent (Wootton, 1990). The main piscivorous fish, such as Yellowcheek Carp, Mongolian Redfin, and Topmouth Culter, in Changjiang lakes all occupy the upper water layers (Ni and Zhu, 2005), and forage fish are forced into lower and darker layers to avoid visual predators (Mazur and Beauchamp, 2003). The macrophytes were patchily distributed in Kuilei Lake, which could also affect the fish distribution because macrophytes provide refuges for fish.
The distribution of fish can also be determined by their behavior. In our study, most of the acoustic signals came from Silver Carp, Bighead carp, Yellowcheek Carp, and Topmouth Culter (total weight proportion >85% of harvest; Table 4), and those fish prefer pelagic water to waters covered by macrophytes (Ni and Zhu, 2005). The distribution of macrophytes in Kuilei Lake was confined to water < 3 m, so the deep water had a higher density of fish.
Another reason for such a fish distribution could be seasonality. Our observations were made close to winter, when most species concentrate in deeper areas as water temperature decreases in winter (Goldspink, 1990; Imbrock et al., 1996).
4.2 Biomass assessment biasWe found that the hydroacoustic estimates matched commercial fishery production very well in Niushan Lake, except when the TS-TL regression by Love (1971) was applied. However, the hydroacoustic estimates were much higher than the commercial fishery production in Kuilei Lake. Several reasons could explain this difference.
The United Fishing Method has high fishing efficiency but is affected by lake topography. Generally speaking, the simpler the topography, the higher the efficiency, and the bottom of Niushan Lake was quite flat, whereas that of Kuilei Lake was quite variable. Moreover, the main function of Niushan Lake is aquaculture, whereas that of Kuilei Lake is water supply, so fishing efficiency in Niushan Lake is higher than that in Kuilei Lake. For example, the acoustic evaluation included all fish, but the catch by fishermen included only fish > 45 cm, as the smaller ones were released. However, the lower TS had more of an effect in Kuilei Lake than in Niushan Lake (Fig. 4), and fish caught in Kuilei Lake were bigger than those caught in Niushan Lake (2.92 kg/ind. vs. 2.62 kg/ind.). The third reason may be the fish distribution pattern; the spatial distribution of fish varied greatly in Kuilei Lake and there tended to be higher abundance in deeper water (Fig. 8). The horizontal beam spreads farther compared to that in shallow waters, until it reaches the bottom of deep water, as with sampling volume. Furthermore, some shallow water could not be assessed considering safety, which caused a weight bias neither weighted by length nor sampling volume. Finally, an improper TSTL regression may be the most important reason for a bias, but until now no appropriate regressions for Chinese species have been developed. We assumed fish direction was random when applying regressions 1 and 2, but this may not be the case. Moreover, regression 3 was derived from the dorsal aspect while the transducer was beaming horizontally in our estimates, which would also lead to estimation bias.
The assessment applying the TS-TL regression by Frouzova et al. (2005) seemed to be the closest to the actual biomass in both lakes compared with the acoustic estimates of fishing production. The method combining hydroacoustic abundance and mean fishery weight also seemed to be reasonable to evaluate total lake biomass.
5 CONCLUSIONIt is difficult to apply hydroacoustics to assess fisheries resources in shallow lakes, but it is not completely infeasible. Reliable estimates can be obtained when the natural conditions of the sampled lake are appropriate. In our studies, the lake with a flat bottom and low macrophyte coverage was more suitable for hydroacoustics than the one with a more variable bottom and more macrophytes.
| Aglen A, 1983. Random errors of acoustic fish abundance estimates in relation to the survey grid density applied. FAO Fisheries Report 300: p.293–298. |
| Allan J D, Castillo M M, 2007. Stream Ecology:Structure and Function of Running Waters. Springer, Netherlands: 436p. |
| Antonio R R, Agostinho A A, Pelicice F M, Bailly D, Okada E K, Dias J H P, 2007. Blockage of migration routes by dam construction:can migratory fish find alternative routes?. Neotropical Ichthyology, 5(2): 177–184. Doi: 10.1590/S1679-62252007000200012 |
| Balk H, Lindem T, 2006. Sonar 4, Sonar 5, Sonar 6-Postprocessing Systems. Operator Manual. Lindem Data Acquisition. University of Oslo, Norwayp.427-427. |
| Brosse S, Lek S, Dauba F, 1999. Predicting fish distribution in a mesotrophic lake by hydroacoustic survey and artificial neural networks. Limnology and Oceanography, 44(5): 1 293–1 303. Doi: 10.4319/lo.1999.44.5.1293 |
| Burczynski J J, Johnson R L, 1986. Application of dual-beam acoustic survey techniques to limnetic populations of juvenile sockeye salmon (Oncorhynchus nerka). Canadian Journal of Fisheries and Aquatic Sciences, 43(9): 1 776–1 788. Doi: 10.1139/f86-221 |
| Cadic N, Irz P, Argillier C. 1998. A comparison between dam draining fishstockaking, gillnet sampling and acoustic sampling for fish biomass assessment on a reservoir. In: Alippi A, Canelli G B eds. Proceedings of the Fourth European Conference on Underwater Acoustics. CNRIDAC, Rome, Italy. p. 261-266. |
| Doroszczyk L, Długoszewski B, Godlewska M, 2007. Comparison of acoustical estimates of fish abundance for different coverage and survey design. Hydroacoustics, 10: 33–38. |
| Duncan A, Kubecka J, 1993. Hydroacoustic Methods of Fish Surveys. National Rivers Authority, Bristol. |
| Foote K G, Kundsen H P, Vestnes G, MacLennan D N, Simmonds E J, 1987. Calibration of acoustic instruments for fish density estimation:a practical guide. Cooperative Research Report No. 144. International Council for the Exploration of the Sea. Copenhagen, Denmark: p.6–80. |
| Frouzova J, Kubecka J, Balk H, Frouz J, 2005. Target strength of some European fish species and its dependence on fish body parameters. Fisheries Research, 75(1-3): 86–96. Doi: 10.1016/j.fishres.2005.04.011 |
| Godlewska M, Colon M, Doroszczyk L, Długoszewski B, Verges C, Guillard J, 2009. Hydroacoustic measurements at two frequencies:70 and 120kHz-consequences for fish stock estimation. Fisheries Research, 96(1): 11–16. Doi: 10.1016/j.fishres.2008.09.015 |
| Godlewska M, Colon M, Jóźwik A, Guillard J, 2011. How pulse lengths impact fish stock estimations during hydroacoustic measurements at 70 kHz. Aquatic Living Resources, 24(1): 71–78. Doi: 10.1051/alr/2011104 |
| Godlewska M, Frouzová J, Kubecka J, Wiśniewolski W, Szlakowski J, 2012. Comparison of hydroacoustic estimates with fish census in shallow Malta Reservoirwhich TS/L regression to use in horizontal beam applications?. Fisheries Research, 123-124: 90–97. Doi: 10.1016/j.fishres.2011.11.023 |
| Godlewska M, Świerzowski A, Winfield I J, 2004. Hydroacoustics as a tool for studies of fish and their habitat. Ecohydrology and Hydrobiology, 4(4): 417–427. |
| Goldspink C R, 1990. The distribution and abundance of young (Ⅰ+-Ⅱ+) perch, Perca fluviatilis L. , in a deep eutrophic lake, England. Journal of Fish Biology, 36(3): 439–447. |
| Guillard J, Boet P, Gerdeaux D, Roux P, 1994. Application of mobile acoustic techniques fish surveys in shallow water:the river Seine. Regulated Rivers:Research & Management, 9(2): 121–126. |
| Guillard J, Vergès C, 2007. The repeatability of fish biomass and size distribution estimates obtained by hydroacoustic surveys using various sampling strategies and statistical analyses. International Review of Hydrobiology, 92(6): 605–617. Doi: 10.1002/(ISSN)1522-2632 |
| Hightower J E, Taylor J C, Degan D J, 2013. Estimating abundance of adult striped bass in reservoirs using mobile hydroacoustics. American Fisheries Society Symposium, 80: 279–289. |
| Imbrock F, Appenzeller A, Eckmann R, 1996. Diel and seasonal distribution of perch in Lake Constance:a hydroacoustic study and in situ observations. Journal of Fish Biology, 49(1): 1–13. |
| Knudsen F R, Sægrov H, 2002. Benefits from horizontal beaming during acoustic survey:application to three Norwegian lakes. Fisheries Research, 56(2): 205–211. Doi: 10.1016/S0165-7836(01)00318-6 |
| Kubečka J, Duncan A, Duncan W M, Sinclair D, Butterworth A J, 1994. Brown trout populations of three Scottish lochs estimated by horizontal sonar and multimesh gill nets. Fisheries Research, 20(1): 29–48. Doi: 10.1016/0165-7836(94)90004-3 |
| Kubečka J, Hohausová E, Matěna J, Peterka J, Amarasinghe U S, Bonar S A, Hateley J, Hickley P, 2009. The true picture of a lake or reservoir fish stock:a review of needs and progress. Fisheries Research, 96(1): 1–5. Doi: 10.1016/j.fishres.2008.09.021 |
| Kubečka J. 1996. Use of horizontal dual-beam sonar for fish surveys in shallow waters. In: Cowx I G ed. Stock Assessment in Inland Fisheries. Fishing News Books Ltd., Blackwell, Oxford. p. 165-178. |
| Levy D A, 1990. Reciprocal diel vertical migration behavior in Planktivores and zooplankton in British Columbia lakes. Canadian Journal of Fisheries and Aquatic Sciences, 47(9): 1 755–1 764. Doi: 10.1139/f90-199 |
| Li S F, Xu S L, 1995. Culture and Capture of Fish in Chinese Reservoirs. International Development Research Centre, Ottawa, Canada: p.95–105. |
| Love R H, 1971. Dorsal-aspect target strength of an individual fish. The Journal of the Acoustical Society of America, 49(38): 816–823. |
| Lyons J, 1998. A hydroacoustic assessment of fish stocks in the River Trent, England. Fisheries Research, 35(1-2): 83–90. Doi: 10.1016/S0165-7836(98)00062-9 |
| Mazur M M, Beauchamp D A, 2003. A comparison of visual prey detection among species of piscivorous salmonids:effects of light and low turbidities. Environmental Biology of Fishes, 67(4): 397–405. Doi: 10.1023/A:1025807711512 |
| Misund O A, 1997. Underwater acoustics in marine fisheries and fisheries research. Reviews in Fish Biology and Fisheries, 7(1): 1–34. Doi: 10.1023/A:1018476523423 |
| Mous P J, 1996. Interactions between fisheries and birds in IJsselmeer, The Netherlands. Wageningen University, Netherlandsp.45-62. |
| Ni Y, Zhu C D, 2005. Fishes of the Taihu Lake. Shanghai Scientific & Technical Publishers, Shanghai, Chinap.99-119. |
| Prchalová M, Kubečka J, Čech M, Frouzová J, Draštík V, Hohausová E, Jůza T, Kratochvíl M, Matěna J, Peterka J, Říha M, Tušer M, Vašek M, 2009. The effect of depth, distance from dam and habitat on spatial distribution of fish in an artificial reservoir. Ecology of Freshwater Fish, 18(2): 247–260. Doi: 10.1111/eff.2009.18.issue-2 |
| Ptak J K, Appenzeller A R, 1998. Size, depth, and frequency of pelagic Lake Constance whitefish (Coregonus lavaretus L.) shoals during the seasons:a hydroacoustic study. Arch. Hydrobiol. Spec. Issues Adv. Limnol., 50: 237–248. |
| Scheuerell M D, Schindler D E, 2003. Diel vertical migration by juvenile sockeye salmon:empirical evidence for the antipredation window. Ecology, 84(7): 1 713–1 720. Doi: 10.1890/0012-9658(2003)084[1713:DVMBJS]2.0.CO;2 |
| Simmonds J, MacLennan D, 2005. Fisheries Acoustics:Theory and Practice. Blackwell Science, Oxford. |
| Taylor J C, Thompson J S, Rand P S, Fuentes M, 2005. Sampling and statistical considerations for hydroacoustic surveys used in estimating abundance of forage fishes in reservoirs. North American Journal of Fisheries Management, 25(1): 73–85. Doi: 10.1577/M03-241.1 |
| Thorne R E, 1998. Review:experiences with shallow water acoustics. Fisheries Research, 35(1-2): 137–141. Doi: 10.1016/S0165-7836(98)00068-X |
| Wootton R J, 1990. Ecology of Teleost Fishes. Springer, Netherlands: 404p. |
| Ye S W, Li Z J, Feng G P, Cao W X, 2007. Length-weight relationships for thirty fish species in Lake Niushan, a shallow macrophytic Yangtze Lake in China. Asian Fisheries Science(20): 217–226. |
| Ye S W, 2007. Studies on fish communities and trophic network model of shallow lakes along the middle reach of the Yangtze River. Institute of Hydrobiology, Chinese Academy of Science, Beijing, Chinap.32-46. |
| Ye S, Lian Y, Godlewska M, Liu J, Li Z, 2013. Day-night differences in hydroacoustic estimates of fish abundance and distribution in Lake Laojianghe, China. Journal of Applied Ichthyology, 29(6): 1 423–1 429. Doi: 10.1111/jai.2013.29.issue-6 |
| Yule D L, 2000. Comparison of horizontal acoustic and purseseine estimates of salmonid densities and sizes in eleven Wyoming waters. North American Journal of Fisheries Management, 20(3): 759–775. Doi: 10.1577/1548-8675(2000)020<0759:COHAAP>2.3.CO;2 |
| Zhang J J, 2011. Study on structure of fish community and diet composition of dominant fishes in Lake Kuilei. Journal of Hydroecology, 32(6): 66–71. |