 2018, Vol. 36
Institute of Oceanology, Chinese Academy of Sciences
Article Information
- CHEN Yunlong(陈云龙), SHAN Xiujuan(单秀娟), JIN Xianshi(金显仕), JOHANNESSEN Arne, YANG Tao(杨涛), DAI Fangqun(戴芳群)
- Changes in fish diversity and community structure in the central and southern Yellow Sea from 2003 to 2015
- Chinese Journal of Oceanology and Limnology, 36(3): 805-817
- http://dx.doi.org/10.1007/s00343-018-6287-6
Article History
- Received Oct. 21, 2016
- accepted in principle Jan. 4, 2017
- accepted for publication May. 27, 2017


2 Function Laboratory for Marine Fisheries Science and Food Production Processes, Qingdao National Laboratory for Marine Science and Technology, Qingdao 266237, China;
3 Key Laboratory of Sustainable Development of Marine Fisheries, Ministry of Agriculture, Shandong Provincial Key Laboratory of Fishery Resources and Ecological Environment, Yellow Sea Fisheries Research Institute, Chinese Academy of Fishery Sciences, Qingdao 266071, China;
4 University of Chinese Academy of Sciences, Beijing 100049, China;
5 Department of Biology, University of Bergen, PO Box 7803, 5006 Bergen, Norway
The Yellow Sea is a marginal sea located in the western Pacific Ocean between China and the Korean Peninsula with an average depth of 44 m. It is shallow along the coast and becomes relatively deep in the Yellow Sea trough area (Wei et al., 2010; Lie et al., 2015). In winter, the Yellow Sea Warm Current is the most remarkable hydrological event in the Yellow Sea. It carries seawater of high temperature and salinity from the northward Kuroshio branch current and the Taiwan Warm Current in the northern part of the East China Sea and intrudes into the central Yellow Sea (Lin et al., 2011). Dominated by winter monsoons, several southward coastal water currents which are usually cold, full of nutrients and have low salinity move to the central Yellow Sea (Chen, 2009). Together with discharge from the Changjiang River, these water masses interact in winter and drive the biogeochemical cycles in this region. Especially, they determine the hydrological environment, matter transportation and sedimentation, which have great impacts on the distribution of plankton, fishes, crustaceans and cephalopods (Qin et al., 1989; Jin et al., 2003; Liu et al., 2015; Mei et al., 2016).
As an important ecological unit of spatial scale, fish community reflects the characteristics of the fishery ecosystem from the aspects of material recycling and energy transformation. The maintenance of biodiversity and the stabilization of fish community are critical to the balance of aquatic ecosystems. Many external factors have been proven to influence fish communities such as overfishing, reclamation, pollution and climate change, which may lead to lower fishing rates, the miniaturization and early maturation of fish stocks (Dethlefsen and Tiews, 1985; McLusky et al., 1992; Jennings et al., 2001; Genner et al., 2010; Stefansdottir et al., 2010).
Fisheries resources research in the Yellow Sea has been widely conducted and has mainly concentrated on species composition, population dynamics and fish community structure (Jin and Tang, 1996; Jin, 2003; Xu and Jin, 2005; Li et al., 2011; Shan et al., 2012; Wang et al., 2013; Huang et al., 2014). Notably, Xu and Jin (2005) studied variations in the fish assemblage structure over the period 1985–2002. However, since then, the fishery environment has changed with variations in the ecological environment and everincreasing fishing efforts (Keesing et al., 2011; Yuan et al., 2012). The exploitation of Japanese anchovy Engraulis japonicus Temminck & Schlegel 1846, a key species in the Yellow Sea ecosystem, epitomizes the fate of many economically important species. After heavy exploitation of Japanese anchovy since the 1990s, its biomass fluctuated at low levels, ranging from 0.11 to 0.42 million tons during 2001–2005 (Zhao, 2006). Considering this background, what subsequent changes are to be expected for the fish community in the central and southern Yellow Sea?
In this study, fish assemblage indices were calculated to assess variations in the fish community diversity in the central and southern Yellow Sea for the period 2003–2015. Dominant species composition was explored to determine the characteristics of the fish community during this period. Multivariate analysis and analyses of mean individual weight (MIW), size-spectra, and catch per unit effort (CPUE) were used to advance information on the whole fish community during the sample years. Reasons for variations in the fish community in the region are also discussed. This research benefits assessments of the fish community in the Yellow Sea and provides data that support ecosystem-based fishery management in the future.
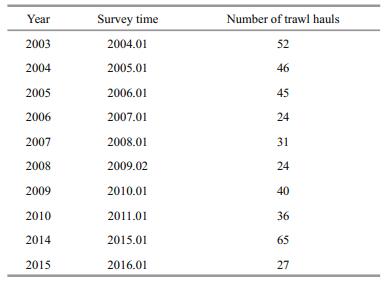
2 MATERIAL AND METHOD 2.1 Survey area and data collectionSampling stations were designed on a grid with regular intervals of 0.5°N×0.5°E (Fig. 1). Information on survey times and the number of bottom trawls from 2003 to 2015 (excepting 2011–2013) are listed in Table 1. Although the number of survey stations varied between years, relatively high sampling coverage was performed annually throughout the entire geographic range. Furthermore, a bootstrap method (Felsenstein, 1985) was used to balance the uneven effect of trawl numbers.

|
| Figure 1 Schematic of the sampling stations in the central and southern Yellow Sea |
Data were collected by the Yellow Sea Fisheries Research Institute in winter during the period 2003–2015, using the R/V Beidou. Parameters of the fishing gear were as follows: a net of circumference 836 mesh×12 cm, and a 10-cm mesh-size cod-end with a 2.4-cm mesh-size liner thereafter. The duration of each trawl haul varied between 0.5 h and 1 h at an average hauling speed of 3 knots. All data were standardized to 1 h trawl duration for further analyses. The catch at each station was identified to species level, or to the lowest possible taxon level, and the abundance (in ind.) and weight (in g) of each species were recorded. Fishing effort (in hp) was calculated by the sum of total horsepower of mobile fishing vessels, including those from Shandong Province, Hebei Province, Liaoning Province and Tianjin City using China fisheries statistics yearbook.
2.2 Data analysis 2.2.1 Fish assemblage indicesFish assemblage indices in this study consisted of three types: indices of diversity, richness and evenness. The indices were defined using relative biomass (in kg/h) to avoid the dissimilarity caused by different individual sizes (Qiu, 1988; Jin and Tang, 1996). For diversity indices, the Shannon-Wiener index (H') and Hill's family of diversity numbers (N1 and N2) were used (Wilhm, 1968; Hill, 1973). N1 represents the number of common species, and N2 denotes the number of dominant species in the fish community. The Margalef index (d) was chosen to represent the richness of the fish community due to its independence from sample size, and Pielou's evenness index (J') was calculated to determine the evenness of a community (Margalef, 1958; Pielou, 1975; Jin and Tang, 1996). Based on the catch data in weight obtained by bottom trawls from 2003 to 2015, the diversity, richness and evenness of the fish assemblages were calculated to a 95% confidence interval. The calculation process of each index was repeated 1 000 times for each year using a bootstrap method.
2.2.2 Multivariate analysisA fourth-root transformation was first applied to the biomass data, following the method of Xu and Jin (2005), so as to reduce the effect of dominant species on the ordination, using the Bray-Curtis similarity measure. Hierarchical clustering and non-metric multidimensional scaling (NMDS) were used to analyze the composition characters of the fish assemblages between the survey years. A stress value was calculated to evaluate the difference between the distance in the reduced dimension and the complete multidimensional space: a stress score below 0.1 is considered good, while a stress score above 0.2 is considered unacceptable (Clarke, 1993). The multivariate dispersion (MVDISP) index was used to reflect the amount of variation in the fish assemblage structure under abiotic and biotic disturbances in different year groups. Similarity percentage (SIMPER) analysis was performed to examine both the contribution of each species to the average BrayCurtis dissimilarity between different year groups and the similarity within each year group (Clarke, 1993; Clarke and Warwick, 2001; Xu and Jin, 2005).
2.2.3 Size-spectra, MIW and CPUE analysesIn size-spectra analysis, the average weight (in g) of each species was first calculated by its corresponding weight and the number of individuals captured at each sampling station in each year. Next, this average weight was converted into average length (in cm), based on the hypothesis that length=(100×weight)1/3, and then the number of individuals captured per hour was assigned to a corresponding length group (Xu and Jin, 2005). The size-spectra were plotted using the summed length of all species as an independent variable, with intervals of 5 cm, and the natural logarithm of summed individual numbers of all species as the dependent variable. Linear regressions were performed for fish lengths ranging from 5 to 65 to estimate the slopes and intercepts of the sizespectra (Gislason and Rice, 1998; Bianchi et al., 2000; Xu and Jin, 2005). Species occurrence of more than three times and seven times were included in the MIW and CPUE analyses as low and high thresholds, respectively. The MIW of each species was calculated by dividing the corresponding total weight by the total individual numbers annually, while the CPUE of each species was calculated by dividing the total individual number by sampling stations per year. The average weight and CPUE for each species and their relationship with years was explored by Spearman's rank correlation. The G-test was used to test for significance of size changes over time, and G-statistics were obtained by the signs frequency of Spearman's rank correlation coefficients (Zar, 1984; McDonald, 2014).
Fish assemblage indices and multivariate analysis were performed with PRIMER v.5.2.8 software (Clarke and Gorley, 2001; Clarke and Warwick, 2001); the other analyses namely size-spectra, MIW and CPUE, were performed using R v.3.3.0 (www.rproject.org; Ihaka and Gentleman, 1996).
3 RESULT 3.1 Variations in the fish assemblage indicesAll five fish assemblage indices showed fluctuations but without any clear trends for 2003–2015 (Fig. 2) (Spearman's rho=-0.33 for H', Spearman's rho=-0.33 for N1, Spearman's rho=-0.22 for N2, Spearman's rho=-0.52 for d, Spearman's rho=-0.18 for J'; all P > 0.05). However, the Shannon-Wiener index (H'), N1, and the Margalef index (d) revealed a significant decreasing trend between 2003 and 2010 (Spearman's rho=-0.76 for H', Spearman's rho=-0.76 for N1, Spearman's rho=-0.88 for d; all P < 0.05), with the lowest values resulting from the year 2008 (Fig. 2). The results of N2 and the Pielou evenness index (J') showed a decreasing trend during the same period, but this was not significant (Spearman's rho=-0.67, P=0.07 for N2; Spearman's rho=-0.64, P=0.09 for J').

|
| Figure 2 Variations in the fish assemblage indices using trawl data in the central and southern Yellow Sea a–c. diversity indices (H', N1 and N2); d. species richness index (d); e. community evenness index (J'). |
There were strong positive and significant correlations (P < 0.05) among the fish assemblage indices (Fig. 3), and all five indices displayed the same trend. The highest correlation was found between diversity indices H' and N1 (Pearson's rho=0.97), while the lowest correlation was found between the richness index and the evenness index (Pearson's rho=0.72).

|
| Figure 3 Pearson correlation coefficients between the fish assemblage indices (*P < 0.05, **P < 0.01) |
The number of dominant species for a given year ranged from 2 to 9 during 2003–2015. In 2008, the Japanese anchovy and the anglerfish Lophius litulon (Jordan 1902) accounted for 75.4% and 6.7% of the total fish catch respectively. Japanese anchovy and the anglerfish were found to be the dominant species in all survey years (10 yrs) followed by Tanaka's snailfish Liparis tanakae (Gilbert & Burke 1912) (dominant in 9 yrs), silver pomfret Pampus argenteus (Euphrasen 1788) (8 yrs) and small yellow croaker Larimichthys polyactis (Bleeker 1877) (5 yrs). These top-five species ranged from 49.7% to 82.1% in weight percentage of the total fish catch from 2003 to 2015. Four lesser dominant species (occurrence fewer than 4 yrs) were smallhead hairtail Eupleurogrammus muticus (Gray 1831) (3 yrs), Pacific cod Gadus macrocephalus Tilesius 1810 (2 yrs), scaly hairfin anchovy Setipinna taty (Valenciennes 1848) (2 yrs) and Osbeck's grenadier anchovy Coilia mystus (Linnaeus 1758) (2 yrs). Total weight of all dominant species accounted for a large proportion of the total fish catch, ranging between 76.1% and 89.0 %.
3.3 Multivariate analysisCluster analysis of fish assemblages in the central and southern Yellow Sea was conducted using BrayCurtis similarity between the years (Fig. 4). Two groups (Groups Ⅰ and Ⅱ) were identified and aggregated with 66.16% and 69.36% similarity, respectively. However, the two groups aggregated together with 63.71% similarity, which means there was a high level of similarity among all years.

|
| Figure 4 Cluster analysis of the fish assemblages from trawl data in the central and southern Yellow Sea ▲ Group Ⅰ; ■ Group Ⅱ. |
The stress score of the NMDS analysis was 0.06 (< 0.1), indicating that the composition of species from different years could be accurately distinguished. In Fig. 5, Group Ⅰ is localized in the left-upper region of the figure and Group Ⅱ in the central and right region. The NMDS analysis was in accordance with the results of the cluster analysis.

|
| Figure 5 Non-metric multi-dimensional scaling (NMDS) analysis in the central and southern Yellow Sea Stress value=0.06, ▲ Group Ⅰ, ■ Group Ⅱ. |
The MVDISP values were 1.455 and 0.818 for Group Ⅰ and Group Ⅱ, respectively, which indicated greater variances in the fish assemblage structure in Group Ⅰ than that in Group Ⅱ during the sample period. This was in accordance with the results of the NMDS analysis in which the distances of the survey years within Group Ⅰ were slightly farther apart from each other as compared to the distances within Group Ⅱ, which were much closer.
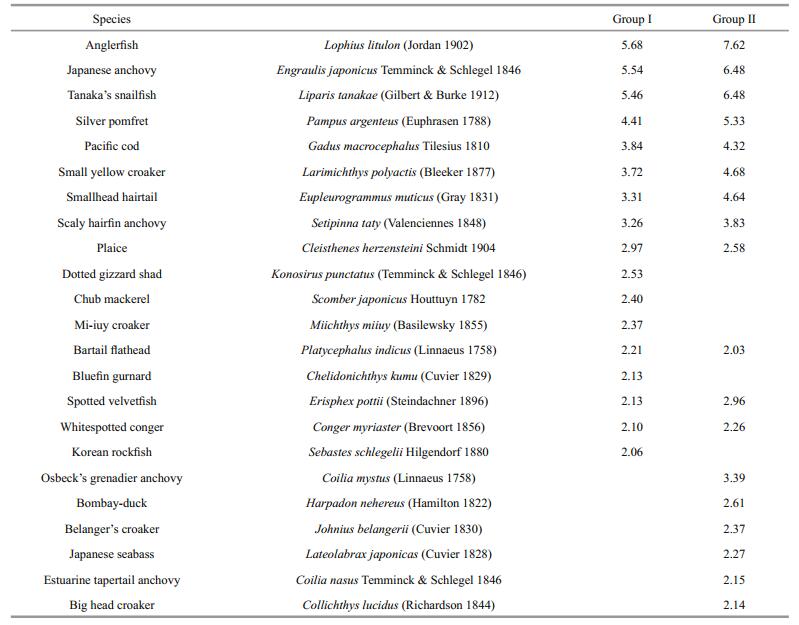
The SIMPER analysis demonstrated that the average similarities for Group Ⅰ and Group Ⅱ were 71.58% and 67.51%, respectively. Twelve species typified in both groups including the anglerfish, Japanese anchovy, Tanaka's snailfish, silver pomfret, Pacific cod, small yellow croaker, smallhead hairtail, scaly hairfin anchovy, plaice Cleisthenes herzensteini Schmidt 1904, bartail flathead Platycephalus indicus (Linnaeus 1758), spotted velvetfish Erisphex pottii (Steindachner 1896) and whitespotted conger Conger myriaster (Brevoort 1856), they accounted for 44.63% and 53.21% of similarity in Group Ⅰ and Group Ⅱ, respectively (Table 3). Additionally, Dotted gizzard shad Konosirus punctatus (Temminck & Schlegel 1846), chub mackerel Scomber japonicus Houttuyn 1782, Mi-iuy croaker Miichthys miiuy (Basilewsky 1855), bluefin gurnard Chelidonichthys kumu (Cuvier 1829) and Korean rockfish Sebastes schlegelii Hilgendorf 1880 were typifying species in Group Ⅰ while big head croaker Collichthys lucidus (Richardson 1844), belanger's croaker Johnius belangerii (Cuvier 1830), Japanese seabass Lateolabrax japonicas (Cuvier 1828) and other three species were typifying species in Group Ⅱ.
|
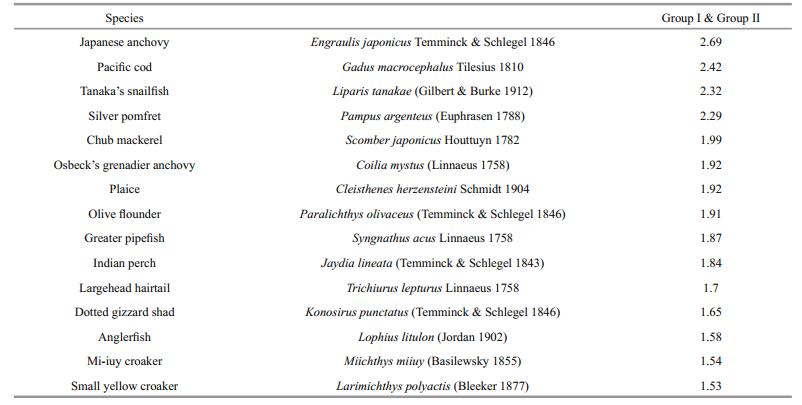
The dissimilarity was 36.29% between Group Ⅰ and Group Ⅱ, which was in accordance with the result of cluster analysis above (Fig. 4). The top fifteen species contributing to dissimilarity between groups were showed in Table 4. Percentage contributions of Japanese anchovy, Tanaka's snailfish, silver pomfret and Pacific cod were higher than 2% while those of others were less than 2%.

|
|
Referring to size-spectra analysis, no consistent trend was found in the intercept (Spearman's rho = -0.43, P > 0.05) and slope (Spearman's rho=0.42, P > 0.05) over time (Fig. 6). Intercepts between Group Ⅰ and Group Ⅱ were significantly different (F1, 8= 11.48, P < 0.01), while the slopes were not (F1, 8=0.85, P > 0.05). There were also no significant differences between the slope of size-spectra and fishing effort (Spearman's rho=0.62, P > 0.05, n=10).

|
| Figure 6 Variations in intercepts and slopes of the whole fish assemblage size-spectra based on trawl data in the central and southern Yellow Sea |
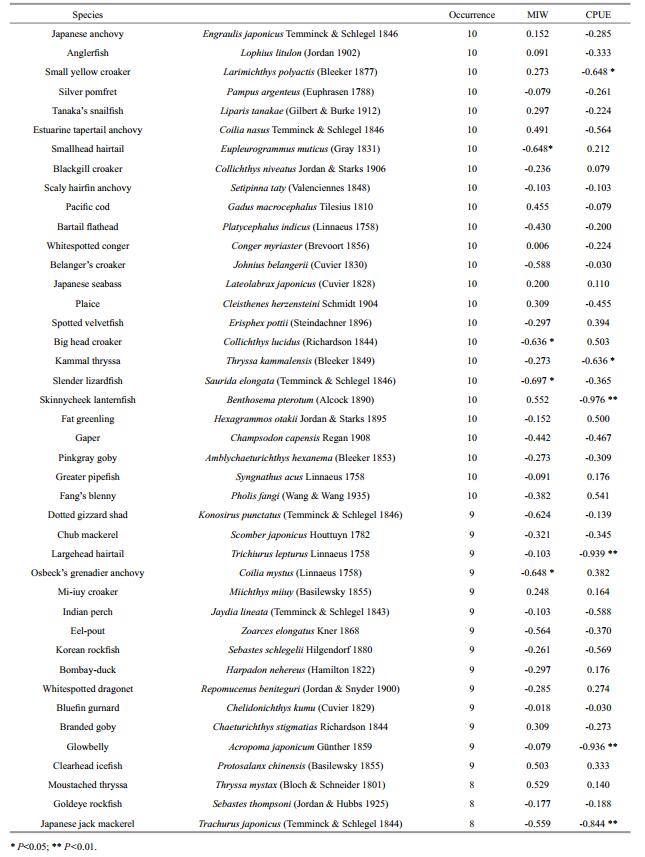
Species occurring more than seven times during the survey years (high threshold level) were selected for analyses of MIW and CPUE. The MIW of the selected species showed a decreasing trend over time since the number of species with a negative Spearman's rank correlation coefficient was twice that of species with a positive value (Table 5). The Gtest indicated that the present distribution of MIW was significantly different from the expected 50:50 null hypothesis (G=4.757, P < 0.05).
|
The results of the CPUE analysis were consistent with the MIW analysis and likewise showed a significant decreasing trend over time (G=4.757, P < 0.05). The individual correlation coefficients of some traditional economically important species, such as small yellow croaker and largehead hairtail were significantly high, reaching -0.648 and -0.939, respectively. This phenomenon was likewise observed for some small-sized species, for example, Kammal thryssa Thryssa kammalensis (Bleeker 1849), skinnycheek lanternfish Benthosema pterotum (Alcock 1890), and glowbelly Acropoma japonicum Günther 1859.
To make the results more persuasive, species occurring more than three times (low threshold level) were also tested. The MIW (G=12.199, P < 0.01) and CPUE (G=7.587, P < 0.01) again revealed a significant decreasing trend over time.
4 DISCUSSIONAs the Yellow Sea is a typical marginal sea, the fishery resources in this region have an independent character. For example, most fishes inhabit the area throughout their life, and thus form relatively independent groups. Their biology and ecology are similarly influenced by the seawater temperature: fish overwintering in the central and southern Yellow Sea migrate to coastal waters in spring to spawn with the rise in water temperature, feed in summer and autumn, and then they move back again to the central and southern Yellow Sea for overwintering as the temperatures begin to decrease in winter (Deng and Zhao, 1991; Jin and Tang, 1996). In this study, data for winter was chosen to cover the effect that population migration may or may not have on the fish community.
4.1 Fish assemblage indicesFive fish assemblage indices all showed similar trends, with significant (P < 0.05) correlations between each other, but no clear trends for the entire period 2003–2015. However, a decreasing trend was observed in all five indices for the shorter period 2003–2010, and this was significant (P < 0.05) in the Shannon-Wiener index (H'), N1, and Margalef index (d), but not in N2 and the Pielou evenness index (J'). This result is consistent with many other research findings, showing that fish assemblage evenness may not necessarily be sensitive to variations in environmental conditions (Zhu et al., 1994; Liu et al., 2007; Kamrani et al., 2016). All indices reached a minimum with the year 2008, which might be attributable to a huge biomass of Japanese anchovy which accounted for up to 75.4% of the total fish catch that year, while in the other years it contributed less than 50%. Fish assemblage indices should be used carefully in assessing the ecological status classification of fishery resources, as they can be influenced by many salient elements, such as sampling methods, sampling size, and bottom sediment type (Salas et al., 2006; Taherizadeh and Sharifinia, 2015; Kamrani et al., 2016).
4.2 Fish community structureBoth anthropogenic activities and environmental variables can influence variations in coastal fish communities (Olsson et al., 2012; Bergström et al., 2016). For instance, temperature, dissolved oxygen, pH and salinity were the four main variables influencing the fish community structure in Iranian coastal waters (Kamrani et al., 2016). However, one challenge in the present study was a lack of accompanying environmental data, which future studies should try to incorporate.
Fisheries resources in the Yellow Sea have seriously declined during the last 50 years, with researchers reporting alternations to dominant species composition, miniaturization of size classes, and trophic level decreases (Jin and Tang, 1996; Jin, 2003; Xu and Jin, 2005). Taxonomic indices, such as average taxonomic distinctness Δ+ and variation in taxonomic distinctness Λ+, were both found to be lower in 2000 as compared to 1985 (Xu et al., 2005). The trophic level estimation of high-trophic-level communities in the Yellow Sea dropped from 3.7 in 1985–1986 to 3.4 in 2000–2001, decreasing by 0.14 on average per decade, and the estimation for the northern Yellow Sea was 0.24 per decade from 1985 to 2010 (Zhang and Tang, 2004; Zhang et al., 2007, 2011a). Several commercially important species, such as small yellow croaker, largehead hairtail and plaice, were once dominant in the 1950s; Pacific herring Clupea pallasii Valenciennes 1847 became abundant in the early 1970s; the small-sized pelagic species of Japanese anchovy, scaly hairfin anchovy, and Japanese sardinella Sardinella zunasi (Bleeker 1854) flourished in the 1980s; Japanese anchovy was found to be the most abundant species in the Yellow Sea in 1986, but thereafter a targeted fishery rapidly developed (Jin and Tang, 1996; Zhao et al., 2003). The high level of exploitation exceeded the resilience of the Japanese anchovy population, leading to a dramatic drop in the stock, from 2.16 million tons in 1987 to 0.18 million tons in 2002 (Zhao et al., 2003).
In the present study, we found that the dominant species composition had become more-or-less equally distributed compared to the overwhelming dominance of Japanese anchovy during 1985–2002 (Xu and Jin, 2005). Japanese anchovy still appears to be a key species in the central and southern Yellow Sea, its weight percentage was not as high as prior to 2000, although it showed a surge in 2008. Meanwhile, the weight percentages of the anglerfish and Tanaka's snailfish rose, and together with Japanese anchovy, these species formed a combination that commonly dominated the whole fish community, with their individual percentages ranging from 35.7% to 82.1% (2003–2015). The weight percentages of silver pomfret fluctuated slightly between the sample years; small yellow croaker was a dominant species before 2010; and, Pacific cod has recovered to some degree since 2009. Other species like smallhead hairtail, scaly hairfin anchovy, Osbeck's grenadier anchovy and chub mackerel performed occasionally as dominant species.
Many factors likely contributed to the rise in weight percentages of the anglerfish and Tanaka's snailfish. First, both species have wide feeding habits. The prey species of the anglerfish are numerous and vary based on habitats; this lessens the possibility for drastic changes of the anglerfish resource from the fluctuations of single prey species (Zhang et al., 2010); Tanaka's snailfish is omnivorous, has a high feeding intensity, and probably has the highest rate of food consumption among the Yellow Sea fishes (Xue et al., 2007). Secondly, top carnivorous species such as Spanish mackerel Scomberomorus niphonius (Cuvier 1832), whitespotted conger, and largehead hairtail had been replaced by the anglerfish and Tanaka's snailfish whose trophic level reaching 4.4 and 4.2, respectively, in an analysis of the Yellow Sea's food web (Zhang and Tang, 2004). Fluctuations in populations of top predators can greatly influence the abundance of other species through the top-down effect (Scheffer et al., 2005). Thirdly, the anglerfish and Tanaka's snailfish both benefit as a result of their particular reproductive strategies. Anglerfish produce egg veils, which aids flotation, nutrition support and fertilization of the eggs (Armstrong, 1992; Zhang et al., 2011b). No significant differences (P > 0.05) were found in the fecundity of Tanaka's snailfish in the 2010s compared with those in the 1980s, indicating that the species has a high degree of adaptation to the increasing fishing effort (Shan et al., 2014). Considering the declines in traditional economically important species and Japanese anchovy in particular, the biology of these fast-growing species makes them highly competitive and well-adapted to occupy vacant ecological niches.
4.3 Multivariate analysisMultivariate analysis demonstrated that the survey years could be divided into two groups. However, it is difficult to explain why these specific years grouped together because fish assemblages are influenced by both biotic and abiotic elements, which are complex (Taherizadeh and Sharifinia, 2015). A challenge to the research was a lack of environmental data collected along with the trawl data. Although Group Ⅰ and Group Ⅱ could be well separated by the NMDS and cluster analyses, the survey years all displayed a high level of similarity, reaching 63.71%. Interestingly, the partitioning of groups in the present study was not aligned over time, which was different from what was observed by Xu and Jin (2005). We propose that this may reflect the change of marine ecosystem after the large-scale exploitation of the Japanese anchovy.
4.4 Size-spectra, MIW and CPUE analysesNo significant differences between the slope of size-spectra and fishing effort (Spearman's rho=0.62, P > 0.05, n=10) were found, although fishing effort steadily increased with years. The slope of the sizespectra usually has a negative correlation with fishing effort, and it has often been used as an indicator to reflect the status of exploited species in other studies (Greenstreet and Hall, 1996; Rice and Gislason, 1996; Gislason and Rice, 1998; Bianchi et al., 2000). Xu and Jin (2005) pointed out that the population dynamics of Japanese anchovy covered the variations in size-spectra of the fish community. To remove this influence, the correlation coefficient of fishing effort and the slope of the size-spectra was recalculated excluding Japanese anchovy. Still, the results showed no significant differences (Spearman's rho=0.47, P > 0.05, n=10). This inconsistency between the slope of size-spectra and fishing effort has been found in comparable research (Benoıt and Rochet, 2004; Shin and Cury, 2004). To use the slope of size-spectra versus another index as an indicator of fishing effort merits further investigation.
Although the negative correlation between MIW and years was not significant for some species, the Gtest showed that the MIW of the whole fish assemblage declined significantly (P < 0.05) over time, from 2003 to 2015. This is consistent with the findings of Xu and Jin (2005) for the period 1985–2002. Hence, the trend for decreasing MIW over time has not improved. Furthermore, a significant reduction (P < 0.05) in CPUE was observed for 2003–2015 in this study, yet not for 1985–2002 by Xu and Jin (2005). This phenomenon warrants special attention because it occurred not only for some of the traditional economically important species, like largehead hairtail and small yellow croaker, but also for some small-sized and low-value species, like skinnycheek lanternfish and glowbelly. Indicator-based analyses to assess long-term changes in the status of coastal fishes in the Baltic Sea showed a generally 'deteriorating' status during the past three decades, yet have pointed towards an 'improving' status in recent years, which may be due to an improved quality of coastal habitat and/or better controls of fishing intensity (Bergström et al., 2016). Thus, coordinated local measures may provide a new way to improve the overall status of coastal fishes.
5 CONCLUSIONThis work used trawl data to examine fish diversity and community structure from 2003 to 2015 in the central and southern Yellow Sea. Fish assemblage indices fluctuated without clear trends from 2003 to 2015, although strong positive and significant correlations were observed among the five indices. Japanese anchovy, anglerfish, Tanaka's snailfish, silver pomfret, and small yellow croaker were the top-five dominant species during the survey years. There was a high level of similarity (63.71%) among all years. No consistent trends were found in intercept and slope (P > 0.05) in size-spectra analysis. There were also no significant differences (P > 0.05) between the slope of size-spectra and fishing effort. Lastly, both the CPUE and MIW analyses of the whole fish assemblage showed a significantly decreasing tendency over time (P < 0.05).
6 ACKNOWLEDGEMENTWe would like to acknowledge the crew of R/V Beidou for their efforts in field sampling. We are also grateful to two anonymous reviewers and our colleagues who provided useful comments on the manuscript.
Armstrong M P, Musick J A, Colvocoresses J A. 1992. Age, growth, and reproduction of the goosefish Lophius americanus (Pisces:Lophiiformes). Fishery Bulletin, 90(2): 217-230. |
Benoıt E, Rochet M J. 2004. A continuous model of biomass size spectra governed by predation and the effects of fishing on them. Journal of Theoretical Biology, 226(1): 9-21. DOI:10.1016/S0022-5193(03)00290-X |
Bergström L, Heikinheimo O, Svirgsden R, Kruze E, Ložys L, Lappalainen A, Saks L, Minde A, Dainys J, Jakubavičiūtė E, Ådjers K, Olsson J. 2016. Long term changes in the status of coastal fish in the Baltic Sea. Estuarine, Coastal and Shelf Science, 169: 169-74. |
Bianchi G, Gislason H, Graham K, Hill L, Jin X, Koranteng K, Manickchand-Heileman S, Payá I, Sainsbury K, Sanchez F, Zwanenburg K. 2000. Impact of fishing on size composition and diversity of demersal fish communities. ICES Journal of Marine Science, 57(3): 558-571. DOI:10.1006/jmsc.2000.0727 |
Chen C T A. 2009. Chemical and physical fronts in the Bohai, Yellow and East China seas. Journal of Marine Systems, 78(3): 394-410. DOI:10.1016/j.jmarsys.2008.11.016 |
Clarke K R, Gorley R N. 2001. Primer v5: User Manual/Tutorial. PRIMER-E, Plymouth UK. p. 91.
|
Clarke K R, Warwick R M. 2001. Change in Marine Communities: An Approach to Statistical Analysis and Interpretation. 2nd edn. PRIMER-E Ltd., Plymouth UK. p. 172.
|
Clarke K R. 1993. Non-parametric multivariate analyses of changes in community structure. Austral Ecology, 18(1): 117-143. DOI:10.1111/aec.1993.18.issue-1 |
Deng J Y, Zhao C Y. 1991. Marine Fisheries Biology. Agriculture Press, Beijing, China. p.19-518.
|
Dethlefsen V, Tiews K. 1985. Review on the effects of pollution on marine fish life and fisheries in the North Sea. Journal of Applied Ichthyology, 1(3): 97-118. DOI:10.1111/jai.1985.1.issue-3 |
Felsenstein J. 1985. Confidence limits on phylogenies: an approach using the bootstrap. Evolution, 39(4): 783-791. DOI:10.1111/j.1558-5646.1985.tb00420.x |
Genner M J, Sims D W, Southward A J, Budd G C, Masterson P, Mchugh M, Rendle P, Southall E J, Wearmouth V J, Hawkins S J. 2010. Body size-dependent responses of a marine fish assemblage to climate change and fishing over a century-long scale. Global Change Biology, 16(2): 517-527. DOI:10.1111/gcb.2010.16.issue-2 |
Gislason H, Rice J. 1998. Modelling the response of size and diversity spectra of fish assemblages to changes in exploitation. ICES Journal of Marine Science, 55(3): 362-370. DOI:10.1006/jmsc.1997.0323 |
Greenstreet S P R, Hall S J. 1996. Fishing and the ground-fish assemblage structure in the north-western North Sea: an analysis of long-term and spatial trends. Journal of Animal Ecology, 65(5): 577-598. DOI:10.2307/5738 |
Hill M O. 1973. Diversity and evenness: a unifying notation and its consequences. Ecology, 54(2): 427-432. DOI:10.2307/1934352 |
Huang J S, Sun Y, Jia H B, Yang Q, Tang Q S. 2014. Spatial distribution and reconstruction potential of Japanese anchovy (Engraulis japonicus) based on scale deposition records in recent anaerobic sediment of the Yellow Sea and East China Sea. Acta Oceanologica Sinica, 33(12): 138-144. DOI:10.1007/s13131-014-0573-8 |
Ihaka R, Gentleman R. 1996. R: a language for data analysis and graphics. Journal of Computational and Graphical Statistics, 5: 5-299. |
Jennings S, Dinmore T A, Duplisea D E, Warr K J, Lancaster J E. 2001. Trawling disturbance can modify benthic production processes. Journal of Animal Ecology, 70(3): 459-475. DOI:10.1046/j.1365-2656.2001.00504.x |
Jin X S, Tang Q S. 1996. Changes in fish species diversity and dominant species composition in the Yellow Sea. Fisheries Research, 26(3-4): 337-352. DOI:10.1016/0165-7836(95)00422-X |
Jin X S, Xu B D, Tang Q S. 2003. Fish assemblage structure in the East China Sea and southern Yellow Sea during autumn and spring. Journal of Fish Biology, 62(5): 1194-1205. DOI:10.1046/j.1095-8649.2003.00116.x |
Jin X S. 2003. The change of community structure of nekton in the waters offsouthern Shandong Peninsula in spring. Journal of Fisheries of China, 27(1): 19-24. |
Kamrani E, Sharifinia M, Hashemi S H. 2016. Analyses of fish community structure changes in three subtropical estuaries from the Iranian coastal waters. Marine Biodiversity, 46(3): 561-577. DOI:10.1007/s12526-015-0398-5 |
Keesing J K, Liu D Y, Fearns P, Garcia R. 2011. Inter-and intra-annual patterns of Ulva prolifera green tides in the Yellow Sea during 2007-2009, their origin and relationship to the expansion of coastal seaweed aquaculture in China. Marine Pollution Bulletin, 62(6): 1169-1182. DOI:10.1016/j.marpolbul.2011.03.040 |
Li Z L, Shan X J, Jin X S, Dai F Q. 2011. Long-term variations in body length and age at maturity of the small yellow croaker (Larimichthys polyactis Bleeker, 1877) in the Bohai Sea and the Yellow Sea, China. Fisheries Research, 110(1): 67-74. DOI:10.1016/j.fishres.2011.03.013 |
Lie H J, Cho C H, Jung K T. 2015. Occurrence of large temperature inversion in the thermohaline frontal zone at the Yellow Sea entrance in winter and its relation to advection. Journal of Geophysical Research, 120(1): 417-435. |
Lin X P, Yang J Y, Guo J S, Zhang Z X, Yin Y Q, Song X Z, Zhang X H. 2011. An asymmetric upwind flow, Yellow Sea Warm Current: 1. New observations in the western Yellow Sea. Journal of Geophysical Research, 116(C4): C04026. |
Liu X, Huang B Q, Huang Q, Wang L, Ni X B, Tang Q S, Sun S, Wei H, Liu S M, Li C L, Sun J. 2015. Seasonal phytoplankton response to physical processes in the southern Yellow Sea. Journal of Sea Research, 95: 45-55. DOI:10.1016/j.seares.2014.10.017 |
Liu Y, Li S F, Chen X G, Cheng J H. 2007. The structure and diversity of demersal fish communities in winter 2000 in the East China Sea and the Yellow Sea. Marine Sciences, 31(10): 19-24. |
Margalef R. 1958. Information theory in ecology. General Systems, 3: 3-36. |
McDonald J H. 2014. Handbook of Biological Statistics. 3rd edn. Sparky House, Baltimore, Maryland. p. 68-76.
|
McLusky D S, Bryant D M, Elliott M. 1992. The impact of land-claim on macrobenthos, fish and shorebirds on the forth estuary, eastern Scotland. Aquatic Conservation Marine and Freshwater Ecosystems, 2(3): 211-222. DOI:10.1002/(ISSN)1099-0755 |
Mei X, Li R H, Zhang X H, Liu Q S, Liu J X, Wang Z B, Lan X H, Liu J, Sun R T. 2016. Evolution of the Yellow Sea Warm current and the Yellow Sea cold water mass since the middle Pleistocene. Palaeogeography, Palaeoclimatology, Palaeoecology, 442: 442-48. |
Olsson J, Bergström L, Gårdmark A. 2012. Abiotic drivers of coastal fish community change during four decades in the Baltic Sea. ICES Journal of Marine Science, 69(6): 961-970. DOI:10.1093/icesjms/fss072 |
Pielou E C. 1975. Ecological Diversity. Wiley, New York.
|
Qin Y S, Zhao Y Y, Chen L R, Zhao S L. 1989. Geology of the Yellow Sea. China Ocean Press, Beijing. p.1-289.
|
Qiu Y S. 1988. The regional changes of fish community on the northern continental shelf of South China Sea. Journal of Fisheries of China, 12(4): 303-313. |
Rice J, Gislason H. 1996. Patterns of change in the size spectra of numbers and diversity of the North Sea fish assemblage, as reflected in surveys and models. ICES Journal of Marine Science, 53(6): 1214-1225. DOI:10.1006/jmsc.1996.0146 |
Salas F, Marcos C, Neto J M, Patrício J, Pérez-Ruzafa A, Marques J C. 2006. User-friendly guide for using benthic ecological indicators in coastal and marine quality assessment. Ocean & Coastal Management, 49(5-6): 308-331. |
Scheffer M, Carpenter S, de Young B. 2005. Cascading effects of overfishing marine systems. Trends in Ecology & Evolution, 20(11): 579-581. |
Shan X J, Chen Y L, Zhou Z P, Dai F Q, Jin X S. 2014. Interannual variations in propagational biological characteristics of Liparis tanakae in central and southern Yellow Sea. Progress in Fishery Sciences, 35(3): 1-8. |
Shan X J, Jin X S, Zhou Z P, Dai F Q. 2012. Stock dynamics of Cleisthenes herzensteini in the central and southern Yellow Sea. Acta Ecologica Sinica, 32(5): 244-252. DOI:10.1016/j.chnaes.2012.07.010 |
Shin Y J, Cury P. 2004. Using an individual-based model of fish assemblages to study the response of size spectra to changes in fishing. Canadian Journal of Fisheries and Aquatic Sciences, 61(3): 414-431. DOI:10.1139/f03-154 |
Stefansdottir L, Solmundsson J, Marteinsdottir G, Kristinsson K, Jonasson J P. 2010. Groundfish species diversity and assemblage structure in Icelandic waters during recent years of warming. Fisheries Oceanography, 19(1): 42-62. DOI:10.1111/(ISSN)1365-2419 |
Taherizadeh M, Sharifinia M. 2015. Applicability of ecological benthic health evaluation tools to three subtropical estuaries (Azini, Jask and Khalasi) from the Iranian coastal waters. Environmental Earth Sciences, 74(4): 3485-3499. DOI:10.1007/s12665-015-4385-8 |
Wang X H, Xue Y, Ren Y P. 2013. Length-weight relationships of 43 fish species from Haizhou Bay, central Yellow Sea. Journal of Applied Ichthyology, 29(5): 1183-1187. DOI:10.1111/jai.2013.29.issue-5 |
Wei H, Shi J, Lu Y Y, Peng Y. 2010. Interannual and long-term hydrographic changes in the Yellow Sea during 1977-1998. Deep Sea Research Part Ⅱ: Topical Studies in Oceanography, 57(11-12): 1025-1034. DOI:10.1016/j.dsr2.2010.02.004 |
Wilhm J L. 1968. Use of biomass units in Shannon's formula. Ecology, 49(1): 153-156. DOI:10.2307/1933573 |
Xu B D, Jin X S, Liang Z L. 2005. The taxonomic diversity of fish communities in the Yellow Sea. Periodical of Ocean University of China, 35(4): 629-634. |
Xu B D, Jin X S. 2005. Variations in fish community structure during winter in the southern Yellow Sea over the period 1985-2002. Fisheries Research, 71(1): 79-91. DOI:10.1016/j.fishres.2004.07.011 |
Xue Y, Jin X S, Zhao X Y, Liang Z L, Li X S. 2007. Food consumption by the fish community in the central and southern Yellow Sea in autumn. Periodical of Ocean University of China, 37(1): 75-82. |
Yuan H M, Song J M, Li X G, Li N, Duan L Q. 2012. Distribution and contamination of heavy metals in surface sediments of the South Yellow Sea. Marine Pollution Bulletin, 64(10): 2151-2159. DOI:10.1016/j.marpolbul.2012.07.040 |
Zar J H. 1984. Biostatistical Analysis. 2nd edn. Prentice-Hall, Englewood Cliffs, New Jersey.
|
Zhang B, Tang Q S, Jin X S. 2007. Decadal-scale variations of trophic levels at high trophic levels in the Yellow Sea and the Bohai Sea ecosystem. Journal of Marine Systems, 67(3-4): 304-311. DOI:10.1016/j.jmarsys.2006.04.015 |
Zhang B, Tang Q S. 2004. Study on trophic level of important resources species at high trophic levels in the Bohai Sea, Yellow Sea and East China Sea. Advances in Marine Science, 22(4): 393-404. |
Zhang B, Wu Q, Niu M X, Jin X S. 2011a. Variation in feeding ecology within the fish community in the north Yellow Sea. Journal of Fishery Sciences of China, 18(6): 1343-1350. |
Zhang X J, Cheng J H, Shen W, Liu Z L, Yuan X W. 2011b. Reproductive biology of yellow goosefish Lophius litulon. Journal of Fishery Sciences of China, 18(2): 290-298. |
Zhang X J, Cheng J H, Shen W, Liu Z L. 2010. Feeding ecology of Lophius litulon in the south of Yellow Sea. Acta Ecologica Sinica, 30(12): 3117-3125. |
Zhao X Y, Hamre J, Li F, Jin X S, Tang Q S. 2003. Recruitment, sustainable yield and possible ecological consequences of the sharp decline of the anchovy (Engraulis japonicus) stock in the Yellow Sea in the 1990s. Fisheries Oceanography, 12(4-5): 495-501. DOI:10.1046/j.1365-2419.2003.00262.x |
Zhao X Y. 2006. Population dynamic characteristics and sustainable utilization of the anchovy stock in the Yellow Sea. Ocean University of China, Qingdao. p. 1-18. (in Chinese)
|
Zhu X H, Wu H Z, Xu F S, Ye M Z, Zhao Z J. 1994. The study on biodiversity and related factors of nekton community structure in the coastal waters of Yellow Sea and Bohai Sea. Acta Oceanologica Sinica, 16(3): 102-112. |
| Armstrong M P, Musick J A, Colvocoresses J A, 1992. Age, growth, and reproduction of the goosefish Lophius americanus (Pisces:Lophiiformes). Fishery Bulletin, 90(2): 217–230. |
| Benoıt E, Rochet M J, 2004. A continuous model of biomass size spectra governed by predation and the effects of fishing on them. Journal of Theoretical Biology, 226(1): 9–21. Doi: 10.1016/S0022-5193(03)00290-X |
| Bergström L, Heikinheimo O, Svirgsden R, Kruze E, Ložys L, Lappalainen A, Saks L, Minde A, Dainys J, Jakubavičiūtė E, Ådjers K, Olsson J, 2016. Long term changes in the status of coastal fish in the Baltic Sea. Estuarine, Coastal and Shelf Science, 169: 169–74. |
| Bianchi G, Gislason H, Graham K, Hill L, Jin X, Koranteng K, Manickchand-Heileman S, Payá I, Sainsbury K, Sanchez F, Zwanenburg K, 2000. Impact of fishing on size composition and diversity of demersal fish communities. ICES Journal of Marine Science, 57(3): 558–571. Doi: 10.1006/jmsc.2000.0727 |
| Chen C T A, 2009. Chemical and physical fronts in the Bohai, Yellow and East China seas. Journal of Marine Systems, 78(3): 394–410. Doi: 10.1016/j.jmarsys.2008.11.016 |
| Clarke K R, Gorley R N. 2001. Primer v5: User Manual/Tutorial. PRIMER-E, Plymouth UK. p. 91. |
| Clarke K R, Warwick R M. 2001. Change in Marine Communities: An Approach to Statistical Analysis and Interpretation. 2nd edn. PRIMER-E Ltd., Plymouth UK. p. 172. |
| Clarke K R, 1993. Non-parametric multivariate analyses of changes in community structure. Austral Ecology, 18(1): 117–143. Doi: 10.1111/aec.1993.18.issue-1 |
| Deng J Y, Zhao C Y, 1991. Marine Fisheries Biology. Agriculture Press, Beijing, Chinap.19-518. |
| Dethlefsen V, Tiews K, 1985. Review on the effects of pollution on marine fish life and fisheries in the North Sea. Journal of Applied Ichthyology, 1(3): 97–118. Doi: 10.1111/jai.1985.1.issue-3 |
| Felsenstein J, 1985. Confidence limits on phylogenies: an approach using the bootstrap. Evolution, 39(4): 783–791. Doi: 10.1111/j.1558-5646.1985.tb00420.x |
| Genner M J, Sims D W, Southward A J, Budd G C, Masterson P, Mchugh M, Rendle P, Southall E J, Wearmouth V J, Hawkins S J, 2010. Body size-dependent responses of a marine fish assemblage to climate change and fishing over a century-long scale. Global Change Biology, 16(2): 517–527. Doi: 10.1111/gcb.2010.16.issue-2 |
| Gislason H, Rice J, 1998. Modelling the response of size and diversity spectra of fish assemblages to changes in exploitation. ICES Journal of Marine Science, 55(3): 362–370. Doi: 10.1006/jmsc.1997.0323 |
| Greenstreet S P R, Hall S J, 1996. Fishing and the ground-fish assemblage structure in the north-western North Sea: an analysis of long-term and spatial trends. Journal of Animal Ecology, 65(5): 577–598. Doi: 10.2307/5738 |
| Hill M O, 1973. Diversity and evenness: a unifying notation and its consequences. Ecology, 54(2): 427–432. Doi: 10.2307/1934352 |
| Huang J S, Sun Y, Jia H B, Yang Q, Tang Q S, 2014. Spatial distribution and reconstruction potential of Japanese anchovy (Engraulis japonicus) based on scale deposition records in recent anaerobic sediment of the Yellow Sea and East China Sea. Acta Oceanologica Sinica, 33(12): 138–144. Doi: 10.1007/s13131-014-0573-8 |
| Ihaka R, Gentleman R, 1996. R: a language for data analysis and graphics. Journal of Computational and Graphical Statistics, 5: 5–299. |
| Jennings S, Dinmore T A, Duplisea D E, Warr K J, Lancaster J E, 2001. Trawling disturbance can modify benthic production processes. Journal of Animal Ecology, 70(3): 459–475. Doi: 10.1046/j.1365-2656.2001.00504.x |
| Jin X S, Tang Q S, 1996. Changes in fish species diversity and dominant species composition in the Yellow Sea. Fisheries Research, 26(3-4): 337–352. Doi: 10.1016/0165-7836(95)00422-X |
| Jin X S, Xu B D, Tang Q S, 2003. Fish assemblage structure in the East China Sea and southern Yellow Sea during autumn and spring. Journal of Fish Biology, 62(5): 1194–1205. Doi: 10.1046/j.1095-8649.2003.00116.x |
| Jin X S, 2003. The change of community structure of nekton in the waters offsouthern Shandong Peninsula in spring. Journal of Fisheries of China, 27(1): 19–24. |
| Kamrani E, Sharifinia M, Hashemi S H, 2016. Analyses of fish community structure changes in three subtropical estuaries from the Iranian coastal waters. Marine Biodiversity, 46(3): 561–577. Doi: 10.1007/s12526-015-0398-5 |
| Keesing J K, Liu D Y, Fearns P, Garcia R, 2011. Inter-and intra-annual patterns of Ulva prolifera green tides in the Yellow Sea during 2007-2009, their origin and relationship to the expansion of coastal seaweed aquaculture in China. Marine Pollution Bulletin, 62(6): 1169–1182. Doi: 10.1016/j.marpolbul.2011.03.040 |
| Li Z L, Shan X J, Jin X S, Dai F Q, 2011. Long-term variations in body length and age at maturity of the small yellow croaker (Larimichthys polyactis Bleeker, 1877) in the Bohai Sea and the Yellow Sea, China. Fisheries Research, 110(1): 67–74. Doi: 10.1016/j.fishres.2011.03.013 |
| Lie H J, Cho C H, Jung K T, 2015. Occurrence of large temperature inversion in the thermohaline frontal zone at the Yellow Sea entrance in winter and its relation to advection. Journal of Geophysical Research, 120(1): 417–435. |
| Lin X P, Yang J Y, Guo J S, Zhang Z X, Yin Y Q, Song X Z, Zhang X H, 2011. An asymmetric upwind flow, Yellow Sea Warm Current: 1. New observations in the western Yellow Sea. Journal of Geophysical Research, 116(C4): C04026. |
| Liu X, Huang B Q, Huang Q, Wang L, Ni X B, Tang Q S, Sun S, Wei H, Liu S M, Li C L, Sun J, 2015. Seasonal phytoplankton response to physical processes in the southern Yellow Sea. Journal of Sea Research, 95: 45–55. Doi: 10.1016/j.seares.2014.10.017 |
| Liu Y, Li S F, Chen X G, Cheng J H, 2007. The structure and diversity of demersal fish communities in winter 2000 in the East China Sea and the Yellow Sea. Marine Sciences, 31(10): 19–24. |
| Margalef R, 1958. Information theory in ecology. General Systems, 3: 3–36. |
| McDonald J H. 2014. Handbook of Biological Statistics. 3rd edn. Sparky House, Baltimore, Maryland. p. 68-76. |
| McLusky D S, Bryant D M, Elliott M, 1992. The impact of land-claim on macrobenthos, fish and shorebirds on the forth estuary, eastern Scotland. Aquatic Conservation Marine and Freshwater Ecosystems, 2(3): 211–222. Doi: 10.1002/(ISSN)1099-0755 |
| Mei X, Li R H, Zhang X H, Liu Q S, Liu J X, Wang Z B, Lan X H, Liu J, Sun R T, 2016. Evolution of the Yellow Sea Warm current and the Yellow Sea cold water mass since the middle Pleistocene. Palaeogeography, Palaeoclimatology, Palaeoecology, 442: 442–48. |
| Olsson J, Bergström L, Gårdmark A, 2012. Abiotic drivers of coastal fish community change during four decades in the Baltic Sea. ICES Journal of Marine Science, 69(6): 961–970. Doi: 10.1093/icesjms/fss072 |
| Pielou E C. 1975. Ecological Diversity. Wiley, New York. |
| Qin Y S, Zhao Y Y, Chen L R, Zhao S L, 1989. Geology of the Yellow Sea. China Ocean Press, Beijingp.1-289. |
| Qiu Y S, 1988. The regional changes of fish community on the northern continental shelf of South China Sea. Journal of Fisheries of China, 12(4): 303–313. |
| Rice J, Gislason H, 1996. Patterns of change in the size spectra of numbers and diversity of the North Sea fish assemblage, as reflected in surveys and models. ICES Journal of Marine Science, 53(6): 1214–1225. Doi: 10.1006/jmsc.1996.0146 |
| Salas F, Marcos C, Neto J M, Patrício J, Pérez-Ruzafa A, Marques J C, 2006. User-friendly guide for using benthic ecological indicators in coastal and marine quality assessment. Ocean & Coastal Management, 49(5-6): 308–331. |
| Scheffer M, Carpenter S, de Young B, 2005. Cascading effects of overfishing marine systems. Trends in Ecology & Evolution, 20(11): 579–581. |
| Shan X J, Chen Y L, Zhou Z P, Dai F Q, Jin X S, 2014. Interannual variations in propagational biological characteristics of Liparis tanakae in central and southern Yellow Sea. Progress in Fishery Sciences, 35(3): 1–8. |
| Shan X J, Jin X S, Zhou Z P, Dai F Q, 2012. Stock dynamics of Cleisthenes herzensteini in the central and southern Yellow Sea. Acta Ecologica Sinica, 32(5): 244–252. Doi: 10.1016/j.chnaes.2012.07.010 |
| Shin Y J, Cury P, 2004. Using an individual-based model of fish assemblages to study the response of size spectra to changes in fishing. Canadian Journal of Fisheries and Aquatic Sciences, 61(3): 414–431. Doi: 10.1139/f03-154 |
| Stefansdottir L, Solmundsson J, Marteinsdottir G, Kristinsson K, Jonasson J P, 2010. Groundfish species diversity and assemblage structure in Icelandic waters during recent years of warming. Fisheries Oceanography, 19(1): 42–62. Doi: 10.1111/(ISSN)1365-2419 |
| Taherizadeh M, Sharifinia M, 2015. Applicability of ecological benthic health evaluation tools to three subtropical estuaries (Azini, Jask and Khalasi) from the Iranian coastal waters. Environmental Earth Sciences, 74(4): 3485–3499. Doi: 10.1007/s12665-015-4385-8 |
| Wang X H, Xue Y, Ren Y P, 2013. Length-weight relationships of 43 fish species from Haizhou Bay, central Yellow Sea. Journal of Applied Ichthyology, 29(5): 1183–1187. Doi: 10.1111/jai.2013.29.issue-5 |
| Wei H, Shi J, Lu Y Y, Peng Y, 2010. Interannual and long-term hydrographic changes in the Yellow Sea during 1977-1998. Deep Sea Research Part Ⅱ: Topical Studies in Oceanography, 57(11-12): 1025–1034. Doi: 10.1016/j.dsr2.2010.02.004 |
| Wilhm J L, 1968. Use of biomass units in Shannon's formula. Ecology, 49(1): 153–156. Doi: 10.2307/1933573 |
| Xu B D, Jin X S, Liang Z L, 2005. The taxonomic diversity of fish communities in the Yellow Sea. Periodical of Ocean University of China, 35(4): 629–634. |
| Xu B D, Jin X S, 2005. Variations in fish community structure during winter in the southern Yellow Sea over the period 1985-2002. Fisheries Research, 71(1): 79–91. Doi: 10.1016/j.fishres.2004.07.011 |
| Xue Y, Jin X S, Zhao X Y, Liang Z L, Li X S, 2007. Food consumption by the fish community in the central and southern Yellow Sea in autumn. Periodical of Ocean University of China, 37(1): 75–82. |
| Yuan H M, Song J M, Li X G, Li N, Duan L Q, 2012. Distribution and contamination of heavy metals in surface sediments of the South Yellow Sea. Marine Pollution Bulletin, 64(10): 2151–2159. Doi: 10.1016/j.marpolbul.2012.07.040 |
| Zar J H. 1984. Biostatistical Analysis. 2nd edn. Prentice-Hall, Englewood Cliffs, New Jersey. |
| Zhang B, Tang Q S, Jin X S, 2007. Decadal-scale variations of trophic levels at high trophic levels in the Yellow Sea and the Bohai Sea ecosystem. Journal of Marine Systems, 67(3-4): 304–311. Doi: 10.1016/j.jmarsys.2006.04.015 |
| Zhang B, Tang Q S, 2004. Study on trophic level of important resources species at high trophic levels in the Bohai Sea, Yellow Sea and East China Sea. Advances in Marine Science, 22(4): 393–404. |
| Zhang B, Wu Q, Niu M X, Jin X S, 2011a. Variation in feeding ecology within the fish community in the north Yellow Sea. Journal of Fishery Sciences of China, 18(6): 1343–1350. |
| Zhang X J, Cheng J H, Shen W, Liu Z L, Yuan X W, 2011b. Reproductive biology of yellow goosefish Lophius litulon. Journal of Fishery Sciences of China, 18(2): 290–298. |
| Zhang X J, Cheng J H, Shen W, Liu Z L, 2010. Feeding ecology of Lophius litulon in the south of Yellow Sea. Acta Ecologica Sinica, 30(12): 3117–3125. |
| Zhao X Y, Hamre J, Li F, Jin X S, Tang Q S, 2003. Recruitment, sustainable yield and possible ecological consequences of the sharp decline of the anchovy (Engraulis japonicus) stock in the Yellow Sea in the 1990s. Fisheries Oceanography, 12(4-5): 495–501. Doi: 10.1046/j.1365-2419.2003.00262.x |
| Zhao X Y. 2006. Population dynamic characteristics and sustainable utilization of the anchovy stock in the Yellow Sea. Ocean University of China, Qingdao. p. 1-18. (in Chinese) |
| Zhu X H, Wu H Z, Xu F S, Ye M Z, Zhao Z J, 1994. The study on biodiversity and related factors of nekton community structure in the coastal waters of Yellow Sea and Bohai Sea. Acta Oceanologica Sinica, 16(3): 102–112. |