 2018, Vol. 36
Institute of Oceanology, Chinese Academy of Sciences
Article Information
- XU Kuipeng(徐奎鹏), TANG Xianghai(唐祥海), WANG Lu(王璐), YU Xinzi(于欣孜), SUN Peipei(孙佩佩), MAO Yunxiang(茅云翔)
- Divergence time, historical biogeography and evolutionary rate estimation of the order Bangiales (Rhodophyta) inferred from multilocus data
- Chinese Journal of Oceanology and Limnology, 36(3): 870-881
- http://dx.doi.org/10.1007/s00343-018-7054-4
Article History
- Received Feb. 24, 2017
- accepted in principle Apr. 11, 2017
- accepted for publication May. 27, 2017


2 Laboratory for Marine Biology and Biotechnology, Qingdao National Laboratory for Marine Science and Technology, Qingdao 266000, China
The red algae (Rhodophyta) have been divided into two subphyla, the Rhodophytina and Cyanidiophytina, which are further classified into seven classes, the Bangiophyceae, Compsopogonophyceae, Florideophyceae, Porphyridiophyceae, Rhodellophyceae, Stylonematophyceae and Cyanidiophyceae (Yoon et al., 2006). The Bangiophyceae include only one order, Bangiales, and one family, Bangiaceae, which has been suggested to be monophyletic (Müller et al., 2001). Sutherland et al. (2011) revised the order Bangiales to include at least fifteen genus-level taxa (Bangia, 'Bangia' 1, 'Bangia' 2, 'Bangia' 3, Boreophyllum, Clymene, Dione, Fuscifolium, Lysithea, Minerva, Miuraea, Porphyra, Pseudobangia, Pyropia, and Wildemania). Bangiales have been classified as an ancient lineage, based on a 1 200 million-year-old (Ma) fossil of Bangiomorpha pubescens, a Bangialike taxon (Butterfield, 2000). However, Porphyralike fossils have been found in rocks dated at approximately 425 Ma (Blouin et al., 2011). Yoon et al. (2004) estimated the evolutionary timeline using a six-gene data set, and suggested ca. 800 Ma for the divergence of the Florideophyceae from the Bangiales. However, the multicellular holdfast of Bangiomorpha pubescens has greater similarity to Erythrotrichia than to Bangia. It is possible that Bangiomorpha evolved as an extinct lineage in parallel to the Bangiophyceae and Compsopogonophyceae (Yang et al., 2016). Although previous molecular studies have produced robust phylogenies of the Bangiales, divergence time estimation of this order has rarely been addressed.
Species of Bangiales include the most economically important marine crops grown worldwide from tropical to polar seas. Previous research suggested that the center of diversity of Bangiales was in the Northern Hemisphere, particularly the North Pacific (Conway et al., 1975). As more taxa have been described worldwide, New Zealand, in the Southern Hemisphere, has more recently been regarded as a center of Bangiales diversity (Broom et al., 2004). Aspects of the historical distributions of this group may be of interest, such as: the origin of the lineage, ancestral distribution and the factors that shaped the composition and distribution of this clade over time. Many studies have addressed biogeographic questions using phylogenetic analyses, molecular dating, and reconstruction of ancestral biogeography (Dumont et al., 2005; Deng et al., 2015; Berger et al., 2016). However, to date, no molecular systematic study has been performed to determine the historical biogeography of the Bangiales.
The Bangiales comprise approximately 190 species, only 0.43% of currently described species of Rhodophyta. Florideophyceae is the most taxon-rich class of the Rhodophyta (95% of described Rhodophyte species) (Guiry and Guiry, 2017). Species diversification represents the balance between speciation and extinction rates that gave rise to the extant diversity of a clade. Studies have suggested that diversification is somehow linked to rates molecular evolution over time (Barraclough and Savolainen, 2001; Webster et al., 2003; Davies et al., 2004). Various types of abrupt genomic disruption can play an important role in promoting speciation via reproductive isolation (Venditti and Pagel, 2010). Collinearity analysis of Bangiales plastid genomes indicated a highly conservative genome structure (Janouškovec et al., 2013; Lee et al., 2016), but the evolutionary rate at the nucleotide level in this group is unknown. In accordance with the central dogma of molecular biology, the protein-coding gene mutation rate has classically been regarded as a major unit of evolution. A previous study predicted that the evolutionary rate at neutral sites corresponds to the actual mutation rate if synonymous sites are assumed to be neutrally evolving (Kimura, 1984). Studies on the relative synonymous-site substitution rates (dS) of plastid DNA (ptDNA), mitochondrial DNA (mtDNA) and nuclear DNA (nDNA) from different lineages have provided insight into genome evolution (Buschiazzo et al., 2012; Leliaert et al., 2012; Smith, 2015). Moreover, in pairwise comparisons of orthologous genes, ratios of dN to dS (dN/dS) give an indication of the mode and strength of selection, where dN/dS > 1 suggests adaptive selection and dN/dS < 1 indicates purifying selection. The rate of molecular evolution may help us to better understand the speciation and environmental adaptation of Bangiales.
In this study, all available Bangiales organellar genomes (10 ptDNA and 11 mtDNA genomes) as well as the plastid RUBISCO LSU (rbcL) and nuclear SSU rRNA (nrSSU) gene sequences of 162 Bangiales species were downloaded from the GenBank database to 1) reconstruct phylogenetic relationships among the representative species, 2) estimate divergence times, 3) clarify the historical biogeography, and 4) identify the relative substitution rates of the Bangiales species.
2 MATERIAL AND METHOD 2.1 Phylogenetic analyses and divergence time estimationOrganellar genome data were downloaded from the GeneBank database (Table S1). To determine the phylogenetic relationships among Bangiales species, the concatenated protein-coding amino acid sequences from both plastid and mitochondrial genomes were used to construct phylogenetic trees (Table S2). We used the all-versus-all blast to select single copy homologous genes with the e-value 1e-5. These protein-coding genes are shared by all of the selected taxa. The Chondrus crispus genome was used as the outgroup. Genome sequences were aligned using the program MAFFT version 5 and adjusted manually (Katoh et al., 2005). The aligned sequences were further trimmed using trimAl with the option 'automated1' (Capella-Gutiérrez et al., 2009). Maximum likelihood (ML) analyses were conducted using RaxML-8.2.4 (Stamatakis, 2014). The best model and parameter settings were chosen according to the Akaike information criterion using ProtTest 3.0 for the ML analyses (Abascal et al., 2005). The ML searches relied on the cpREV+G+I substitution model for plastid sequences and the JTT+G+I substitution model for mitochondrial sequences (-f a, 1 000 bootstrap replicates). The MP trees were constructed with PAUP*4.0b10 (Swofford, 2003). Heuristic searches were conducted using random taxon addition with branch swapping tree bisection and reconnection (TBR). Non-parametric bootstrap analysis was performed with 1 000 replicates with TBR branch swapping. Bayesian analyses were carried out using MrBayes3.2 with the best ProtTest model determined as noted above (Huelsenbeck and Ronquist, 2001). Four independent Markov Chain Monte-Carlo chains were run simultaneously and sampled every 100 generations for a total of 1 000 000 generations. The first 10% of the trees were discarded as "burn-in."
To calculate the divergence times of Bangiales species, a dataset of 66 protein-coding nucleotide sequences from 27 Rhodophyte plastid genomes were selected (Table S2). We used BEAST v1.8.3 with the uncorrelated lognormal relaxed clock model to estimate rate change (Drummond et al., 2012). The best model inferred by ModelTest3.7, GTR+G+I, was used (Posada and Crandall, 1998). The Yule tree prior and unlinked clock models were used across gene regions. We set the most recent common ancestor with a lognormal prior, an offset of 950 Ma, and a standard deviation of 25.0 based on the divergence of the Florideophyceae and Bangiophyceae (Herron et al., 2009; Yang et al., 2016).
2.2 Estimation of substitution ratesThe bidirectional best hit algorithm (BDBH) was used to compile clusters of potential 1:1 orthologous sequences using BLAST with the -e threshold=1e-10 in GET_HOMOLOGUES v2.0.3 (Contreras-Moreira and Vinuesa, 2013). Selected core gene amino acid sequences were aligned with MAFFT and then converted to nucleotide sequences using a Perl script written in house to achieve the codon alignment pattern. Pairwise distances at non-synonymous (dN) and synonymous (dS) sites were estimated for individual genes (Pyropia endiviifolia vs. Pyropia kanakaensis, Porphyra purpurea vs. Porphyra umbilicalis, Cyanidiaceae sp. MX-AZ01 vs. Cyanidioschyzon merolae, Gelidium elegans vs. Gelidium vagum, Gracilaria chilensis vs. Gracilaria salicornia) using codeml (PAML 4.9b) (Yang, 2007), with the maximum likelihood method employed with settings seqtype=1, CodonFreq=2, and Runmode=-2. Rates of substitution at coding sites (μ) were calculated using the following formula:

where d represents the distance at synonymous (dS) or non-synonymous (dN) sites and T represents the divergence time between pairwise comparisons (Buschiazzo et al., 2012). Divergence times were estimated as described above.
2.3 Reconstruction of ancestral areasFor the reconstruction of ancestral areas, rbcL and nrSSU gene sequences of 162 Bangiales species were downloaded from GenBank (Table S3). The Bayesian analysis was conducted as described by Sutherland (Sutherland et al., 2011). Seven biogeographic areas were defined based on the collection information: (A) Southern South America and Antarctica; (B) New Zealand and Australia; (C) Southern Africa; (D) Eastern North America; (E) Western North America; (F) Eastern Asia; (G) Europe. The ancestral area of Bangiales was evaluated using dispersal-vicariance analysis (S-DIVA) by RASP software with two as the maximum number of ancestral areas at each node (Ronquist and Cannatella, 1997; Yu et al., 2010).
3 RESULT 3.1 Phylogenomic analysisTrees were constructed using a dataset of 153 amino acid sequences from 11 plastid genomes and 19 amino acid sequences from 13 mitochondrial genomes to illustrate the evolutionary relationships within Bangiales, and most of the nodes were inferred with strong support using the MP, ML and BI methods. The ptDNA tree showed that the clade uniting Py. endiviifolia formed a sister group with Py. kanakaensis, and Py. yezoensis clustered with Py fucicola. The remaining Py. haitanensis and Py. perforate grouped together. Moreover, Bangia and Porphyra were assigned to the same clade supported by all three methods and they were added to the sister group with Pyropia, leaving Wildemania at the basal node of Bangiales in MP and BI analyses (Fig. 1a). However, the ptDNA ML tree showed that Wildemania formed a sister group with Pyropia first. The topology of mtDNA tree was similar with ptDNA tree (Fig. 1b). The added species Py. tenera was clustered with Py. yezoensis, and then assigned to Py. fucicola with high support. Py. nitida was clustered with Py. endiviifolia and then assigned to Py. kanakaensis. The mtDNA tree showed Wildemania was at the basal node of Bangiales supported by all three methods. On the whole, our results support the (((Bangia, Porphyra) Pyropia) Wildemania) topology.

|
| Figure 1 Phylogenetic relationships of the Bangiales a. tree constructed from a dataset of 153 concatenated protein-coding sequences from 11 plastid genomes; b. tree constructed from a dataset of 18 concatenated protein-coding sequences from 13 mitochondrial genomes. Numbers from left to right represent MP and ML bootstrap and Bayesian posterior probabilities, respectively; "#" represent full support from all methods, and "//" represent the outgroup. Alternative tree branch positions of species are indicated by "-". |
Based on the analysis of aligned nucleotide sequences of Rhodophyte plastid genomes, we estimated divergence times. The results revealed that the multicellular red algae originated in the late Mesoproterozoic to early Neoproterozoic at approximately 1 001.87 Ma (95% HPD=910.27–1 281.12 Ma, PP=0.99). Bangiales diversified ca. 246.40 Ma (95% HPD=194.78–318.24 Ma, PP=0.99), in the Permian and Triassic (Fig. 2a). The Pyropia clade diversified at 121.37 Ma (95% HPD=111.31– 131.40 Ma, PP=1), in the Early Cretaceous, and Porphyra began to diverge from Bangia at 180.51 Ma (95% HPD=165.73–195.31 Ma, PP=1), in the Jurassic (Fig. 2b). In this study, the species Py. endiviifolia diverged from Py. kanakaensis at 68.07 Ma (95% HPD=62.01–73.91 Ma, PP=1), in the Late Cretaceous.

|
| Figure 2 Chronogram of Bangiales based on concatenated protein-coding nucleotide sequences from BEAST a. schematic of the Rhodophyta chronogram calculated from 65 concatenated genes; b. chronogram of Bangiales calculated from 153 concatenated genes. The yellow node values of the trees represent estimated divergence times. |
Ancestral area reconstruction within the Bangiales was conducted using S-DIVA (Ronquist and Cannatella, 1997). Because of the limited organellar genome data, which contained very few Bangiales species from the Southern Hemisphere, the biogeographic analysis was conducted using the plastid rbcL and nrSSU gene sequences of 162 widespread Bangiales species together with the corresponding distribution information (Fig. 3, Table S3). The analysis revealed that Bangiales had a center of origin in eastern Gondwanaland, in the current area encompassing New Zealand and Australia (Oceania) (S-DIVA=0.77). Moreover, the ancestral area of the subgroup Pyropia spread to Eastern Asia (S-DIVA=0.88). Porphyra dispersed to Oceania (S-DIVA=0.85) and "Bangia" dispersed to either Oceania (S-DIVA=0.85) or Western North America (S-DIVA=1.00). The details of the ancestral area distribution as determined based on S-DIVA analysis are shown in Fig. 4.

|
| Figure 3 Biogeographic information collected on the order Bangiales based on 162 species Map drawing No. GS(2016)1666 (accessed from the National Administration of Surveying, Mapping and Geoinformation of China). |

|
| Figure 4 Ancestral area reconstruction of Bangiales as inferred from S-DIVA Numeric values at the nodes are Bayesian posterior probabilities (%) obtained from the BEAST tree. Letters in the centers of nodes are the most likely ancestral areas. A maximum of two areas are represented at each node; therefore, the colors of those nodes are integrated based on the colors of the two corresponding locations in the internal legend. |
To better understand the evolutionary rate of the order Bangiales, protein-coding genes from ptDNAs and mtDNAs were aligned, and the numbers of pairwise synonymous (dS) and non-synonymous (dN) substitutions per site were inferred (Table 1). The mean dS values were 0.528±0.242 (ptDNA) and 1.623±0.699 (mtDNA) within Pyropia, and 0.463±0.193 (ptDNA) and 1.738±0.581 (mtDNA) within Porphyra. The rates of substitution at dN were lower than those of dS. The dN/dS values were significantly smaller than 1, with averages ranging from 0.035 to 0.044, which suggest the existence of purifying selection acting on the organelle proteincoding genes of the Bangiales species.

|
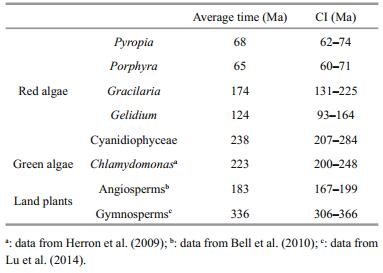
Combining substitution rates with the divergence times (Table 2), we estimated the substitution rates per site per year at synonymous sites (μS). The mean μS in Bangiales ranged from 0.356×10⁻⁸ to 0.388×10⁻⁸ (ptDNA) and from 1.193×10⁻⁸ to 1.337×10⁻⁸ (mtDNA). The average synonymous mutation rates of ptDNA were all lower than those of other groups of red algae. However, compared with other lineages outside the red algae, Rhodophytes had dramatically higher μS, by more than 3-fold for ptDNA and 23-fold for mtDNA relative to land plants, and by more than 5-fold for ptDNA and 15-fold for mtDNA relative to green algae. Consequently, the mean dN/dS value was lower in algae than in land plants, 2.5-fold on average, which implies different levels of environmental adaptability.
Studies have shown that multigene phylogenies elucidate phylogenetic relationships more precisely when the different evolutionary rates of the different genes are considered (Yoon et al., 2006; Verbruggen et al., 2010). Several studies based on complete plastid or mitochondrial multigene sequences showed great potential to elucidate the phylogenetic relationships of red algae (Reith and Munholland, 1995; Ohta et al., 2003; Hagopian et al., 2004; Verbruggen et al., 2010; Wang et al., 2013; Campbell et al., 2014; Yang et al., 2015). We utilized the entire available set of ptDNA and mtDNA genes to explore the phylogenetic tree of the Bangiales. In this study, the species B. fuscopurpurea was ascribed to the clade 'Bangia', which was closer to Pyropia 2, based on the combined data sets of nrSSU and rbcL genes (Fig. 4). Nevertheless, phylogenomics based on information from the entire genome revealed that the phylogenetic relationship between Bangia and Porphyra was closer than that of either with Pyropia, with high bootstrap support. Regarding the position of the genus Wildemania, our results indicated with high support that this clade diverged at the base of the Bangiales, which was in accordance with the results of Yang et al. (2015) based on whole mitochondrial genomes. Based on plastid genes, Hughey (2016) proposed that Wildemania was more closely related to Pyropia. Such inconsistency may occur when taxon sampling is sparse and when substitution saturation is present (Zhao et al., 2016). Therefore, more taxon information should be obtained; further works that combine the nuclear, plastid and mitochondrial genomes could help to better understand the relationships of Bangiales groups.
4.2 Divergence times and biogeographyEstimating divergence times using molecular data and fossil constraints is an advantage of the evolutionary study of red algae. There have been several studies on the divergence time of the taxonomically diverse class Florideophyceae (Xiao et al., 1998; Saunders and Hommersand, 2004; Xiao et al., 2004). The multicellular filamentous red alga Bangiomorpha pubescens from the ca. 1 200 Ma Hunting Formation (Somerset Island, Arctic Canada) was considered the oldest known taxonomically resolved eukaryotic fossil (Butterfield, 2000). However, the multicellular holdfast of B. pubescens had greater similarity to Erythrotrichia than to Bangia. It is possible that Bangiomorpha evolved as an extinct lineage in parallel to the Bangiophyceae and Compsopogonophyceae (Yang et al., 2016). A recent study indicated that Rafatazmia and Ramathallus represent crown-group multicellular Rhodophytes, which would antedate the oldest previously accepted red algae in the fossil record by about 400 million years (Bengtson et al., 2017). In our work, the organellar genomes of multicellular Rhodophytes include only Florideophyceae and Bangiophyceae. The latest common ancestor dating of the Florideophyceae and Bangiophyceae may not be sufficient to represent the dating of multicellular Rhodophytes. The present study provides molecular evidence of divergence times and historical biogeographic information, which indicate that Bangiales diversified approximately 246.40 Ma in the late Permian and early Triassic. Based on the present results, Bangiales is not as ancient as other red algae groups. This finding implies that this group experienced a long period of selection or an extinction event. Further genomic information of long-branch species such as Dione and Minerva is needed to more accurately evaluate the divergence time. At least three major diversification events occurred, which determined the four largest genera of the Bangiales (Bangia, Porphyra, Pyropia and Wildemania). We traced the ancestral species of Bangiales of eastern Gondwanaland, in the present New Zealand and Australia (Oceania) area of the Southern Hemisphere. At the time of these ancestral species, the land masses were still bound together into the vast supercontinent Pangaea. This emerging supercontinent presented severe climatic and environmental extremes because of its vast size (Chumakov and Zharkov, 2002). The south was cold and arid, with much of the region frozen under ice caps. Although climatic cooling was supposedly a primary cause of Permian mass extinctions (Stanley, 1988), Bangiales and other coldadapted species may have survived and expanded in the extreme environments of this period. Pangaea began to break apart in the mid-Triassic, forming Gondwanaland (South America, Africa, India, Antarctica, and Australia) in the south and Laurasia (North America and Eurasia) in the north (Ogg et al., 2004). These changes made it possible for plant migration across these continents. The ancestral area of the Bangia subgroup was determined to be in the Oceania area or western North America around the Jurassic. We infer that there may have been geographic isolation events at that time. The filamentous members of Bangia were divided into four groups: Bangia, 'Bangia' 1, 'Bangia' 2 and 'Bangia' 3 (Sutherland et al., 2011). Bangia and 'Bangia' 1 were deduced to originate from the Oceania area, and the other two genera were determined to be from western North America. The genus Pyropia diversified at 121.37 Ma in the Cretaceous and was widely distributed. In the Cretaceous, the breakup of the supercontinent Pangaea, which began during the Jurassic, continued. This change led to increased regional differentiation in species between the northern and southern continents (Casey, 1964). Based on our results, we speculate that Pyropia originated in East Asia and subsequently spread worldwide.
4.3 Evolutionary rate of Bangiales compared with other groupsA previous study implied that the high collinearity of plastid genomes indicate that the organellar genomes of red algae evolve slowly (Janouškovec et al., 2013). Smith et al. (2012) studied the relative rates of evolution among the three genetic compartments of the red alga Porphyra (mtDNA, ptDNA, and nDNA) and concluded that the mutation rates do not correlate with genome architecture. The present study was based upon whole plastid and mitochondrial genomic loci rather than on a small set of genes, and is relevant to understanding the differences in evolutionary patterns between Bangiales and other groups. First, we found that evolutionary rates are dramatically faster in red algae than in land plants and green algae. Secondly, evolutionary rates are slower in Bangiales than in Florideophyceae. To date, Bangiales is the only order that has been identified in the class Bangiophyceae, and includes ca. 190 species. However, at least 27 orders, including approximately 6 799 species, have been classified in Florideophyceae (Guiry and Guiry, 2017). The low speciation rate of the Bangiophyceae may be due to the relatively low evolutionary rates at the nucleotide level. In seed plants, gymnosperms are more conserved than angiosperms and have experienced very low speciation rates (Levin and Wilson, 1976). In birds, diversification has also been shown to be positively correlated with mutation rate (Lanfear et al., 2010). The lower evolutionary rates of Bangiales relative to Florideophyceae may be the cause of the lower species diversity.
Interestingly, land plants possess more species diversity than algae, despite generally lower mutation rates. The number of currently known, described and accepted land plant species exceeds 300 000, whereas the corresponding number of algae species worldwide is approximately 44 000 (Christenhusz and Byng, 2016). Species arise after splitting from ancestral species when they acquire new adaptations to a changing environment. We found that the mean dN/dS was approximately five times lower in algae than in land plants, despite much higher substitution rates in red algae genes (Table 1). To some extent, the fixation rate of mutations depends on the purifying (background) selection of the environment (Buschiazzo et al., 2012). Lower dN/dS in algae may arise from high selective constraints on nonsynonymous mutations because of the purifying selection of relatively constant marine life. The more variable terrestrial environment of land plants induces more adaptive mutations, which leads to a staggeringly high rate of fixation for non-synonymous mutations.
Simultaneously, we found that the average number of substitutions per synonymous site was higher (1.75–3.75 times) in mtDNA than in ptDNA in red algae, which was consistent with previously reported results (Robba et al., 2006; Milstein et al., 2008; Smith et al., 2012). This trend is also observed in Phaeocystis algae (Smith et al., 2014). In contrast, synonymous substitution rates are estimated at lower rates in mtDNA than in ptDNA (1:3) for seed plants and at roughly equal rates for green algae (Drouin et al., 2008; Hua et al., 2012). Seed plant cpDNA had lower conservation than mtDNA because of constraints on synonymous codon choice in the mitochondria, which may reduce the rate of synonymous substitution (Wolfe et al., 1987). The inverse situation exists in Rhodophyte species; plastid DNA exhibits a slower evolutionary rate than mtDNA. This difference in rates may be largely because of the conservation of ribosomal RNA regions of red algae, whereas contraction or expansion of the IR regions often occurred in seed plant chloroplast genomes (Kim and Lee, 2004).
5 CONCLUSIONIn summary, our results indicate that the lower evolutionary rates of Bangiales relative to Florideophyceae may be the cause of their lower species diversity. The Rhodophyta had a faster evolutionary rate than the Viridiplantae, however, this clade also had a lower dN/dS ratio, which corresponds to adaptation to marine life. Phylogenomic analyses were conducted using complete organelle genomes of Bangiales, and the results support the topology (((Bangia, Porphyra) Pyropia) Wildemania) with high supporting values. In addition, divergence time dating and ancestral area reconstruction within the Bangiales were conducted for the first time. The increasing number of sequenced organelle genomes may allow further improvement of the understanding of the phylogenetics of the order Bangiales.
6 DATA AVAILABILITY STATEMENTThe authors declare that all data supporting the findings of this study are available in the appendix.
Electronic supplementary material
Supplementary material (Supplementary Tables S1–S3) is available in the online version of this article at https://doi.org/10.1007/s00343-018-7054-4.
Abascal F, Zardoya R, Posada D. 2005. ProtTest:selection of best-fit models of protein evolution. Bioinformatics, 21(9): 2 104-2 105. DOI:10.1093/bioinformatics/bti263 |
Barraclough T G, Savolainen V. 2001. Evolutionary rates and species diversity in flowering plants. Evolution, 55(4): 677-683. DOI:10.1554/0014-3820(2001)055[0677:ERASDI]2.0.CO;2 |
Bell C D, Soltis D E, Soltis P S. 2010. The age and diversification of the angiosperms re-revisited. American Journal of Botany, 97(8): 1 296-1 303. DOI:10.3732/ajb.0900346 |
Bengtson S, Sallstedt T, Belivanova V, Whitehouse M. 2017. Three-dimensional preservation of cellular and subcellular structures suggests 1.6 billion-year-old crown-group red algae. PLoS Biology, 15(3): e2000735. DOI:10.1371/journal.pbio.2000735 |
Berger B A, Kriebel R, Spalink D, Sytsma K J. 2016. Divergence times, historical biogeography, and shifts in speciation rates of Myrtales. Molecular Phylogenetics and Evolution, 95: 116-136. DOI:10.1016/j.ympev.2015.10.001 |
Blouin N A, Brodie J A, Grossman A C, Xu P, Brawley S H. 2011. Porphyra:a marine crop shaped by stress. Trends in Plant Science, 16(1): 29-37. DOI:10.1016/j.tplants.2010.10.004 |
Broom J E S, Farr T J, Nelson W A. 2004. Phylogeny of the Bangia flora of New Zealand suggests a southern origin for Porphyra and Bangia (Bangiales, Rhodophyta). Molecular Phylogenetics and Evolution, 31(3): 1 197-1 207. DOI:10.1016/j.ympev.2003.10.015 |
Buschiazzo E, Ritland C, Bohlmann J, Ritland K. 2012. Slow but not low:genomic comparisons reveal slower evolutionary rate and higher dN/dS in conifers compared to angiosperms. BMC Evolutionary Biology, 12: 8. DOI:10.1186/1471-2148-12-8 |
Butterfield N J. 2000. Bangiomorpha pubescens n. gen., n. sp.:implications for the evolution of sex, multicellularity, and the Mesoproterozoic/Neoproterozoic radiation of eukaryotes. Paleobiology, 26(3): 386-404. DOI:10.1666/0094-8373(2000)026<0386:BPNGNS>2.0.CO;2 |
Campbell M A, Presting G, Bennett M S, Sherwood A R. 2014. Highly conserved organellar genomes in the Gracilariales as inferred using new data from the Hawaiian invasive alga Gracilaria salicornia (Rhodophyta). Phycologia, 53(2): 109-116. DOI:10.2216/13-222.1 |
Capella-Gutiérrez S, Silla-Martínez J M, Gabaldón T. 2009. trimAl:a tool for automated alignment trimming in largescale phylogenetic analyses. Bioinformatics, 25(15): 1 972-1 973. DOI:10.1093/bioinformatics/btp348 |
Casey R. 1964. The cretaceous period. Geological Society, London, Special Publications, 1(1): 193-202. DOI:10.1144/GSL.SP.1964.001.01.17 |
Christenhusz M J M, Byng J W. 2016. The number of known plants species in the world and its annual increase. Phytotaxa, 261(3): 201-217. DOI:10.11646/phytotaxa.261.3 |
Chumakov N M, Zharkov M A. 2002. Climate during PermianTriassic biosphere reorganizations, Article 1:climate of the early Permian. Stratigraphy and Geological Correlation, 10(6): 586-602. |
Contreras-Moreira B, Vinuesa P. 2013. GET_HOMOLOGUES, a versatile software package for scalable and robust microbial pangenome analysis. AppliedandEnvironmental Microbiology, 79(24): 7 696-7 701. |
Conway E, Mumford Jr T F, Scagel R F. 1975. The genus Porphyra in British Columbia and Washington. Syesis, 8: 185-244. |
Davies T J, Savolainen V, Chase M W, Moat J, Barraclough T G. 2004. Environmental energy and evolutionary rates in flowering plants. Proceedings of the Royal Society B:Biological Sciences, 271(1553): 2 195-2 200. DOI:10.1098/rspb.2004.2849 |
Deng J B, Drew B T, Mavrodiev E V, Gitzendanner M A, Soltis P S, Soltis D E. 2015. Phylogeny, divergence times, and historical biogeography of the angiosperm family Saxifragaceae. Molecular Phylogenetics and Evolution, 83: 86-98. DOI:10.1016/j.ympev.2014.11.011 |
Drouin G, Daoud H, Xia J N. 2008. Relative rates of synonymous substitutions in the mitochondrial, chloroplast and nuclear genomes of seed plants. Molecular Phylogenetics and Evolution, 49(3): 827-831. DOI:10.1016/j.ympev.2008.09.009 |
Drummond A J, Suchard M A, Xie D, Rambaut A. 2012. Bayesian phylogenetics with BEAUti and the BEAST 1.7. Molecular Biology and Evolution, 29(8): 1 969-1 973. DOI:10.1093/molbev/mss075 |
Dumont H J, Vanfleteren J R, De Jonckheere J F, Weekers P H H. 2005. Phylogenetic relationships, divergence time estimation, and global biogeographic patterns of calopterygoid damselflies (Odonata, Zygoptera) inferred from ribosomal DNA sequences. Systematic Biology, 54(3): 347-362. DOI:10.1080/10635150590949869 |
Guiry M D, Guiry G M. 2017. AlgaeBase. World-Wide Electronic Publication, National University of Ireland, Galway, http://www.marinespecies.org/aphia.php?p=sourcedetails&id=37.
|
Hagopian J C, Reis M, Kitajima J P, Bhattacharya D, de Oliveira M C. 2004. Comparative analysis of the complete plastid genome sequence of the red alga Gracilaria tenuistipitata var. liui provides insights into the evolution of rhodoplasts and their relationship to other plastids.Journal of Molecular Evolution, 59(4): 464-477. |
Herron M D, Hackett J D, Aylward F O, Michod R E. 2009. Triassic origin and early radiation of multicellular volvocine algae. Proceedings of the National Academy of Sciences of the United States of America, 106(9): 3 254-3 258. DOI:10.1073/pnas.0811205106 |
Hua J M, Smith D R, Borza T, Lee R W. 2012. Similar relative mutation rates in the three genetic compartments of Mesostigma and Chlamydomonas. Protist, 163(1): 105-115. DOI:10.1016/j.protis.2011.04.003 |
Huelsenbeck J P, Ronquist F. 2001. MRBAYES:Bayesian inference of phylogenetic trees. Bioinformatics, 17(8): 754-755. DOI:10.1093/bioinformatics/17.8.754 |
Hughey J R. 2016. Genomic and phylogenetic analysis of the complete plastid Genome of the California endemic seaweed Wildemania schizophylla (Bangiaceae). Madroño, 63(1): 34-38. DOI:10.3120/0024-9637-63.1.34 |
Janouškovec J, Liu S L, Martone P T, Carré W, Leblanc C, Collén J, Keeling P J. 2013. Evolution of red algal plastid genomes:ancient architectures, introns, horizontal gene transfer, and taxonomic utility of plastid markers. PLoS One, 8(3): e59001. DOI:10.1371/journal.pone.0059001 |
Katoh K, Kuma K I, Toh H, Miyata T. 2005. MAFFT version 5:improvement in accuracy of multiple sequence alignment. Nucleic Acids Research, 33(2): 511-518. DOI:10.1093/nar/gki198 |
Kim K J, Lee H L. 2004. Complete chloroplast genome sequences from Korean ginseng (Panax schinseng Nees) and comparative analysis of sequence evolution among 17 vascular plants. DNA Research, 11(4): 247-261. DOI:10.1093/dnares/11.4.247 |
Kimura M. 1984. The Neutral Theory of Molecular Evolution. Cambridge University Press, Cambridge.
|
Lanfear R, Ho S Y W, Love D, Bromham L. 2010. Mutation rate is linked to diversification in birds. Proceedings of the National Academy of Sciences of the United States of America, 107(47): 20 423-20 428. DOI:10.1073/pnas.1007888107 |
Lee J, Cho C H, Park S I, Choi J W, Song H S, West J A, Bhattacharya D, Yoon H S. 2016. Parallel evolution of highly conserved plastid genome architecture in red seaweeds and seed plants. BMC Biology, 14: 75. DOI:10.1186/s12915-016-0299-5 |
Leliaert F, Smith D R, Moreau H, Herron M D, Verbruggen H, Delwiche C F, De Clerck O. 2012. Phylogeny and molecular evolution of the green algae. Critical Reviews in Plant Sciences, 31(1): 1-46. DOI:10.1080/07352689.2011.615705 |
Levin D A, Wilson A C. 1976. Rates of evolution in seed plants:net increase in diversity of chromosome numbers and species numbers through time. Proceedings of the National Academy of Sciences of the United States of America, 73(6): 2 086-2 090. DOI:10.1073/pnas.73.6.2086 |
Lu Y, Ran J H, Guo D M, Yang Z Y, Wang X Q. 2014. Phylogeny and divergence times of gymnosperms inferred from single-copy nuclear genes. PLoS One, 9(9): e107679. DOI:10.1371/journal.pone.0107679 |
Milstein D, Oliveira M C, Martins F M, Matioli S R. 2008. Group I introns and associated homing endonuclease genes reveals a clinal structure for Porphyra spiralis var. amplifolia (Bangiales, Rhodophyta) along the eastern coast of South America. BMC Evolutionary Biology, 8: 308. DOI:10.1186/1471-2148-8-308 |
Müller K M, Oliveira M C, Sheath R G, Bhattacharya D. 2001. Ribosomal DNA phylogeny of the Bangiophycidae(Rhodophyta) and the origin of secondary plastids. American Journal of Botany, 88(8): 1 390-1 400. DOI:10.2307/3558445 |
Ogg J G, Agterberg F, Gradstein F. 2004. A geologic time scale 2004. In: Abstracts with Programs-Geological Society of America, 36: 74.
|
Ohta N, Matsuzaki M, Misumi O, Miyagishima S Y, Nozaki H, Tanaka K, Shin-I T, Kohara Y, Kuroiwa T. 2003. Complete sequence and analysis of the plastid genome of the unicellular red alga Cyanidioschyzon merolae. DNA Research, 10(2): 67-77. DOI:10.1093/dnares/10.2.67 |
Posada D, Crandall K A. 1998. MODELTEST:testing the model of DNA substitution. Bioinformatics, 14(9): 817-818. DOI:10.1093/bioinformatics/14.9.817 |
Reith M, Munholland J. 1995. Complete nucleotide sequence of the Porphyra purpurea chloroplast genome. Plant Molecular Biology Reporter, 13(4): 333-335. DOI:10.1007/BF02669187 |
Robba L, Russell S J, Barker G L, Brodie J. 2006. Assessing the use of the mitochondrial cox1 marker for use in DNA barcoding of red algae (Rhodophyta). American Journal of Botany, 93(8): 1 101-1 108. DOI:10.3732/ajb.93.8.1101 |
Ronquist F, Cannatella D. 1997. Dispersal-vicariance analysis:a new approach to the quantification of historical biogeography. Systematic Biology, 46(1): 195-203. DOI:10.1093/sysbio/46.1.195 |
Saunders G W, Hommersand M H. 2004. Assessing red algal supraordinal diversity and taxonomy in the context of contemporary systematic data. American Journal of Botany, 91(10): 1 494-1 507. DOI:10.3732/ajb.91.10.1494 |
Smith D R, Arrigo K R, Alderkamp A C, Allen A E. 2014. Massive difference in synonymous substitution rates among mitochondrial, plastid, and nuclear genes of Phaeocystis algae. Molecular Phylogenetics and Evolution, 71: 36-40. DOI:10.1016/j.ympev.2013.10.018 |
Smith D R, Hua J M, Lee R W, Keeling P J. 2012. Relative rates of evolution among the three genetic compartments of the red alga Porphyra differ from those of green plants and do not correlate with genome architecture. Molecular Phylogenetics and Evolution, 65(1): 339-344. DOI:10.1016/j.ympev.2012.06.017 |
Smith D R. 2015. Mutation rates in plastid genomes:they are lower than you might think. Genome Biology and Evolution, 7(5): 1 227-1 234. DOI:10.1093/gbe/evv069 |
Stamatakis A. 2014. RAxML version 8:a tool for phylogenetic analysis and post-analysis of large phylogenies. Bioinformatics, 30(9): 1 312-1 313. DOI:10.1093/bioinformatics/btu033 |
Stanley S M. 1988. Paleozoic mass extinctions; shared patterns suggest global cooling as a common cause. American Journal of Science, 288(4): 334-352. DOI:10.2475/ajs.288.4.334 |
Sutherland J E, Lindstrom S C, Nelson W A, Brodie J, Lynch M D J, Hwang M S, Choi H G, Miyata M, Kikuchi N, Oliveira M C, Farr T, Neefus C, Mols-Mortensen A, Milstein D, Müller K M. 2011. A new look at an ancient order:generic revision of the Bangiales (Rhodophyta). Journal of Phycology, 47(5): 1 131-1 151. DOI:10.1111/j.1529-8817.2011.01052.x |
Swofford D L. 2003. PAUP*: Phylogenetic Analysis Using Parsimony (and Other Methods), Version 4. Sinauer Associates, Sunderland, MA.
|
Venditti C, Pagel M. 2010. Speciation as an active force in promoting genetic evolution. Trends in Ecology & Evolution, 25(1): 14-20. |
Verbruggen H, Maggs C A, Saunders G W, Le Gall L, Yoon H S, De Clerck O. 2010. Data mining approach identifies research priorities and data requirements for resolving the red algal tree of life. BMC Evolutionary Biology, 10: 16. DOI:10.1186/1471-2148-10-16 |
Wang L, Mao Y X, Kong F N, Li G Y, Ma F, Zhang B L, Sun P P, Bi G Q, Zhang F F, Xue H F, Cao M. 2013. Complete sequence and analysis of plastid genomes of two economically important red algae:Pyropia haitanensis and Pyropia yezoensis. PLoS One, 8(5): e65902. DOI:10.1371/journal.pone.0065902 |
Webster A J, Payne R J H, Pagel M. 2003. Molecular phylogenies link rates of evolution and speciation. Science, 301(5632): 478. DOI:10.1126/science.1083202 |
Wolfe K H, Li W H, Sharp P M. 1987. Rates of nucleotide substitution vary greatly among plant mitochondrial, chloroplast, and nuclear DNAs. Proceedings of the National Academy of Sciences of the United States of America, 84(24): 9 054-9 058. DOI:10.1073/pnas.84.24.9054 |
Xiao S H, Knoll A H, Yuan X L, Pueschel C M. 2004. Phosphatized multicellular algae in the Neoproterozoic Doushantuo Formation, China, and the early evolution of florideophyte red algae. American Journal of Botany, 91(2): 214-227. DOI:10.3732/ajb.91.2.214 |
Xiao S H, Zhang Y, Knoll A H. 1998. Three-dimensional preservation of algae and animal embryos in a Neoproterozoic phosphorite. Nature, 391(6667): 553-558. DOI:10.1038/35318 |
Yang E C, Boo S M, Bhattacharya D, Saunders G W, Knoll A H, Fredericq S, Graf L, Yoon H S. 2016. Divergence time estimates and the evolution of major lineages in the florideophyte red algae. Scientific Reports, 6: 21361. DOI:10.1038/srep21361 |
Yang E C, Kim K M, Kim S Y, Lee J, Boo G H, Lee J H, Nelson W A, Yi G M, Schmidt W E, Fredericq S, Boo S M, Bhattacharya D, Yoon H S. 2015. Highly conserved mitochondrial genomes among multicellular red algae of the Florideophyceae. Genome Biology and Evolution, 7(8): 2 394-2 406. DOI:10.1093/gbe/evv147 |
Yang Z H. 2007. PAML 4:phylogenetic analysis by maximum likelihood. Molecular Biology and Evolution, 24(8): 1 586-1 591. DOI:10.1093/molbev/msm088 |
Yoon H S, Hackett J D, Ciniglia C, Pinto G, Bhattacharya D. 2004. A molecular timeline for the origin of photosynthetic eukaryotes. Molecular Biology and Evolution, 21(5): 809-818. DOI:10.1093/molbev/msh075 |
Yoon H S, Müller K M, Sheath R G, Ott F D, Bhattacharya D. 2006. Defining the major lineages of red algae(Rhodophyta). Journal of Phycology, 42(2): 482-492. DOI:10.1111/jpy.2006.42.issue-2 |
Yu Y, Harris A, He X J. 2010. S-DIVA (Statistical DispersalVicariance Analysis):a tool for inferring biogeographic histories. Molecular Phylogenetics and Evolution, 56(2): 848-850. DOI:10.1016/j.ympev.2010.04.011 |
Zhao L, Li X, Zhang N, Zhang S D, Yi T S, Ma H, Guo Z H, Li D Z. 2016. Phylogenomic analyses of large-scale nuclear genes provide new insights into the evolutionary relationships within the rosids. Molecular Phylogenetics and Evolution, 105: 166-176. DOI:10.1016/j.ympev.2016.06.007 |
| Abascal F, Zardoya R, Posada D, 2005. ProtTest:selection of best-fit models of protein evolution. Bioinformatics, 21(9): 2 104–2 105. Doi: 10.1093/bioinformatics/bti263 |
| Barraclough T G, Savolainen V, 2001. Evolutionary rates and species diversity in flowering plants. Evolution, 55(4): 677–683. Doi: 10.1554/0014-3820(2001)055[0677:ERASDI]2.0.CO;2 |
| Bell C D, Soltis D E, Soltis P S, 2010. The age and diversification of the angiosperms re-revisited. American Journal of Botany, 97(8): 1 296–1 303. Doi: 10.3732/ajb.0900346 |
| Bengtson S, Sallstedt T, Belivanova V, Whitehouse M, 2017. Three-dimensional preservation of cellular and subcellular structures suggests 1.6 billion-year-old crown-group red algae. PLoS Biology, 15(3): e2000735. Doi: 10.1371/journal.pbio.2000735 |
| Berger B A, Kriebel R, Spalink D, Sytsma K J, 2016. Divergence times, historical biogeography, and shifts in speciation rates of Myrtales. Molecular Phylogenetics and Evolution, 95: 116–136. Doi: 10.1016/j.ympev.2015.10.001 |
| Blouin N A, Brodie J A, Grossman A C, Xu P, Brawley S H, 2011. Porphyra:a marine crop shaped by stress. Trends in Plant Science, 16(1): 29–37. Doi: 10.1016/j.tplants.2010.10.004 |
| Broom J E S, Farr T J, Nelson W A, 2004. Phylogeny of the Bangia flora of New Zealand suggests a southern origin for Porphyra and Bangia (Bangiales, Rhodophyta). Molecular Phylogenetics and Evolution, 31(3): 1 197–1 207. Doi: 10.1016/j.ympev.2003.10.015 |
| Buschiazzo E, Ritland C, Bohlmann J, Ritland K, 2012. Slow but not low:genomic comparisons reveal slower evolutionary rate and higher dN/dS in conifers compared to angiosperms. BMC Evolutionary Biology, 12: 8. Doi: 10.1186/1471-2148-12-8 |
| Butterfield N J, 2000. Bangiomorpha pubescens n. gen., n. sp.:implications for the evolution of sex, multicellularity, and the Mesoproterozoic/Neoproterozoic radiation of eukaryotes. Paleobiology, 26(3): 386–404. Doi: 10.1666/0094-8373(2000)026<0386:BPNGNS>2.0.CO;2 |
| Campbell M A, Presting G, Bennett M S, Sherwood A R, 2014. Highly conserved organellar genomes in the Gracilariales as inferred using new data from the Hawaiian invasive alga Gracilaria salicornia (Rhodophyta). Phycologia, 53(2): 109–116. Doi: 10.2216/13-222.1 |
| Capella-Gutiérrez S, Silla-Martínez J M, Gabaldón T, 2009. trimAl:a tool for automated alignment trimming in largescale phylogenetic analyses. Bioinformatics, 25(15): 1 972–1 973. Doi: 10.1093/bioinformatics/btp348 |
| Casey R, 1964. The cretaceous period. Geological Society, London, Special Publications, 1(1): 193–202. Doi: 10.1144/GSL.SP.1964.001.01.17 |
| Christenhusz M J M, Byng J W, 2016. The number of known plants species in the world and its annual increase. Phytotaxa, 261(3): 201–217. Doi: 10.11646/phytotaxa.261.3 |
| Chumakov N M, Zharkov M A, 2002. Climate during PermianTriassic biosphere reorganizations, Article 1:climate of the early Permian. Stratigraphy and Geological Correlation, 10(6): 586–602. |
| Contreras-Moreira B, Vinuesa P, 2013. GET_HOMOLOGUES, a versatile software package for scalable and robust microbial pangenome analysis. AppliedandEnvironmental Microbiology, 79(24): 7 696–7 701. |
| Conway E, Mumford Jr T F, Scagel R F, 1975. The genus Porphyra in British Columbia and Washington. Syesis, 8: 185–244. |
| Davies T J, Savolainen V, Chase M W, Moat J, Barraclough T G, 2004. Environmental energy and evolutionary rates in flowering plants. Proceedings of the Royal Society B:Biological Sciences, 271(1553): 2 195–2 200. Doi: 10.1098/rspb.2004.2849 |
| Deng J B, Drew B T, Mavrodiev E V, Gitzendanner M A, Soltis P S, Soltis D E, 2015. Phylogeny, divergence times, and historical biogeography of the angiosperm family Saxifragaceae. Molecular Phylogenetics and Evolution, 83: 86–98. Doi: 10.1016/j.ympev.2014.11.011 |
| Drouin G, Daoud H, Xia J N, 2008. Relative rates of synonymous substitutions in the mitochondrial, chloroplast and nuclear genomes of seed plants. Molecular Phylogenetics and Evolution, 49(3): 827–831. Doi: 10.1016/j.ympev.2008.09.009 |
| Drummond A J, Suchard M A, Xie D, Rambaut A, 2012. Bayesian phylogenetics with BEAUti and the BEAST 1.7. Molecular Biology and Evolution, 29(8): 1 969–1 973. Doi: 10.1093/molbev/mss075 |
| Dumont H J, Vanfleteren J R, De Jonckheere J F, Weekers P H H, 2005. Phylogenetic relationships, divergence time estimation, and global biogeographic patterns of calopterygoid damselflies (Odonata, Zygoptera) inferred from ribosomal DNA sequences. Systematic Biology, 54(3): 347–362. Doi: 10.1080/10635150590949869 |
| Guiry M D, Guiry G M. 2017. AlgaeBase. World-Wide Electronic Publication, National University of Ireland, Galway, http://www.marinespecies.org/aphia.php?p=sourcedetails&id=37. |
| Hagopian J C, Reis M, Kitajima J P, Bhattacharya D, de Oliveira M C, 2004. Comparative analysis of the complete plastid genome sequence of the red alga Gracilaria tenuistipitata var. liui provides insights into the evolution of rhodoplasts and their relationship to other plastids.Journal of Molecular Evolution, 59(4): 464–477. |
| Herron M D, Hackett J D, Aylward F O, Michod R E, 2009. Triassic origin and early radiation of multicellular volvocine algae. Proceedings of the National Academy of Sciences of the United States of America, 106(9): 3 254–3 258. Doi: 10.1073/pnas.0811205106 |
| Hua J M, Smith D R, Borza T, Lee R W, 2012. Similar relative mutation rates in the three genetic compartments of Mesostigma and Chlamydomonas. Protist, 163(1): 105–115. Doi: 10.1016/j.protis.2011.04.003 |
| Huelsenbeck J P, Ronquist F, 2001. MRBAYES:Bayesian inference of phylogenetic trees. Bioinformatics, 17(8): 754–755. Doi: 10.1093/bioinformatics/17.8.754 |
| Hughey J R, 2016. Genomic and phylogenetic analysis of the complete plastid Genome of the California endemic seaweed Wildemania schizophylla (Bangiaceae). Madroño, 63(1): 34–38. Doi: 10.3120/0024-9637-63.1.34 |
| Janouškovec J, Liu S L, Martone P T, Carré W, Leblanc C, Collén J, Keeling P J, 2013. Evolution of red algal plastid genomes:ancient architectures, introns, horizontal gene transfer, and taxonomic utility of plastid markers. PLoS One, 8(3): e59001. Doi: 10.1371/journal.pone.0059001 |
| Katoh K, Kuma K I, Toh H, Miyata T, 2005. MAFFT version 5:improvement in accuracy of multiple sequence alignment. Nucleic Acids Research, 33(2): 511–518. Doi: 10.1093/nar/gki198 |
| Kim K J, Lee H L, 2004. Complete chloroplast genome sequences from Korean ginseng (Panax schinseng Nees) and comparative analysis of sequence evolution among 17 vascular plants. DNA Research, 11(4): 247–261. Doi: 10.1093/dnares/11.4.247 |
| Kimura M, 1984. The Neutral Theory of Molecular Evolution. Cambridge University Press, Cambridge. |
| Lanfear R, Ho S Y W, Love D, Bromham L, 2010. Mutation rate is linked to diversification in birds. Proceedings of the National Academy of Sciences of the United States of America, 107(47): 20 423–20 428. Doi: 10.1073/pnas.1007888107 |
| Lee J, Cho C H, Park S I, Choi J W, Song H S, West J A, Bhattacharya D, Yoon H S, 2016. Parallel evolution of highly conserved plastid genome architecture in red seaweeds and seed plants. BMC Biology, 14: 75. Doi: 10.1186/s12915-016-0299-5 |
| Leliaert F, Smith D R, Moreau H, Herron M D, Verbruggen H, Delwiche C F, De Clerck O, 2012. Phylogeny and molecular evolution of the green algae. Critical Reviews in Plant Sciences, 31(1): 1–46. Doi: 10.1080/07352689.2011.615705 |
| Levin D A, Wilson A C, 1976. Rates of evolution in seed plants:net increase in diversity of chromosome numbers and species numbers through time. Proceedings of the National Academy of Sciences of the United States of America, 73(6): 2 086–2 090. Doi: 10.1073/pnas.73.6.2086 |
| Lu Y, Ran J H, Guo D M, Yang Z Y, Wang X Q, 2014. Phylogeny and divergence times of gymnosperms inferred from single-copy nuclear genes. PLoS One, 9(9): e107679. Doi: 10.1371/journal.pone.0107679 |
| Milstein D, Oliveira M C, Martins F M, Matioli S R, 2008. Group I introns and associated homing endonuclease genes reveals a clinal structure for Porphyra spiralis var. amplifolia (Bangiales, Rhodophyta) along the eastern coast of South America. BMC Evolutionary Biology, 8: 308. Doi: 10.1186/1471-2148-8-308 |
| Müller K M, Oliveira M C, Sheath R G, Bhattacharya D, 2001. Ribosomal DNA phylogeny of the Bangiophycidae(Rhodophyta) and the origin of secondary plastids. American Journal of Botany, 88(8): 1 390–1 400. Doi: 10.2307/3558445 |
| Ogg J G, Agterberg F, Gradstein F. 2004. A geologic time scale 2004. In: Abstracts with Programs-Geological Society of America, 36: 74. |
| Ohta N, Matsuzaki M, Misumi O, Miyagishima S Y, Nozaki H, Tanaka K, Shin-I T, Kohara Y, Kuroiwa T, 2003. Complete sequence and analysis of the plastid genome of the unicellular red alga Cyanidioschyzon merolae. DNA Research, 10(2): 67–77. Doi: 10.1093/dnares/10.2.67 |
| Posada D, Crandall K A, 1998. MODELTEST:testing the model of DNA substitution. Bioinformatics, 14(9): 817–818. Doi: 10.1093/bioinformatics/14.9.817 |
| Reith M, Munholland J, 1995. Complete nucleotide sequence of the Porphyra purpurea chloroplast genome. Plant Molecular Biology Reporter, 13(4): 333–335. Doi: 10.1007/BF02669187 |
| Robba L, Russell S J, Barker G L, Brodie J, 2006. Assessing the use of the mitochondrial cox1 marker for use in DNA barcoding of red algae (Rhodophyta). American Journal of Botany, 93(8): 1 101–1 108. Doi: 10.3732/ajb.93.8.1101 |
| Ronquist F, Cannatella D, 1997. Dispersal-vicariance analysis:a new approach to the quantification of historical biogeography. Systematic Biology, 46(1): 195–203. Doi: 10.1093/sysbio/46.1.195 |
| Saunders G W, Hommersand M H, 2004. Assessing red algal supraordinal diversity and taxonomy in the context of contemporary systematic data. American Journal of Botany, 91(10): 1 494–1 507. Doi: 10.3732/ajb.91.10.1494 |
| Smith D R, Arrigo K R, Alderkamp A C, Allen A E, 2014. Massive difference in synonymous substitution rates among mitochondrial, plastid, and nuclear genes of Phaeocystis algae. Molecular Phylogenetics and Evolution, 71: 36–40. Doi: 10.1016/j.ympev.2013.10.018 |
| Smith D R, Hua J M, Lee R W, Keeling P J, 2012. Relative rates of evolution among the three genetic compartments of the red alga Porphyra differ from those of green plants and do not correlate with genome architecture. Molecular Phylogenetics and Evolution, 65(1): 339–344. Doi: 10.1016/j.ympev.2012.06.017 |
| Smith D R, 2015. Mutation rates in plastid genomes:they are lower than you might think. Genome Biology and Evolution, 7(5): 1 227–1 234. Doi: 10.1093/gbe/evv069 |
| Stamatakis A, 2014. RAxML version 8:a tool for phylogenetic analysis and post-analysis of large phylogenies. Bioinformatics, 30(9): 1 312–1 313. Doi: 10.1093/bioinformatics/btu033 |
| Stanley S M, 1988. Paleozoic mass extinctions; shared patterns suggest global cooling as a common cause. American Journal of Science, 288(4): 334–352. Doi: 10.2475/ajs.288.4.334 |
| Sutherland J E, Lindstrom S C, Nelson W A, Brodie J, Lynch M D J, Hwang M S, Choi H G, Miyata M, Kikuchi N, Oliveira M C, Farr T, Neefus C, Mols-Mortensen A, Milstein D, Müller K M, 2011. A new look at an ancient order:generic revision of the Bangiales (Rhodophyta). Journal of Phycology, 47(5): 1 131–1 151. Doi: 10.1111/j.1529-8817.2011.01052.x |
| Swofford D L. 2003. PAUP*: Phylogenetic Analysis Using Parsimony (and Other Methods), Version 4. Sinauer Associates, Sunderland, MA. |
| Venditti C, Pagel M, 2010. Speciation as an active force in promoting genetic evolution. Trends in Ecology & Evolution, 25(1): 14–20. |
| Verbruggen H, Maggs C A, Saunders G W, Le Gall L, Yoon H S, De Clerck O, 2010. Data mining approach identifies research priorities and data requirements for resolving the red algal tree of life. BMC Evolutionary Biology, 10: 16. Doi: 10.1186/1471-2148-10-16 |
| Wang L, Mao Y X, Kong F N, Li G Y, Ma F, Zhang B L, Sun P P, Bi G Q, Zhang F F, Xue H F, Cao M, 2013. Complete sequence and analysis of plastid genomes of two economically important red algae:Pyropia haitanensis and Pyropia yezoensis. PLoS One, 8(5): e65902. Doi: 10.1371/journal.pone.0065902 |
| Webster A J, Payne R J H, Pagel M, 2003. Molecular phylogenies link rates of evolution and speciation. Science, 301(5632): 478. Doi: 10.1126/science.1083202 |
| Wolfe K H, Li W H, Sharp P M, 1987. Rates of nucleotide substitution vary greatly among plant mitochondrial, chloroplast, and nuclear DNAs. Proceedings of the National Academy of Sciences of the United States of America, 84(24): 9 054–9 058. Doi: 10.1073/pnas.84.24.9054 |
| Xiao S H, Knoll A H, Yuan X L, Pueschel C M, 2004. Phosphatized multicellular algae in the Neoproterozoic Doushantuo Formation, China, and the early evolution of florideophyte red algae. American Journal of Botany, 91(2): 214–227. Doi: 10.3732/ajb.91.2.214 |
| Xiao S H, Zhang Y, Knoll A H, 1998. Three-dimensional preservation of algae and animal embryos in a Neoproterozoic phosphorite. Nature, 391(6667): 553–558. Doi: 10.1038/35318 |
| Yang E C, Boo S M, Bhattacharya D, Saunders G W, Knoll A H, Fredericq S, Graf L, Yoon H S, 2016. Divergence time estimates and the evolution of major lineages in the florideophyte red algae. Scientific Reports, 6: 21361. Doi: 10.1038/srep21361 |
| Yang E C, Kim K M, Kim S Y, Lee J, Boo G H, Lee J H, Nelson W A, Yi G M, Schmidt W E, Fredericq S, Boo S M, Bhattacharya D, Yoon H S, 2015. Highly conserved mitochondrial genomes among multicellular red algae of the Florideophyceae. Genome Biology and Evolution, 7(8): 2 394–2 406. Doi: 10.1093/gbe/evv147 |
| Yang Z H, 2007. PAML 4:phylogenetic analysis by maximum likelihood. Molecular Biology and Evolution, 24(8): 1 586–1 591. Doi: 10.1093/molbev/msm088 |
| Yoon H S, Hackett J D, Ciniglia C, Pinto G, Bhattacharya D, 2004. A molecular timeline for the origin of photosynthetic eukaryotes. Molecular Biology and Evolution, 21(5): 809–818. Doi: 10.1093/molbev/msh075 |
| Yoon H S, Müller K M, Sheath R G, Ott F D, Bhattacharya D, 2006. Defining the major lineages of red algae(Rhodophyta). Journal of Phycology, 42(2): 482–492. Doi: 10.1111/jpy.2006.42.issue-2 |
| Yu Y, Harris A, He X J, 2010. S-DIVA (Statistical DispersalVicariance Analysis):a tool for inferring biogeographic histories. Molecular Phylogenetics and Evolution, 56(2): 848–850. Doi: 10.1016/j.ympev.2010.04.011 |
| Zhao L, Li X, Zhang N, Zhang S D, Yi T S, Ma H, Guo Z H, Li D Z, 2016. Phylogenomic analyses of large-scale nuclear genes provide new insights into the evolutionary relationships within the rosids. Molecular Phylogenetics and Evolution, 105: 166–176. Doi: 10.1016/j.ympev.2016.06.007 |