 2018, Vol. 36
Institute of Oceanology, Chinese Academy of Sciences
Article Information
- HUO Da(霍达), CHEN Youxin(陈友信), LIU Ping(刘萍), LI Yiming(李一鸣), QIAO Zhiyi(乔之怡), LI Renhui(李仁辉)
- Molecular detection of microbial communities associated with Microcystis vs Synechococcus dominated waters in Tianjin, China
- Chinese Journal of Oceanology and Limnology, 36(4): 1145-1156
- http://dx.doi.org/10.1007/s00343-018-7182-x
Article History
- Received Jun. 15, 2017
- accepted in principle Sep. 7, 2017
- accepted for publication Nov. 8, 2017


2 Key Laboratory of Algal Biology, State Key Laboratory of Freshwater Ecology and Biotechnology of China, Institute of Hydrobiology, Chinese Academy of Sciences, Wuhan 430072, China;
3 Department of Basic Sciences, Tianjin Agricultural University, Tianjin 300384, China;
4 University of Chinese Academy of Sciences, Beijing 100049, China
Massive proliferation of harmful cyanobacteria has become a growing problem in many freshwater ecosystems worldwide (Harke et al., 2016). Cyanobacteria blooms cause many environmental problems due to the increase in eutrophication level. Various genera/species of bloom-forming cyanobacteria produce toxins, further increasing the risk for aquatic organisms and humans (Fleming et al., 2002; Lone et al., 2015). Many studies have focused on the genetic diversity of cyanobacterial populations during blooms to determine the factors regulating the formation of water blooms (Zhu et al., 2012; Li et al., 2016; Kong et al., 2017). With the development of next-generation DNA sequencing techniques, several studies have recently investigated the microbial community structure during water blooms (Chen et al., 2011; Bertos-Fortis et al., 2016; Parulekar et al., 2017). China suffers from the heaviest cyanobacterial blooms, and considerable research focused on the water blooms in southern China (Zhang et al., 2016; Liu et al., 2017). However, rising temperature and carbon dioxide concentration in global and regional scales have aggravated the threat from cyanobacterial blooms (Paerl and Huisman, 2008; O'Neil et al., 2012; Verspagen et al., 2014; Visser et al., 2016), and such a consequence will lead to the extension of the water bloom range to the large area of northern China.
Complicated relationships exist between aquatic bacteria and cyanobacterial species during cyanobacterial blooms in an aquatic ecosystem. From a general view, cyanobacteria offer a living habitat for heterotrophic bacteria; bacterial supersession could produce the source of nitrogen, phosphorus, sulfur, vitamin and carbon that cyanobacteria could utilize (Cai et al., 2013; Lee et al., 2014; Klawonn et al., 2015; Stuart et al., 2016; Xie et al., 2016). Some epiphytic bacteria are involved in complicated cyanobacterial life activities, which would contribute to cyanobacterial nutrition absorption, colony formation, and toxin degradation (Brunberg, 1999; Maruyama et al., 2003; Shi et al., 2010, 2012; Shen et al., 2011). Different cyanobacterial taxa with different cellular/colonial surface structures and physiobiochemical features will form differently attached microbial communities (Parveen et al., 2013). The most frequently occurring blooms are dominated by Microcystis species (Wirsing et al., 1998; Javůrek et al., 2015), and various studies have focused on the microbial community structures in Microcystis dominant blooms. Nevertheless, superficially Microcystis blooms are composed of a large number of picocyanobacterial cells, which are difficult to detect by traditional microscopic observation. Ye et al. (2011) used DGGE and real-time PCR methods and found that the two most dominant cyanobacteria in Taihu Lake are Microcystis and Synechococcus, which both have significant succession during the development of water blooms. 16S rDNAsequencing revealed that picocyanobacteria (mainly Synechococcus-like) are also important cyanobacterial members in Chaohu Lake (Cai and Kong, 2013). Synechococcus was found to be dominant in the eutrophic Dongqian Lake by using the targeted deep sequencing of cyanobacteria (Jiang et al., 2017). Therefore, picocyanobacterial abundance in cyanobacterial blooms might be neglected or largely underestimated when molecular detecting approaches are not used. Factors that drive the dominance and succession of different cyanobacteria during a cyanobacterial bloom or different blooms are still unknown; however, the characterization of different cyanobacterial blooms using traditional microscopic or modern molecular methods is an initial step for elucidating these driving forces. Previous studies related to picocyanobacterial dominance in cyanobacterial blooms were mainly recorded in southern and eastern China.
In this study, we selected the Yuqiao-Haihe water system, a reservoir and river in Tianjin City, North China. This water system has annually suffered from huge cyanobacteria blooms. We used high-throughput sequencing of 16S rDNA to investigate the aquatic bacterial community structure along the water course from Yuqiao Reservoir to Haihe River during a bloom in 2016. The aquatic microbial community structures and environmental conditions in the reservoir and river systems were compared. We aimed to determine the controlling factors with regard to the distribution of Microcystis and Synechococcus-like picocyanobacteria.
2 MATERIAL AND METHOD 2.1 Study area and sampling strategyYuqiao Reservoir and Haihe River are both located in Tianjin City, North China. Yuqiao Reservoir is at the upper part of Haihe River flowing through Tianjin City. The reservoir has a surface area of 86.8 km2 with a storage capacity of 1.56×10⁹ m3, average depth of 4.74 m, and a length of 30 km. Yuqiao Reservoir is a drinking water source of Tianjin City. Haihe River was also suffering from cyanobacterial blooms due to the flowing water from Yuqiao, and the relative position between Yuqiao and Haihe is shown in Fig. 1.

|
| Figure 1 Schematic diagram of sampling sites a. map of Tianjin City; b. Yuqiao Reservoir; c. Haihe River. |
Sampling was conducted on September 14, 2016, at 14 sites in the Yuqiao and Haihe area of Tianjin. Samples were collected during an active bloom. The coordinates of the sampling sites are shown in supplementary material S1. In brief, 2 L of water sample in each site was collected at 0.5 m below the surface. All water samples were subsequently divided into three subsamples: for the analysis of water quality parameters, for the filtration to high-throughput sequencing analysis, and for the counting of Microcystis cells (data shown in supplementary material S2). 500 mL of water samples was filtered through a 0.22-μm filter (Millipore, USA).
2.2 Analysis of physicochemical parametersWater temperature (WT), pH, dissolved oxygen (DO), and salinity (SAL) were measured using YSI multiparameter detector (YSI, USA). Total nitrogen (TN), total phosphorus (TP), chemical oxygen demand (COD), ammonia nitrogen (NH4+), and nitrite (NO2-) were measured according to the standard methods (Wu et al., 2006).
2.3 DNA extraction and library constructionDNA was extracted from each filtered membrane by using the PowerWater DNA isolation kit following the manufacturer's manual (Mo Bio Laboratories, Inc., Carlsbad, CA). The concentration of DNA was evaluated using a Qubit 2.0 fluorometer (Life Technologies Japan Ltd., Tokyo, Japan). For the amplification of the V3–V4 domain of bacterial 16S rDNA, primers 341F (5′-CCCTACACGACGCTCTTCCGATCTG (barcode) CCTACGGGNGGCWGCAG-3′) and 805R (5′-GACTGGAGTTCCTTGGCACCCGAGAATTCCAGACTACHVGGGTATCTAATCC-3′) (Herlemann et al., 2011) were used, both of which contained an Illumina adapter region for sequencing on the Illumina MiSeqTM platform. In the forward primer, a 6-bp barcode was used to enable sample multiplexing. PCR was performed twice. The first-round PCR contained 10–20 ng DNA template, 1×Taq Master Mix (TaKaRa, Tokyo, Japan), and 2 pmole of both bar primer and reverse primer. Reaction conditions consisted of an initial 94℃ for 3 min, followed by 5 cycles of 94℃ for 30 s, 45℃ for 20 s, and 65℃ for 30 s; 20 cycles of 94℃ for 20 s, 55℃ for 20 s, 72℃ for 30 s, and a final extension of 72℃ for 5 min. Illumina Bridge PCR primer, which contained 20 ng DNA template, 1×Taq Master Mix (TaKaRa, Tokyo, Japan), and 2 pmol of each primer were added during the second-round PCR. Reaction conditions consisted of an initial 95℃ for 30 s, followed by 5 cycles of 95℃ for 15 s, 55℃ for 15 s, and 72℃ for 30 s with the final extension of 72℃ for 5 min. All samples were analyzed on the T100TM Thermal Cycler (Bio-Rad, NY, USA). Amplicons were purified using the QIAquick 96 kit (Qiagen) and quantified using the Qubit2.0 fluorometer (Life Technologies Japan Ltd., Tokyo, Japan). Gel purification was performed using QIAquick gel extraction kit (Qiagen). All operations were performed according to the respective manufacturer's instructions. Finally, 10 ng of each PCR product was mixed for sequencing, and the final concentration of PCR reaction was 20 pmole.
2.4 Data analysesRaw Illumina FASTQ files were demultiplexed, quality filtered, and analyzed using Cutadapt (Martin, 2011), PEAR (Zhang et al., 2014), Prinseq (Schmieder and Edwards, 2011), QIIME (Caporaso et al., 2010), and mothur (Schloss et al., 2009). Operational taxonomic units (OTUs) were assigned using the QIIME implementation of USEARCH (Edgar, 2010) with a threshold of 97% pairwise identity, and representative sequences from each OTU were selected for taxonomic assignment. OTUs were classified taxonomically by using Mothur method, and singleton OTU tag was removed prior to analysis. Multiple indices (observed OTUs, Chao 1 richness, Shannon's index, and Simpson's index) were calculated using the QIIME package to represent diversity.
2.5 StatisticAll statistical analyses were performed in the R environment using VEGAN (Dixon, 2003), grid (Wegener et al., 2009), and ggplot2 (Wickham, 2016) packages. Results were presented as mean values ± standard deviation. PCA was calculated by euclidian distance. A detrended correspondence analysis was performed before further analyses. The unimodally distributed model was used for canonical correlation analysis (CCA). For the principal component analysis (PCA) and CCA, logarithmic results were used; logarithmic result=log(otu#+1). Significance test (Student's t-test) was completed using SPSS (version 22.0).
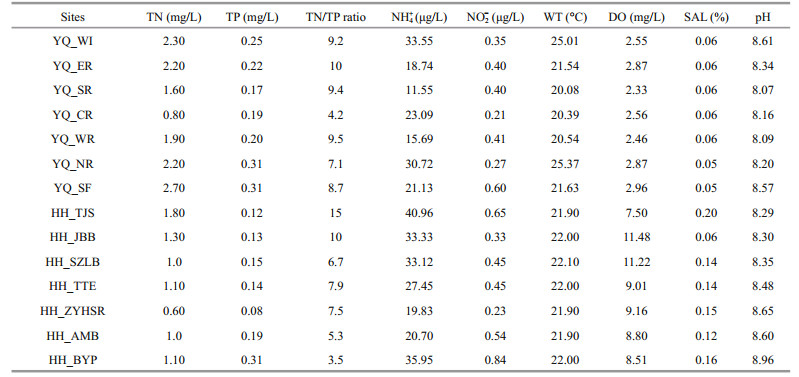
3 RESULT 3.1 Environmental parametersThe characteristics of the surface water samples from Yuqiao Reservoir and Haihe River are summarized in Table 1. The weather during the sampling process was sunny. WT was not significantly different and was in the range of 20.08℃ to 25.01℃. DO in Haihe River was higher than that in Yuqiao Reservoir. In most of the sampling sites, TN in Yuqiao Reservoir was higher than that in Haihe River. However, center of the reservoir, had TN of 0.80 mg/L, which lower than in other sampling sites in Yuqiao. Nitrogen and phosphorus were spatially in fluctuating state. COD in Yuqiao Reservoir (8.17±0.69 mg/L) was significantly higher than that in Haihe River (2.60±1.18 mg/L). The SAL of water in Yuqiao Reservoir was more stable than that in Haihe River.
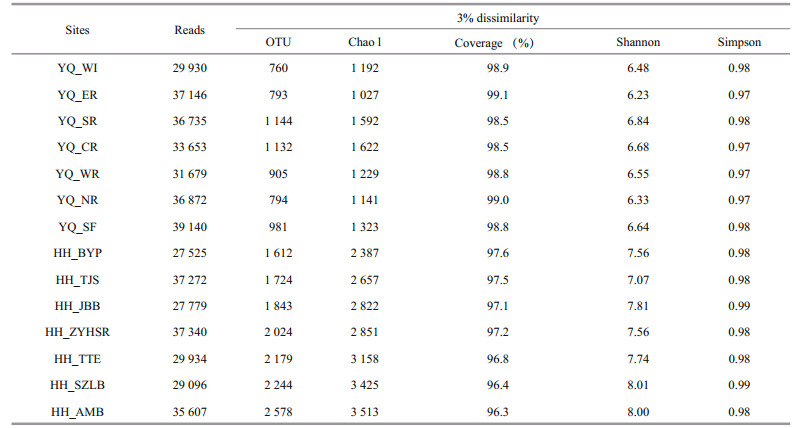
After quality control, the OTU singleton was removed. A total of 5 001 OTUs were obtained and clustered from 46 9708 filtered 16S V3–V4 region sequences. The largest number of reads was obtained from sample YQ_SF, whereas the highest value of OTUs was observed at HH_AMB. Compared with Yuqiao Reservoir, Haihe River showed high diversity in all kinds of diversity indices we selected (OTU number, Chao 1, good coverage, Shannon, Simpson) during our research period.
All samples were analyzed using a subsample for alpha diversity analysis. The minimum number of OTU counts (27 525) was assigned as e value. As summarized in Table 2, most sampling sites in Haihe River had greater richness than those in Yuqiao Reservoir. With the increasing sequence depths, the rarefaction curves had become flat. No higher diversity value was observed, and our subsample amount was sufficient to reflect the diversity for each sample. OTU number curves, Chao 1 index, and Shannon index showed high diversity in Haihe River.

|
| Figure 2 Rarefaction curves for a dissimilarity of 3% from the 14 samples The shade showed standard errors for two groups and the curves were fitted by loess method. a. alpha diversity indices for each sample; b. alpha diversity indices for two groups. |
The script assign_taxonomy.py in QIIME software was used to assign the taxonomy information into different phylogenetic bacterial taxa. This method was called "mothur". The relative abundance of bacterial community at phylum level is shown in Fig. 3. Proteobacteria were the most abundant phylum in all experimental sites accounting for 53.3% of total bacterial sequences, followed by Bacteroidetes (10.4%), Firmicutes (7.1%), Actinobacteria (7.1%), Verrucomicrobia (6.9%), and cyanobacteria (5.7%). The relative abundances of both Bacteroidetes and Planctomycetes in Yuqiao Reservoir were higher than those in Haihe River, However, the relative abundances of Firmicutes and Verrucomicrobia in Haihe River were higher than those in Yuqiao Reservoir. The cyanobacterial genera with relative abundance greater than 0.001 were analyzed to further understand the differences in cyanobacterial genera between the two water areas (Fig. 4). Microcystis had the biggest abundance in Yuqiao Reservoir; however, Synechococcus was dominant among all cyanobacterial genera in Haihe River. By analyzing the relative abundances of cyanobacterial taxa, two significantly different cyanobacterial communities were found in the two water areas (P < 0.01), with Microcystis taking an absolutely large part in cyanobacterial organisms in Yuqiao and Synechococcus dominating but other cyanobacterial taxa co-existing in Haihe River (Fig. 4)

|
| Figure 3 Relative abundance of bacterial community composition in the 14 samples at the phylum level |

|
| Figure 4 Cyanobacterial communities and eukaryotic algae with chloroplast based on the abundance of the samples The OTUs with relative abundance greater than 0.001 were reserved; UC represents the unclassified. |
PCA analysis revealed that all samples in Yuqiao Reservoir were clearly clustered in a group, indicating that the samples in Yuqiao Reservoir had high similarity in community characters. By contrast, the samples in Haihe River were separated into different diverse zones. Results indicated that the microbial community composition in Yuqiao Reservoir was more consistent than that in Haihe River (Fig. 5)

|
| Figure 5 Principal component analysis for relative abundance of OTUs in two water areas, and all OTU numbers were added one and then performed a logarithmic transformation |
We used CCA to detect the correlations between OTU abundance of 14 sampling sites with 9 selected environmental variables (TN, TP, ratio of TN and TP, ammonia, nitrite, WT, DO, SAL, and pH). As presented in Fig. 6, the water samples in Yuqiao Reservoir and Haihe River were clearly divided. Among all the environmental factors, the investigated communities were significantly distributed against the gradient of DO, SAL, TN, and TP. Seems to be mainly affected by these factors. In Yuqiao Reservoir, TP and TN were positive factors to most sample sites, and DO, SAL, NH4+, and pH were negative factors. YQ_CR had weaker relation to these factors than other Yuqiao sites. Interestingly, to the species in Haihe River, the distribution in CCA plot was divided in to three different groups. They have both positive correlation to DO, SAL, and NH4+ but at different levels. The HH_TTE, HH_AMB, HH_TJS, and HH_ BYP were weakly affected by the listed environmental factors. HH_SZLB showed close relationship with DO, SAL, and pH. HH_JBB and HH_ZYHSR were affected by the different formations of nitrogen.

|
| Figure 6 CCA analysis for the relationship between environmental factors and the relative abundance of bacteria All OTU numbers were added one and then performed a logarithmic transformation. The length of arrows shows the contribution of environmental factors. The angles between samples and environmental factors shows the correlation. An acute angle means positive correlation, and an obtuse angle means negative correlation. |
To elucidate the mechanism by which cyanobacterial blooms form and factors control their formation, various studies were conducted on the relationship between cyanobacterial biomass, cyanotoxin production, nutrients, water residence time, and circulation (Vincent et al., 1993; Palíková et al., 2007; Harvey, 2012; Romo et al., 2013; Sinang et al., 2013). Specifically, for Microcystis-dominated blooms, an increasing number of studies were focused on spatiotemporal dynamics of Microcystis populations based on molecular genetic markers (Briand et al., 2009). These studies revealed that many Microcystis genotypes coexists in a certain bloom, and a succession of dominant genotypes occurs along the development of the bloom (Bozarth et al., 2010). Further studies based on molecular biological methods showed that picocyanobacterial Synechococcus group could largely co-occur and even dominate in superficially Microcystis-based blooms in southern Chinese lakes (Li et al., 2014). In this study, we provided the occurrence of both Microcystis- and Synechococcus-dominated blooms along the reservoir-river water system in the north of China, the latter one representing the case with higher Synechococcus abundance than the Microcystis one. Studies are rare providing information on cyanobacterial blooms in a large water body in northern China. Our study is the first study aiming at the different cyanobacterial domination patterns during a bloom and their relationship with aquatic bacterial communities in northern China. Such an integrated water system as Yuqiao Reservoir and Haihe River offer a natural experiment model to understand microbial community structures under different cyanobacterial domination patterns.
In the present study, Illumina-based 16S rRNA gene sequencing and subsequent analyses revealed the significant differences in cyanobacterial composition between Yuqiao Reservoir and Haihe Ricer (P < 0.01), with more Synechococcus abundance in Haihe River. Therefore, Yuqiao and Haihe were spatially dividedinto Microcystis- and Synechococcus-dominated patterns, respectively, during the bloom. The higher eutrophication in Yuqiao Reservoir was suggested to cause the annual the Microcystis-dominated blooms in recent years, and the nutrient levels as shown in Table 1 also indicated the trophic state in the reservoir. The dominance of Synechococcus posed a very interesting finding. The dominance of Synechococcus has been well known in both marine and freshwater environments (Li, 1998; Takasu et al., 2015). In marine systems, Synechococcus favors mesotrophic conditions (Grob et al., 2007; Post et al., 2011). However, the occurrence of Synechococcus in freshwater was found in all trophic states, and Synechococcus even dominated in oligotrophic lakes in Germany (Ruber et al., 2016) and eutrophic lakes in southern China (Cai et al., 2013). Compared with Yuqiao Reservoir, a lower trophic state in Haihe River was implicated as the main potential factor to cause the dominance of Synechococcus, in agreement with the finding of Ruber et al. (2016).
Further analyses showed that microbial community structures in Yuqiao Reservoir and Haihe River largely differed, represented as higher Bacteroidetes and Planctomycetes in Yuqiao Reservoir and higher Firmicutes and Verrucomicrobia in Haihe River. Bacteroidetes was the most representative group in clone libraries of four bloom-forming lakes (Eiler and Bertilsson, 2004). Hu et al. (2013) observed that Bacteroidetes had an obvious correlation with the dominant Microcystis-based bloom in Lake Erhai. Shi et al. (2010) found that, by the semi-nested PCR and DGGE methods, Serratia (Proteobacteria), Pseudomonas (Proteobacteria), and Flexibacteraceae (Bacteroidetes) were the dominant bacterial groups in the M. flos-aquae, M. wesenbergii, and M. aeruginosa blooms in Lake Taihu, respectively, consistent with our analyses on the relative abundance of the microbial community in Yuqiao samples. Thus, these findings and the result obtained in this study may implicate the role of Bacteroidetes in the formation of Microcystis-dominated blooms. With regard to the association of Planctomycetes with Microcystis blooms, Cai et al. (2013) indicated that Planctomycetes tightly attached to carpet-like mucilaginous cyanobacterial blooms might play a key role in the carbon and nutrient cycling. Further, they speculated that the ecological role of Planctomycetes from the Lake Taihu blooms was linked to the degradation of sulfated polysaccharides produced by cyanobacteria. This finding in Lake Taihu is meaningful to the case in Yuqiao Reservoir, and the higher abundance of Planctomycetes in Yuqiao Reservoir may signify the degradation of the Microcystis bloom. Soon the same bloom flowing into Haihe River would likely be degraded by the combined effect of this microbial community attached to the Microcystis colonies in Yuqiao Reservoir and environmental conditions in Haihe River. Consequently, Synechococcus dominance would occur in Haihe River.
However, very few studies have been previously conducted to reveal the association of bacterial community with dominance of Synechococcus-like picocyanobacteria in freshwaters, and more samples from Synechococcus-dominated freshwater environments are needed to detect their associated microbial community structures in future studies.
An important ecological method for understanding microbial community structures is to determine the possible environmental factors and their contribution to the variation of bacterial communities. Several environmental factors, including WT (Moll et al., 1999), DO (Stadler and Love, 2016), nitrogen (Robles et al., 2015), and phosphorus (Carvalho et al., 2007), were reported to be effective factors on the distribution of aquatic bacterial communities. The CCA analyses for bacterial communities in the two waters revealed different patterns because they were significantly related to different environmental factors. Among them, DO, TN, and TP were strongly related to the microbial community structure in the Yuqiao and Haihe.
In general, the interesting results obtained in the present study were largely due to the fast development of molecular biological technologies, especially for the availability of high-throughput sequencing method. By using the advanced approach, Synechococcus detection was done using a large amount, which is unlikely to be done under the traditional microscopic examination. It is expected that more studies in future will reveal more cases with picocyanobacterial dominance in all trophic states in freshwaters and possible linkage between this dominance and microbial community structures.
5 CONCLUSIONBy using next-generation sequencing, the Microcystis- and Synechococcus-dominated patterns were found in two water areas within a water system along a cyanobacterial bloom in Tianjin City. Both dominations were strongly related to several environmental factors, such as TN, TP, and DO, reflecting the role of trophic states. The Microcystis-dominated pattern was shown to have a relatively high abundance of Bacteroidetes and Planctomycetes, whereas the Synechococcus dominance was possibly related to the high abundance of Firmicutes and Verrucomicrobia. The application of high-throughput sequencing could offer a broader field of vision in analyzing microbial community structures.
6 ACKNOWLEDGMENTWe would like to thank ZHENG Tao, JI Dongdong, QIN Yiming and LI Na at Tianjin Agricultural University for their work to sample collecting. Especially thank to Ms. CAO Qi for her support to data arrangement.
Bertos-Fortis M, Farnelid H M, Lindh M V, Casini M, Andersson A, Pinhassi J, Legrand C. 2016. Unscrambling cyanobacteria community dynamics related to environmental factors. Frontiers in Microbiology, 7: 625.
|
Bozarth C S, Schwartz A D, Shepardson J W, Colwell F S, Dreher T W. 2010. Population turnover in a Microcystis bloom results in predominantly nontoxigenic variants late in the season. Applied and Environmental Microbiology, 76(15): 5 207-5 213.
DOI:10.1128/AEM.00001-10 |
Briand E, Escoffier N, Straub C, Sabart M, Quiblier C, Humbert J F. 2009. Spatiotemporal changes in the genetic diversity of a bloom-forming Microcystis aeruginosa(cyanobacteria) population. The ISME Journal, 3(4): 419-429.
DOI:10.1038/ismej.2008.121 |
Brunberg A K. 1999. Contribution of bacteria in the mucilage of Microcystis spp. (Cyanobacteria) to benthic and pelagic bacterial production in a hypereutrophic lake. FEMS Microbiology Ecology, 29(1): 13-22.
DOI:10.1111/fem.1999.29.issue-1 |
Cai H Y, Yan Z S, Wang A J, Krumholz L R, Jiang H L. 2013. Analysis of the attached microbial community on mucilaginous cyanobacterial aggregates in the eutrophic Lake Taihu reveals the importance of Planctomycetes. Microbial Ecology, 66(1): 73-83.
DOI:10.1007/s00248-013-0224-1 |
Cai Y F, Kong F X. 2013. Diversity and dynamics of picocyanobacteria and the bloom-forming cyanobacteria in a large shallow eutrophic lake (Lake Chaohu, China). Journal of Limnology, 72(3): 473-484.
|
Caporaso J G, Kuczynski J, Stombaugh J, Bittinger K, Bushman F D, Costello E K, Fierer N, Peña A G, Goodrich J K, Gordon J I, Huttley G A, Kelley S T, Knights D, Koenig J E, Ley R E, Lozupone C A, McDonald D, Muegge B D, Pirrung M, Reeder J, Sevinsky J R, Turnbaugh P J, Walters W A, Widmann J, Yatsunenko T, Zaneveld J, Knight R. 2010. QⅡME allows analysis of high-throughput community sequencing data. Nature Methods, 7(5): 335-336.
DOI:10.1038/nmeth.f.303 |
Carvalho G, Lemos P C, Oehmen A, Reis M A M. 2007. Denitrifying phosphorus removal:linking the process performance with the microbial community structure. Water Research, 41(19): 4 383-4 396.
DOI:10.1016/j.watres.2007.06.065 |
Chen C, Zhang Z C, Ding A Z, Wu J Y, Xiao J F, Sun Y J. 2011. Bar-coded pyrosequencing reveals the bacterial community during Microcystis water bloom in Guanting reservoir, Beijing. Procedia Engineering, 18: 341-346.
DOI:10.1016/j.proeng.2011.11.054 |
Dixon P. 2003. VEGAN, a package of r functions for community ecology. Journal of Vegetation Science, 14(6): 927-930.
DOI:10.1111/j.1654-1103.2003.tb02228.x |
Edgar R C. 2010. Search and clustering orders of magnitude faster than BLAST. Bioinformatics, 26(19): 2 460-2 461.
DOI:10.1093/bioinformatics/btq461 |
Eiler A, Bertilsson S. 2004. Composition of freshwater bacterial communities associated with cyanobacterial blooms in four Swedish lakes. Environmental Microbiology, 6(12): 1 228-1 243.
DOI:10.1111/emi.2004.6.issue-12 |
Fleming L E, Rivero C, Burns J, Williams C, Bean J A, Shea K A, Stinn J. 2002. Blue green algal (cyanobacterial) toxins, surface drinking water, and liver cancer in Florida. Harmful Algae, 1(2): 157-168.
DOI:10.1016/S1568-9883(02)00026-4 |
Grob C, Ulloa O, Li W K W, Alarcón G, Fukasawa M, Watanabe S. 2007. Picoplankton abundance and biomass across the eastern South Pacific Ocean along latitude 32.5°S. Marine Ecology Progress Series, 332: 53-62.
DOI:10.3354/meps332053 |
Harke M J, Steffen M M, Gobler C J, Otten T G, Wilhelm S W, Wood S A, Paerl H W. 2016. A review of the global ecology, genomics, and biogeography of the toxic cyanobacterium, Microcystis spp. Harmful Algae, 54: 4-20.
DOI:10.1016/j.hal.2015.12.007 |
Harvey T S. 2012. Cyanobacteria blooms:Maya peoples between the politics of risk and the threat of disaster. Medical Anthropology, 31(6): 477-496.
DOI:10.1080/01459740.2012.658588 |
Herlemann D P, Labrenz M, Jürgens K, Bertilsson S, Waniek J J, Andersson A F. 2011. Transitions in bacterial communities along the 2 000 km salinity gradient of the Baltic Sea. The ISME Journal, 5(10): 1 571-1 579.
DOI:10.1038/ismej.2011.41 |
Hu M M, Li Y H, Wang Y C, Zhou H D, Liu Y D, Zhao G F. 2013. Phytoplankton and bacterioplankton abundances and community dynamics in Lake Erhai. Water Science & Technology, 68(2): 348-356.
|
Javůrek J, Sychrová E, Smutná M, Bittner M, Kohoutek J, Adamovský O, Nováková K, Smetanová S, Hilscherová K. 2015. Retinoid compounds associated with water blooms dominated by Microcystis species. Harmful Algae, 47: 116-125.
DOI:10.1016/j.hal.2015.06.006 |
Jiang Y G, Xiao P, Liu Y, Wang J X, Li R H. 2017. Targeted deep sequencing reveals high diversity and variable dominance of bloom-forming cyanobacteria in eutrophic lakes. Harmful Algae, 64: 42-50.
DOI:10.1016/j.hal.2017.03.006 |
Klawonn I, Bonaglia S, Brüchert V, Ploug H. 2015. Aerobic and anaerobic nitrogen transformation processes in N2-fixing cyanobacterial aggregates. The ISME Journal, 9(6): 1 456-1 466.
DOI:10.1038/ismej.2014.232 |
Kong P, Richardson P, Hong C X. 2017. Diversity and community structure of cyanobacteria and other microbes in recycling irrigation reservoirs. PLoS One, 12(3): e0173903.
DOI:10.1371/journal.pone.0173903 |
Lee J Z, Burow L C, Woebken D, Everroad R C, Kubo M D, Spormann A M, Weber P K, Pett-Ridge J, Bebout B M, Hoehler T M. 2014. Fermentation couples Chloroflexi and sulfate-reducing bacteria to Cyanobacteria in hypersaline microbial mats. Frontiers in Microbiology, 5: 61.
|
Li W K W. 1998. Annual average abundance of heterotrophic bacteria and Synechococcus in surface ocean waters. Limnology and Oceanography, 43(7): 1 746-1 753.
DOI:10.4319/lo.1998.43.7.1746 |
Li X C, Li S C, Kong R Q, Li R H. 2016. Molecular separation of two long taxonomically debated cyanobacterial genera Cylindrospermopsis and Raphidiopsis (Nostocales) based on the ITS-L phylogeny. Harmful Algae, 57: 88-97.
DOI:10.1016/j.hal.2016.06.003 |
Li Z H, Lin S Q, Liu X L, Tan J, Pan J L, Yang H. 2014. A freshwater bacterial strain, Shewanella sp. Lzh-2, isolated from Lake Taihu and its two algicidal active substances, hexahydropyrrolo[1, 2-a]pyrazine-1, 4-dione and 2, 3-indolinedione. Applied Microbiology and Biotechnology, 98(10): 4 737-4 748.
DOI:10.1007/s00253-014-5602-1 |
Liu X S, Shi C F, Xu X G, Li X J, Xu Y, Huang H Y, Zhao Y P, Zhou Y W, Shen H C, Chen C, Wang G X. 2017. Spatial distributions of β-cyclocitral and β-ionone in the sediment and overlying water of the west shore of Taihu Lake. Science of the Total Environment, 579: 430-438.
DOI:10.1016/j.scitotenv.2016.11.079 |
Lone Y, Koiri R K, Bhide M. 2015. An overview of the toxic effect of potential human carcinogen Microcystin-LR on testis. Toxicology Reports, 2: 289-296.
DOI:10.1016/j.toxrep.2015.01.008 |
Martin M. 2011. Cutadapt removes adapter sequences from high-throughput sequencing reads. EMBnet Journal, 17(1): 10-12.
DOI:10.14806/ej.17.1 |
Maruyama T, Kato K, Yokoyama A, Tanaka T, Hiraishi A, Park H D. 2003. Dynamics of microcystin-degrading bacteria in mucilage of Microcystis. Microbial Ecology, 46(2): 279-288.
DOI:10.1007/s00248-002-3007-7 |
Moll D M, Summers R S, Fonseca A C, Matheis W. 1999. Impact of temperature on drinking water biofilter performance and microbial community structure. Environmental Science & Technology, 33(14): 2 377-2 382.
|
O'Neil J M, Davis T W, Burford M A, Gobler C J. 2012. The rise of harmful cyanobacteria blooms:the potential roles of eutrophication and climate change. Harmful Algae, 14: 313-334.
DOI:10.1016/j.hal.2011.10.027 |
Paerl H W, Huisman J. 2008. Blooms like it hot. Science, 320(5872): 57-58.
DOI:10.1126/science.1155398 |
Palíková M, Krejčí R, Hilscherová K, Babica P, Navrátil S, Kopp R, Bláha L. 2007. Effect of different cyanobacterial biomasses and their fractions with variable microcystin content on embryonal development of carp (Cyprinus carpio L.). Aquatic Toxicology, 81(3): 312-318.
DOI:10.1016/j.aquatox.2007.01.001 |
Parulekar N N, Kolekar P, Jenkins A, Kleiven S, Utkilen H, Johansen A, Sawant S, Kulkarni-Kale U, Kale M, Saebø M. 2017. Characterization of bacterial community associated with phytoplankton bloom in a eutrophic lake in South Norway using 16S rRNA gene amplicon sequence analysis. PLoS One, 12(3): e0173408.
DOI:10.1371/journal.pone.0173408 |
Parveen B, Ravet V, Djediat C, Mary I, Quiblier C, Debroas D, Humbert J F. 2013. Bacterial communities associated with Microcystis colonies differ from free-living communities living in the same ecosystem. Environmental Microbiology Reports, 5(5): 716-724.
|
Post A F, Penno S, Zandbank K, Paytan A, Huse S M, Welch D M. 2011. Long term seasonal dynamics of Synechococcus population structure in the Gulf of Aqaba, Northern Red Sea. Frontiers in Microbiology, 2: 131.
|
Robles Aguilar A A, Grunert O, Boon N, Temperton V, Blossfeld S, Hernandez-sanabria E, Reheul D, Jablonowski N D. 2015. Microbial community structure in the rhizosphere of narrow-leafed lupin and tomato as related to nitrogen form provided. FZJ-2015-06132.
|
Romo S, Soria J, Fernández F, Ouahid Y, Barón-Solá Á. 2013. Water residence time and the dynamics of toxic cyanobacteria. Freshwater Biology, 58(3): 513-522.
DOI:10.1111/fwb.2013.58.issue-3 |
Ruber J, Bauer F R, Millard A D, Raeder U, Geist J, Zwirglmaier K. 2016. Synechococcus diversity along a trophic gradient in the Osterseen Lake District, Bavaria. Microbiology, 162(12): 2 053-2 063.
DOI:10.1099/mic.0.000389 |
Schloss P D, Westcott S L, Ryabin T, Hall J R, Hartmann M, Hollister E B, Lesniewski R A, Oakley B B, Parks D H, Robinson C J, Sahl J W, Stres B, Thallinger G G, Van Horn D J, Weber C F. 2009. Introducing mothur:opensource, platform-independent, community-supported software for describing and comparing microbial communities. Applied and Environmental Microbiology, 75(23): 7 537-7 541.
DOI:10.1128/AEM.01541-09 |
Schmieder R, Edwards R. 2011. Quality control and preprocessing of metagenomic datasets. Bioinformatics, 27(6): 863-864.
DOI:10.1093/bioinformatics/btr026 |
Shen H, Niu Y, Xie P, Tao M, Yang X. 2011. Morphological and physiological changes in Microcystis aeruginosa as a result of interactions with heterotrophic bacteria. Freshwater Biology, 56(6): 1 065-1 080.
DOI:10.1111/fwb.2011.56.issue-6 |
Shi L M, Cai Y F, Kong F X, Yu Y. 2012. Specific association between bacteria and buoyant Microcystis colonies compared with other bulk bacterial communities in the eutrophic Lake Taihu, China. Environmental Microbiology Reports, 4(6): 669-678.
|
Shi L M, Cai Y F, Wang X Y, Li P F, Yu Y, Kong F X. 2010. Community structure of bacteria associated with Microcystis colonies from cyanobacterial blooms. Journal of Freshwater Ecology, 25(2): 193-203.
DOI:10.1080/02705060.2010.9665068 |
Sinang S C, Reichwaldt E S, Ghadouani A. 2013. Spatial and temporal variability in the relationship between cyanobacterial biomass and microcystins. Environmental Monitoring and Assessment, 185(8): 6 379-6 395.
DOI:10.1007/s10661-012-3031-0 |
Stadler L B, Love N G. 2016. Impact of microbial physiology and microbial community structure on pharmaceutical fate driven by dissolved oxygen concentration in nitrifying bioreactors. Water Research, 104: 189-199.
DOI:10.1016/j.watres.2016.08.001 |
Stuart R K, Mayali X, Lee J Z, Everroad R C, Hwang M, Bebout B M, Weber P K, Pett-Ridge J, Thelen M P. 2016. Cyanobacterial reuse of extracellular organic carbon in microbial mats. The ISME Journal, 10(5): 1 240-1 251.
DOI:10.1038/ismej.2015.180 |
Takasu H, Ushio M, LeClair J E, Nakano S I. 2015. High contribution of Synechococcus to phytoplankton biomass in the aphotic hypolimnion in a deep freshwater lake(Lake Biwa, Japan). Aquatic Microbial Ecology, 75(1): 69-79.
DOI:10.3354/ame01749 |
Verspagen J M H, Van de Waal D B, Finke J F, Visser P M, Van Donk E, Huisman J. 2014. Rising CO2 levels will intensify phytoplankton blooms in eutrophic and hypertrophic lakes. PLoS One, 9(8): e104325.
DOI:10.1371/journal.pone.0104325 |
Vincent W F, Castenholz R W, Downes M T, Howard-williams C. 1993. Antarctic cyanobacteria:light, nutrients, and photosynthesis in the microbial mat environment. Journal of Phycology, 29(6): 745-755.
DOI:10.1111/j.0022-3646.1993.00745.x |
Visser P M, Verspagen J M H, Sandrini G, Stal L J, Matthijs H C P, Davis T W, Paerl H W, Huisman J. 2016. How rising CO2 and global warming may stimulate harmful cyanobacterial blooms. Harmful Algae, 54: 145-159.
DOI:10.1016/j.hal.2015.12.006 |
Wegener D, Sengstag T, Sfakianakis S, Rüping S, Assi A. 2009. GridR:an R-based tool for scientific data analysis in grid environments. Future Generation Computer Systems, 25(4): 481-488.
DOI:10.1016/j.future.2008.09.004 |
Wickham H. 2016. ggplot2: Elegant Graphics for Data Analysis. 2nd edn. Springer, Heidelberg. p. 180-185.
|
Wirsing B, Hoffmann L, Heinze R, Klein D, Daloze D, Braekman J C, Weckesser J. 1998. First report on the identification of microcystin in a water bloom collected in Belgium. Systematic and Applied Microbiology, 21(1): 23-27.
DOI:10.1016/S0723-2020(98)80004-0 |
Wu S K, Xie P, Liang G D, Wang S B, Liang X M. 2006. Relationships between microcystins and environmental parameters in 30 subtropical shallow lakes along the Yangtze River, China. Freshwater Biology, 51(12): 2 309-2 319.
DOI:10.1111/fwb.2006.51.issue-12 |
Xie M L, Ren M L, Yang C, Yi H S, Li Z, Li T, Zhao J D. 2016. Metagenomic analysis reveals symbiotic relationship among bacteria in Microcystis-dominated community. Frontiers in Microbiology, 7: 56.
|
Ye W J, Tan J, Liu X L, Lin S Q, Pan J L, Li D T, Yang H. 2011. Temporal variability of cyanobacterial populations in the water and sediment samples of Lake Taihu as determined by DGGE and real-time PCR. Harmful Algae, 10(5): 472-479.
DOI:10.1016/j.hal.2011.03.002 |
Zhang J J, Kobert K, Flouri T, Stamatakis A. 2014. PEAR:a fast and accurate Illumina Paired-End reAd mergeR. Bioinformatics, 30(5): 614-620.
DOI:10.1093/bioinformatics/btt593 |
Zhang M, Zhang Y C, Yang Z, Wei L J, Yang W B, Chen C, Kong F X. 2016. Spatial and seasonal shifts in bloomforming cyanobacteria in Lake Chaohu:patterns and driving factors. Phycological Research, 64(1): 44-55.
DOI:10.1111/pre.2016.64.issue-1 |
Zhu M L, Xu Y, Li R H. 2012. Genetic diversity of bloomforming Microcystis (Cyanobacteria) populations in a hyper-eutrophic pond in Central China. Current Microbiology, 65(3): 219-224.
DOI:10.1007/s00284-012-0146-z |