 2018, Vol. 36
Institute of Oceanology, Chinese Academy of Sciences
Article Information
- YE Huping(叶虎平), LI Junsheng(李俊生), ZHU Jianhua(朱建华), SHEN Qian(申茜), LI Tongji(李铜基), ZHANG Fangfang(张方方), YUE Huanyin(岳焕印), ZHANG Bing(张兵), LIAO Xiaohan(廖小罕)
- Improvement of scattering correction for in situ coastal and inland water absorption measurement using exponential fitting approach
- Chinese Journal of Oceanology and Limnology, 36(4): 1198-1215
- http://dx.doi.org/10.1007/s00343-018-7037-5
Article History
- Received Feb. 11, 2017
- accepted in principle Apr. 12, 2017
- accepted for publication Jul. 3, 2017


2 University of Chinese Academy of Sciences, Beijing 100049, China;
3 National Ocean Technology Center, Tianjin 300112, China;
4 Sino-Africa Joint Research Center, Chinese Academy of Sciences, Wuhan 430074, China;
5 State Key Laboratory of Resources and Environmental Information System, Institute of Geographic Sciences and Natural Resources Research, Chinese Academy of Sciences, Beijing 100101, China
Light absorption by particulate material and dissolved organic matter is an important source of optical variability in ocean and inland surface water. This variability consequently affects light attenuation, primary production, remote sensing of phytoplankton biomass, and mixed-layer heating (Sosik and Mitchell, 1995; Bricaud et al., 2004; Kirk, 2010; Zhang et al., 2014). The light absorption properties of an aquatic medium are characterized by the absorption coefficient. Absorption coefficient a, scattering coefficient b, and attenuation coefficient c (c=a+b) are basic inherent optical properties (IOPs) of water that depend only on the medium and are independent of the ambient light field within the medium (Mobley, 1994). Although a is defined in terms of the behavior of light passing through an infinitesimal volume of a medium, its value can nevertheless be obtained from the observed absorptance of the layer of a medium with finite thickness provided that the scattering effects can be overcome (Kirk, 2010). Instruments specifically designed to measure a of surface water bodies, e.g., marine or inland, are referred to as absorption meters. The methods generally used to measure a of water involve collecting water samples at field stations and then analyzing them in laboratories using spectrophotometers (Roesler, 1998) or deploying meters in situ for water displacement measurement in profiling, moored, autonomous underwater vehicles, or towed applications. The widely adopted in situ instrument is the Western Environmental Technologies Laboratories (WET Labs) reflecting-tube nine-wavelength absorption and attenuation meter AC9 (or its hyper-spectral successor ACS) (Moore et al., 1992; Zaneveld et al., 1994; Twardowski et al., 1999; Sullivan et al., 2006). The reflective tube design uses a quartz tube and a diffuser in front of a large-area receiver. Consequently, the reflective-tube collects forwardly scattered light from the total reflection at the tube walls when light is scattered at angles smaller than the angle of total reflection, i.e., approximately 41.7° (Zaneveld et al., 1994). Most particle scattering is in the forward direction, which makes the reflective-tube design quite effective in water. However, some of light scatters at wider angles than 41.7°, which leads to systematic overestimation of a. The uncollected light leads to an error in the determination of the absorption coefficient, which is called "scattering error."
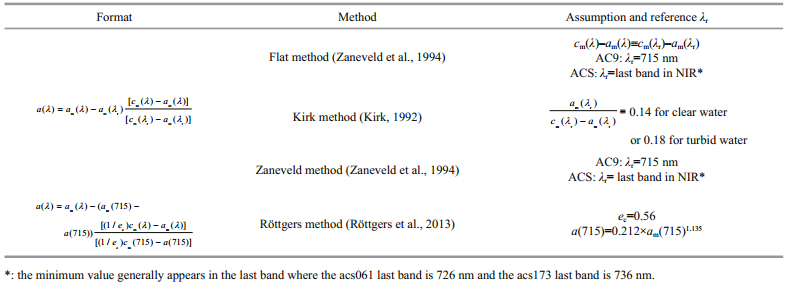
Various scattering correction schemes based on different assumptions have been proposed to correct the absorption measurements for scattering errors, such as the following: (1) The flat method (Zaneveld et al., 1994) involves subtracting the measured absorption at a near-infrared (NIR) reference wavelength where the absorption is assumed to be zero, e.g., λNIR=715 nm for AC9 or λNIR=750 nm or a longer band for measurements using a laboratory spectrophotometer. (2) The fixed-proportion method or Kirk method (Kirk, 1992) involves removing a fixed proportion (denoted by ε) of b, which is computed by subtracting a from c, where the volume scattering function (VSF) is assumed to be wavelength independent and without an NIR reference band. ε varies from approximately 0.14 for predominately biological particles in the open ocean (Case 1 water) to approximately 0.18 in waters where the scattering is predominantly due to suspended sediments (Case 2 water) (Pegau et al., 2003). (3) The varied proportional scattering correction method or Zaneveld method (Zaneveld et al., 1994), which is a standard method, assumes that a reference wavelength exists where a is negligible for particulate and dissolved materials. The VSF shape is independent of the wavelength. This technique allows for automatic changes in the scattering correction magnitude with wavelength and changes with the types of materials present (Pegau et al., 2003). The flat and Zaneveld methods, which are described in the National Aeronautics and Space Administration (NASA) Ocean Optics protocols (Pegau et al., 2003) and version Q of the AC meter protocol (2011), were the most commonly used methods in the past. They could provide reasonably good results in coastal waters for shorter wavelengths only but underestimate the absorption at longer wavelengths due to non-zero NIR absorption that invalidates the assumption (Röttgers et al., 2013). Several new approaches have been proposed in recent years to overcome and improve the earlier methods. (4) The iterative scattering correction method or McKee method (McKee et al., 2008, 2013) uses an iterative scattering correction scheme based on Monte Carlo simulations of the WET Labs AC9 optical layout, employing additional backscattering measurements to estimate the backscattering. (5) In the "true" value empirical method or Röttgers method (Röttgers et al., 2013), a laboratory-based point source integrating cavity absorption meter (PSICAM) is used to avoid scattering errors and to develop an empirical relationship between the "true" absorption at 715 nm and the AC9 offset-error-measured absorption at 715 nm. This correction method divides the attenuation by 0.56 to correct for acceptance angle effects. This method is employed to evaluate the absorption in coastal waters using AC9 meters by applying scattering corrections to the flat and Zaneveld methods. (6) The exponential fitting method or Boss method (Boss et al., 2013) assumes that the absorption spectra are dominated by non-algal particles (NAPs) in the Dead Sea where the spectra are nearly exponentially decreasing (with an unknown slope). A best-fit power law relationship is obtained by performing nonlinear least-squares minimization using measurements at the seven shortest AC9 wavelengths to find the scattering contribution by applying scattering correction to all of the absorption bands. The seven wavelengths are used, to avoid temperature and salinity effect in this fitting, as these are strongest for the last two wavelengths. Several other scattering correction methods have been proposed for WET Labs AC9 absorption data, such as using Monte Carlo modeling to examine residual scattering losses theoretically (Leymarie et al., 2010).
Inland and coastal Case 2 waters obviously exhibit absorption at wavelengths longer than 700 nm due to higher concentrations of detritus (Tassan and Ferrari, 2003; Röttgers et al., 2014). Therefore, the assumption that the absorption at 715 nm is zero in the flat and Zaneveld methods is invalid. Kirk's value of ε
We modified Boss' method into a technique that we termed as exponential method for application to in situ coastal and inland waters to avoid the zeroabsorption assumption in the NIR band and improve the underestimation in the red band that occurred in the standard scattering correction methods for Case 2 water absorption measurements. In addition, different scattering correction methods on the AC-9/ACS data were compared, and the error statistics for each water sampling type were calculated. The results from four typical water-sampling cruises obtained using these methods are presented in this paper. The exponential method is potentially suitable for retrospective application to historical data sets without requiring any additional data.
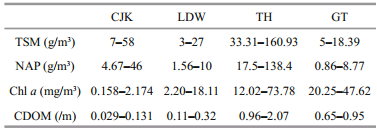
2 MATERIAL AND METHOD 2.1 Sample collection and analysisFor this study, Case 2 water samples were collected from a variety of sources: an estuary, a gulf, a lake, and reservoir water. In total, 103 surface samples were collected during four ship cruises: a cruise in the estuary of the Changjiang (Yangtze) River and its adjacent coastal area in the East China Sea on March 21–29, 2012 (CJK cruise) (Zhu et al., 2014); a cruise in the Liaodongwang Gulf in the Bohai Sea on July 14–19, 2011 (LDW cruise); a cruise on Lake Taihu on May 10–12, 2013 (TH cruise); and a cruise in the Guanting Reservoir on August 15, 2015 (GT cruise; see Table 1 and Fig. 1). Remote sensing reflectance Rrs(λ) in the sample stations cover four of the five types of Chinese coastal waters, which range from eutrophic to very turbid waters, and can be categorized as follows according to previous research results: phytoplankton and colored dissolved organic matter (CDOM) co-dominant waters, mixed waters with no dominant components, total suspended matter (TSM)- dominant waters, and water with very high suspended sediment concentrations. Samples of phytoplanktondominant or oligotrophic water were not collected (Ye et al., 2016). Rrs(λ) measurements were also obtained from three types of inland water: highly mixed eutrophic water, relatively clear water dominated by CDOM, and water dominated by nonliving solids (Shen et al., 2015).
|

|
| Figure 1 Sampling positions during the different cruises: CJK, LDW, TH, and GT cruises |
The data and measurement methods adopted for Rrs, a, absorption by CDOM or yellow matter ag, absorption by particles ap, b, and c, TSM concentration, NAP concentration, and phytoplankton (Chl a) concentration have been systematically described in the papers of Ye et al. (2016), Shen et al. (2015), and Zhu (2003). Their works are briefly reviewed below.
The coastal waters were measured using a 25-cm path-length tube AC9 [Serial No. (SN): ac90309] and an ACS (SN: acs061). The inland waters were measured using a 10 cm path-length tube AC9 (SN: ac90320) and an ACS (SN: acs173). The data were strictly obtained according to NASA Ocean Optics protocols for satellite ocean color sensor validation (Twardowski et al., 1999) and WET Labs AC meter protocol document (Version Q, 2011). The AC meter was regularly calibrated in the laboratory using bubble-free pure water (Milli-Q) before, during, and after the field campaigns. The calibration values were obtained by averaging a and c over a period of at least 45 s. The temperature of the outflow water was measured to enable temperature-dependent water absorption corrections to be applied. The entire process was repeated for three or more times until the replicated calibration values of each wavelength in each channel were within ±0.003/m of one another. The values of a and c were measured by profiling three times at a speed of less than 0.3 m/s to avoid the "time-lag" effect (the time required for a sample to transit from the intake, through the filter, into the flow tube, and finally to be measured) in the coastal cruises using Data Handler (DH4, WetLabs) software. During the inland cruises, the measurements were conducted over 60 s periods using WETView 7.0 (WetLabs) software. Simultaneously, conductivity, temperature, and depth (CTD) measurements were performed to obtain temperature and salinity profiles. The water samples in each station were collected and stored, and the absorption parameters such as a, ag, and ap were measured using the quantitative filter technique (QFT) using a UV/VIS Cintra20 spectrophotometer (GBC Scientific Equipment, Australia) (Bidigare et al., 1990; Roesler, 1998). Sample filter paper, namely, GF/F, with a diameter of 25 mm and a pore size of approximately 0.7 μm, was presoaked in 0.2 μm filtered seawater for 30 min and used to filter particles at 120–140 mm Hg negative pressure. A Cintra 20 spectrophotometer was used to measure the optical absorbance spectra of particles [ODfP(λ)] and blank filter (ODnull). The absorbance spectrum was interpolated to 1 nm wavelength resolution. A mean optical density of 11 nm, selected from 790 to 800 nm, was set as zero for null correction of the absorption values. The correction factors of Pegau et al. (2003) were used for the optical path-length amplification to calculate absorption coefficients using the formula ap(λ)=2.303A[ODfP(λ)–ODnull]/ (Vβ) and for further determination of the absorption coefficients of total particles [ap(λ)], where A represents the effective filter surface area (cm2) of suspended particles, V represents the sample volume (mL) of sample solution, and β represents the correction factor of amplified optical path-length. For ag(λ), the water samples were first filtered using Millipore membrane filters with a 0.2-μm pore size to remove the particulate materials. The null correction for ag(λ) absorption values was selected as the mean value from 690 to 700 nm (Zhu, 2003). The accuracy of the spectrophotometer measurements of particles ap(λ) < 6% and yellow matter ag(λ) < 10% was determined by calculating the average relative error in the visible bands by measuring replicated samples (each with multiple measurements). The Chl a concentrations were measured by using a spectrophotometer after the water samples had been filtered through 47 mm diameter filters (membrane filter with pore size of 0.7 μm). For the TSM and NAP measurements, the water samples were filtered using the previously weighed GF/F filters. The filters were dried at 105℃ for 24 h, weighed in the laboratory, and then combusted for 4 h at 550℃ and weighed again. TSM was assumed as the difference between the weight of the dried material and the initial weight of the unused filter, whereas NAP was assumed as the weight of combusted material (Pegau et al., 2003). Rrs(λ) was measured following the above-water methods described in the Ocean Optics protocol (Mueller et al., 2003) using an ASD FieldSpec spectroradiometer.
Since the AC9 and ACS measurements were referenced to blank values calibrated using pure water, the measured a and c values represent the absorption and attenuation of all of the materials, respectively, except for the water in each sample due to the subtraction of the latest pure water calibration data (i.e., the removal of a and c for pure water). The temperature and salinity effects were largest in the NIR region and were negligible in the visible region. The salinity and temperature effects on the seawater samples and temperature effect on the inland freshwater samples (where the salinity is near zero and therefore negligible) on the absorption and attenuation of pure water were removed following the recommended procedure using the temperature and salinity correction coefficients given by Pegau et al. (1997) for AC9 measurements and by Sullivan et al. (2006) for ACS measurements. In the following, absorption coefficient am(λ) and attenuation coefficient cm(λ) represent the measurements obtained after applying pure water, temperature, and salinity corrections, and the absorption coefficients obtained after applying the scattering corrections are denoted as a(λ).
2.2 Method 2.2.1 Flat, Kirk, Zaneveld, and Röttgers methodsSee Table S1.
The exponential method is a modification of the Boss method (Boss et al., 2013). The absorption spectrum is expected to be dominated by particles and yellow matter and is close to decreasing exponential function 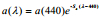
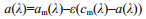
A nonlinear least-squares minimization technique is used in seven AC9 wavelengths (412, 440, 488, 510, 532, 555, and 715 nm) to obtain three unknowns: a (440) (/m), Sp (/nm), and ε. Using the obtained value therefore of ε, a(λ) is obtained by 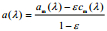
Using the five scattering correction methods (flat, Zaneveld, Röttgers, exponential, and Boss methods) and applying them to the four cruise data sets acquired by the AC9/ACS, we analyzed and evaluated the exponential method. We compared our exponential method with the standard Zaneveld method in various bands and cruises, evaluated the correction effects relative to those of other scattering correction methods in all the bands, and validated the corrected data with the ap(λ) and ag(λ) data acquired using a laboratory spectrophotometer.
3.1 AC9/ACS scattering correction 3.1.1 Application of exponential scattering correction method to AC9 measurementsThe water sample from the CJK-01 station is turbid (TSM=42 g/m3, NAP=34.7 g/m3, and Chla=0.24 mg/m3), and the raw absorption spectra are dominated by NAPs. The spectra are nearly exponentially or linearly decreasing, and without peaks at 676 nm (in contrast to those from the TH-10-0 station; see below). After application of the scattering correction (Fig. 2a), the apg values calculated using the exponential method are larger than those derived using the Zaneveld method. The values lie between those calculated using the flat and Zaneveld methods in the blue and green bands (≤600 nm). However, they are larger than the results obtained using these two methods in the red and NIR bands (> 600 nm). The absorption values calculated using the exponential method do not tend to zero at long wavelengths, and they are smaller than those of the Röttgers method across the entire range.

|
| Figure 2 Application of the five scattering correction methods to the AC9 data a. corrected data from the CJK-01 station (25 cm path-length tube) in the estuary of the Changjiang River and its adjacent coastal area; b. results of applying exponential scattering corrections to all the CJK cruise data; c. corrected data from the TH-10-0 station (10 cm path-length tube) in Lake Taihu; d. results of applying exponential scattering corrections to all the TH cruise data. |
The water sample from the TH-10-0 station is eutrophic and turbid (TSM=33.31 g/m3, NAP=18.06 g/m3, and Chl a=49.86 mg/m3), and the raw absorption spectra are dominated by NAPs in the short band and Chl a in the long band. The absorption coefficient spectra are nearly decreasing exponentials or linear in the blue and green bands (≤600 nm). They also exhibit small peaks at 676 nm. The results of the application of the exponential scattering-correction method to the data from the TH-10-0 station, which are shown in Fig. 2c, show behavior similar to that of the CJK-01 results. The exponential method results are close to those obtained using the flat method.
The analysis of the values obtained after applying the scattering corrections to the CJK and TH cruise data are described in Section 3.3. The absorption coefficients determined from the CJK cruise station data vary from 0.18 to 1.96/m in the 412 nm band after correction using the exponential method. These results are shown in Fig. 2b. The Rrs values of these station peaks at 490, 500–550, 565, and 570 nm or longer correspond to the phytoplankton and CDOM co-dominant waters, mixed waters with no dominant components, TSM-dominant waters, and very high suspended sediment concentrations in water, respectively, which are the most common types of coastal water (Zhu et al., 2014; Ye et al., 2016). The absorption values obtained from the TH cruise samples are obviously larger than those from the coastal cruise [a(412) > 3.7/m], as shown in Fig. 2d. The dominant three water types here are water dominated by NAPs [a(412) > 10/m], eutrophic water [a(676) > 2/m], and ordinary water (with a low peak at 676 nm). The TH absorption coefficients, similar to those obtained from the CJK cruise data, are nearly decreasing exponentials or linear but are much larger than those from the CJK cruise, which suggests that the water is dominated by NAPs (and CDOM) with high concentrations. The other water types show peaks at 676 nm, which suggest that the absorption due to phytoplankton in these water types is dominant in this band.
3.1.2 Application of exponential scattering correction method to ACS measurementsThe exponential method for AC9s is generally applicable to the hyper-spectral version of the same instrument (ACS), and the characteristics of the ACS absorption spectra are described below. The raw absorption spectra from the LDW-03 station (TSM=6.7 g/m3, NAP=6.0 g/m3, and Chla=2.45 mg/m3) are nearly decreasing exponentials with weak dips at 450 nm and small peaks at 650–700 nm. The results of the exponential scattering correction method are compared with those of the other three scattering correction methods and shown in Fig. 3a. The values generated using the exponential method closely approximate those obtained using the flat method in the blue and green bands (≤600 nm). The results of applying the exponential scattering corrections to all the LDW data are shown in Fig. 3b.

|
| Figure 3 Absorption and attenuation coefficients of the measurements from the ACS meters after applying the scattering correction a. corrected data from the LDW-03 station (25 cm path length) in the Gulf of Liaodongwang in Bohai Sea; b. results of applying exponential scattering corrections to all the data from the LDW cruise; c. corrected data from the GT-01 station (10 cm path length) in the Guanting Reservoir; d. results of applying exponential scattering corrections to all the data from the GT cruise. |
In the GT-01 station, the water is eutrophic (TSM=10 g/m3, NAP=4.44 g/m3, and Chl a= 47.62 mg/m3). In this case, the raw absorption spectra are strongly influenced by the absorption of algal particles, as shown in Fig. 3c. These spectra are neither decreasing exponentials nor linear and show small peaks at 440, 490, 632, and 676 nm caused by the absorption of most types of phytoplankton pigments (Hoepffner and Sathyendranath, 1991). In contrast, the absorption spectra in case of the reservoir upstream water are relatively smooth, as shown in Fig. 3d, where the only remaining obvious absorption peak occurs at 676 nm. The spectra remaining after applying the exponential scattering correction method retain the characteristics of the phytoplankton pigment absorption spectrum, and the values and shape are close to those resulting from the application of the Röttgers method. The absorption spectrum is not a decreasing exponential, which demonstrates that the exponential scattering correction method is relatively robust.
In summary, the corrected absorption values obtained using the exponential method are always between those of the flat and Zaneveld methods in the short band (≤600 nm). The spectra exhibit values greater than zero in the red and NIR regions. The values are smaller than those obtained from the Röttgers method. We should note that the original absorption coefficients do not need to be exponentially decreasing. The values fit well for turbid, eutrophic, and ordinary Case 2 water types.
3.2 Comparison of the exponential and standard Zaneveld scattering correction resultsThe corrected scattering values obtained using the exponential and standard Zaneveld methods are compared, as shown in Fig. 4. The values from the exponential method are always larger, and the relative variance is within -30% below the 555 nm band, whereas the variance is generally greater than -30% in the red and NIR bands. The bio-optical properties in the entire Guanting Reservoir are relatively uniform and similar. The absorption values only slightly vary and are relatively concentrated in a very narrow range. In the Zaneveld method, the correction is applied at the minimum NIR wavelength of 736 nm, which is the longest wavelength band in the ACS meter (SN: acs173). Consequently, all the values are greater than those in the NIR band at 715 nm. The absorption coefficients resulting from the exponential and Zaneveld methods, therefore, are within 30% of each other. This finding supports the rationality of the exponential method to some extent. For the LDW cruise (SN: acs061), the minimum band selected for the Zaneveld method is the NIR band at 726 nm. Few moderate turbid water stations in the LDW cruise yield larger absorption values, as shown in Fig. 3b, due to the existence of NIR absorption. The scattering-corrected values from the exponential method of the LDW station are close to those from the Zaneveld method and are within -30% in the red region. The difference between the results of the two methods is not significant or is negligible when the absorption coefficient is small because the absorption spectra between the NIR absorption coefficient of 715 nm and reference wavelength of 726 nm are flat. The results show that the values obtained using the exponential method in the red and NIR regions are larger than those derived using the standard Zaneveld method in the same regions. In the longer NIR reference band and at longer NIR wavelengths (refer to the TSM concentration), the results of the two scattering correction methods are in good agreement, which indicate that the exponential method works reasonably well.

|
| Figure 4 Comparison of the results obtained after applying the exponential and standard Zaneveld scattering correction methods for different cruises and bands The solid lines are 1:1 lines, and the dashed lines are +/-30% lines |
The flat and Zaneveld methods are the most widely applied and instrumentally recommended scattering correction methods and have been validated in multiple water types around the world. The disadvantages associated with these two methods are the invalid NIR zero-absorption assumption for Case 2 water and NIR overcorrection (McKee et al., 2013). In the Röttgers method, the experiential model developed based on measured data using PSICAMs without scattering errors is applied. This method has been verified in several European coastal areas and laboratory-cultured algae species (Röttgers et al., 2013). Although the general applicability and stability of this method are constrained by the limited applicability of empirical relationship at 715 nm using PSICAMs, it remains effective as a reference with which the exponential method can be compared. The exponential method is based on the Boss method developed for the Dead Sea, which is characterized by high salinity and high temperature. Sokoletsky and Shen (2014) suggested that different scattering corrections for AC9 absorption measurements can result in up to a 30% difference among the remote sensing reflectance models using radiative transfer. Comparison of the exponential, flat, Zaneveld, Röttgers, and Boss methods is required to assess the correction effects of the exponential method. Furthermore, the deviations between the methods obtained from such comparisons could provide scientific references that would enable accurate analysis of the inverse algorithms for IOPs.
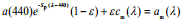
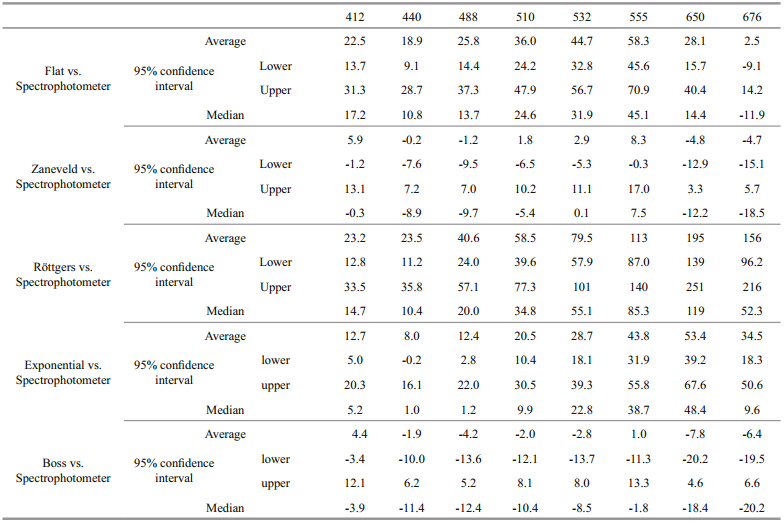
Because the flat and Zaneveld methods assume that the absorption coefficient is zero in the 715 nm band and the Boss method treats negative values as zeros, only the first eight visible bands of the nine bands measured by AC9s (the same bands that are measured by ACS meters) are discussed here. The results indicate that the corrected values from the exponential method are close to those from the flat. (average < 20%) and Zaneveld (average > 30%) methods in the bluegreen bands (≤600 nm), as shown in Fig. 5 and Table 2, with the values lying in between those of the flat and Zaneveld methods. However, the corrected values are generally higher than those of the flat and Zaneveld methods in the red and NIR bands (> 600 nm). The corrected values obtained using the Röttgers method are close to those derived using the exponential method below the 510 nm band (median < 18%; average < 32%), but the average in each band is generally higher than that from the exponential method. The Zaneveld method yields the secondlowest corrected values among all methods. The Zaneveld method has been previously reported to produce underestimates in the red and NIR regions (Doxaran et al., 2007; McKee et al., 2013; Röttgers et al., 2013; Sokoletsky and Shen, 2014). The Boss method yields the lowest corrected values among all methods. Compared with the results of the Zaneveld method, those of the Boss method are obviously overcorrected due to the influence of the absorption peak of phytoplankton and are close to the values in turbid water (Figs. 2a, c, 3a). The corrected values from the Röttgers method are the highest in most of the green, red, and NIR bands. The corrected values obtained using the flat method are approximately equal to (or slightly higher than) those of the Röttgers method in the short band (412 nm) but are evidently lower than those from the exponential method in the long-wavelength and red-NIR regions (> 600 nm). The corrected values derived from the Zaneveld and Boss methods are always lower than those from the exponential method.

|
| Figure 5 Comparison of the results of the exponential, flat, Zaneveld, Röttgers, and Boss methods The black lines represent 1:1 lines, whereas the parallel brown dashed lines represent +/-30% deviations. |
|
The corrected values from each method are generally close to one another in the short band (e.g., the corrected values from all methods are concentrated within ±10% of the average or median values in the 412 nm band). However, as the wavelength increases, the corrected values obtained using the different methods begin to show discrepancies. The corrected values from the flat method are slightly higher than those from the exponential method in the short-band region. The corrected values from the Zaneveld method are always slightly lower than those from the exponential method. The corrected values from both the flat and Zaneveld methods are evidently lower than those from the exponential method in the bands longer than 600 nm. The absorption coefficients corrected using the Röttgers method are generally higher than those corrected using the exponential method with small differences in the short-band regions but more notable differences in the long-band regions.
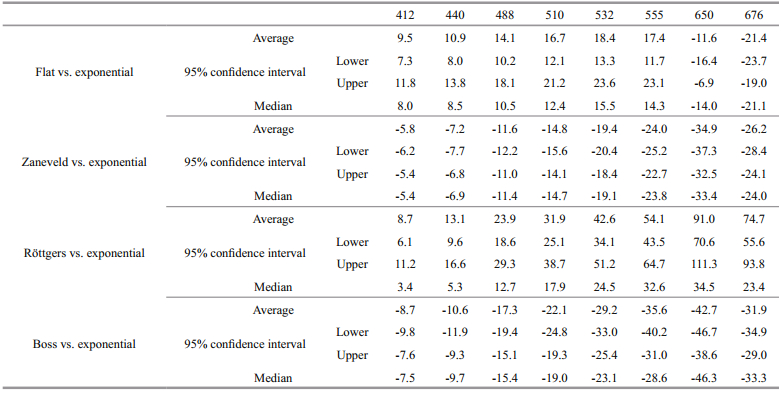
3.4 Comparison of the corrected absorption coefficients obtained from the exponential method with using the laboratory spectrophotometerAC measurement results are commonly applied in the development of semi-analytical algorithms and optical closure studies (Sokoletsky and Shen, 2014; Lefering et al., 2016). The measured values obtained via different methods/devices are comparable, just as measurement closure mentioned by Mobley (1994). apg, which is determined from AC9/ACS measurements, is equivalent to the summation of ag and ap. Figure 6a shows that the results from the exponential method and the spectrophotometer are mostly concentrated near the 1:1 line [except for the values corresponding to 715 nm, which are relatively dispersed (Fig. 6b)]. The values obtained using the exponential method are generally slightly higher than those measured by the spectrophotometer in the blue– green bands (< 532 nm) and 676 nm (Table 3) (variance in median value < 10%), indicating that the results of the exponential method are comparable with the spectrophotometer measurements and thus can be applied in optical closure studies. Multiple potential causes of the discrepancies between the values obtained using the two methods are present, such as the differences between the spectrophotometer and field measurement techniques. Absorption measurements using a spectrophotometer are affected by the path-length amplification effect ("β effect") and null correction. In this study, the null correction for yellow-substance absorption value ag(λ) was selected as the mean value from 690 to 700 nm (Zhu, 2003). The mean optical density of 11-nm, selected from 790 to 800 nm, was set as zero for the null correction of particle-absorption values ap(λ) in the transmittance (T) method to minimize the scattering error. However, the important uncertainties associated with the quantitative filter technique to determine the particulate absorption coefficient remain (Roesler, 1998). Moreover, some researchers found that the transmittance-reflectance method could improve the absorption coefficient measurement of the suspended particulate matter precision in highly turbid water (Tassan and Ferrari, 2002; Zhu et al., 2010; Shi et al., 2015). The difference between the depths where the water samples are acquired in the two methods is another important cause. The surface water samples used by the spectrophotometers are taken from 0 m or close to the 0 m surface, whereas in the field measurements, they are taken from depths of 0.5 or 1 m (sometimes, even 2.5 m) and are approximately treated as surface water samples.

|
| Figure 6 Comparison of the absorption results obtained using the laboratory spectrophotometer and the AC9/ACS with different scattering methods The black diagonal line represents the 1:1 line. |
|
The depth of the in-situ method is increased due to the structure of the instrument at the water inlet, which must be immersed beneath the water surface by approximately 0.5 m. In certain inland water types with significant layering distinctions, the difference between the water sample depths could cause the results of the two methods to be inconsistent. Therefore, we need to select water samples from the same layer in the water closure analysis and perform future algorithm development to reduce errors and improve the accuracy of error analysis.
4 DISCUSSION 4.1 Analysis of the influence of the fitting bandsThe exponential method is a modified form of Zaneveld's proportional method (Zaneveld et al., 1994), which involves removing a constant proportion of the scattering from the absorption. The scattering contribution is obtained by generating a power law fit using nonlinear least squares minimization in the seven AC9 wavelengths among the types of water with different dominant materials. It avoids assuming zero absorption in the NIR reference band. The scattering coefficient represents the difference between the measured attenuation and corrected absorption coefficients and approaches the true scattering value.
Boss et al. (2013) chose the seven shortest AC9 wavelengths to avoid the temperature- and salinitysensitive bands (676 and 715 nm) and assumed that NAPs, whose spectra almost exponentially decrease, dominated the water. The method met the absorption correction requirements of the Dead Sea, where the CTD measurements go out of range and cannot provide usable data. It may cause potential errors in ordinary Case 2 water, which has significant phytoplankton pigment absorption, e.g., Chl b has an absorption peak near 650 nm. In this study, we improved the fitting algorithm using measurements in seven AC9 wavelengths (412, 440, 488, 510, 532, 555, and 715 nm) to avoid the influence of the phytoplankton absorption peaks at 650 and 676 nm while also obtaining CTD measurements for temperature and salinity corrections in the red and NIR bands. The particulate absorption coefficient and its constituent contributions could be separated into algal absorption aph(λ) and NAP absorption ad(λ), expressed as ap(λ)=aph(λ)+ad(λ). The algal absorption coefficient is featured in spectra that are not exponentially decreasing. However, the concomitant NAP ad(λ) and yellow matter ag(λ) always exist in Case 2 water. They could be expressed by decreasing exponential function 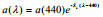
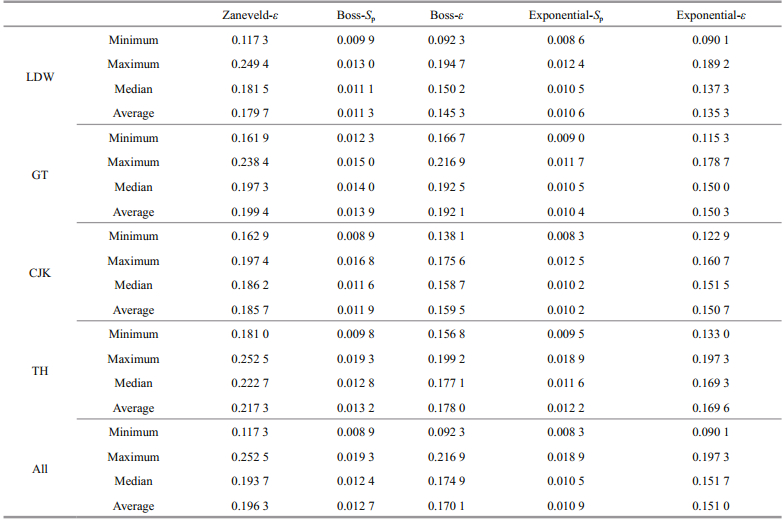
As previously mentioned, ε is a wavelengthindependent quantity and is a measure of the contribution of the scattering to apg(λ). In the Zaneveld method, ε∈[0.117, 0.252]. In the comparison, the values of ε obtained using the exponential and Boss methods are smaller, as shown in Fig. 7. In the exponential method, ε∈[0.090, 0.197], and in the Boss method, ε∈[0.092, 0.217]. The ε values obtained using both these methods are within the scatteringcorrected range of the AC instrument protocol, i.e., ε∈[0.07, 0.35], and are consistent with the previous estimates (Zaneveld et al., 1994; Boss et al., 2013).

|
| Figure 7 Comparison of the ɛ values from the exponential, Zaneveld, and Boss methods The black diagonal line represents the 1:1 line. |
The scattering multiplied by ε in the Zaneveld method is related to uncorrected absorption am(λ), whereas the scattering multiplied by ε in the Boss and exponential methods is directly related to corrected absorption a(λ). The ε values of the exponential methods are relatively larger and are close to the true scattering error. Hence, the same scattering correction quantity corresponds to a smaller ε value. Because of the choice of the fitting band in the exponential method, which is not the same as that in the Boss method, the ε values are significantly different. In particular, in the Guanting Reservoir water, which has a relatively higher concentration of phytoplankton and pigment absorption at 650 nm, ε from the Boss method is obviously higher than that in the other cruises with inorganic-dominated water, leading to absorption coefficient overcorrection, which is significantly lower than that from the Zaneveld method, as shown in Fig. 3c. The exponential method is also evidently stable and robust in most of natural water types, unlike the Boss method, which fails to produce accurate results in eutrophic water where the absorption spectra show pigment absorption characteristics. The ε values from the Boss method are generally higher than those from the exponential method, which cause the values in the corrected band to be significantly lower. Compared with the other two scattering correction methods, ε from the Boss method shows discrepancies and unstable behavior.
The exponential method particulate and CDOM absorption spectral slopes were found to be Sp~0.008 3–0.018 9/nm (median value:Sp=0.010 463/nm) and were observed to increase with increasing turbidity (Table 4). The Sp values from the exponential method are lower than those from the Boss method in all cruises. All results exhibit a typical Chl a absorption peak at 676 nm and a weak shoulder near 488 nm, such as the spectra in the Guanting Reservoir shown in Fig. 3d, which suggest that the photosynthetic organisms in the water column and phytoplankton dominated the water.
|
cm(λ) in the exponential method was left uncorrected due to the lack of an appropriate standard scattering correction, although this error source has long been understood (Pegau et al., 2003), and attempts to solve it have recently been presented by Boss et al. (2009) using LISST and by McKee et al. (2013) using Bb9. The exponential method has been tested and analyzed in situ in several water types, excluding open ocean stations, clear inland water, and other extreme water types, which may significantly affect the choice of fitting bands in the exponential method. Thus, this method should be validated using samples of more water types that occur in natural complex coastal or inland water to enable further modification of the fitting algorithm and improvement in the scattering correction accuracy.
Sullivan et al. (2016) mentioned that approximately five to six commonly used correction methods had no community consensus, and their team remains committed to quantifying and improving the uncertainties (scattering error) in absorption measurements using AC devices in the NASA Plankton, Aerosol, Cloud, ocean Ecosystem (PACE) mission. Therefore, no correction method is available that is applicable to all types of waters with good accuracy across the spectrum. The exponential fitting method, developed as a new alternative correction method to Case 2 water, is suitable for the original spectra that are nearly linear or exponentially decreasing in the data, excluding one or two algal peak bands of AC9 (such as 650 and 676 nm). It is suitable for correction of data from most ordinary coastal and inland water, which is dominated by algal and mineral sediment water, yellow substances, or combination of the two. The flat method is always used for single-absorption-tube measured water, and the longer the reference band is, the more accurate is the scattering scattering-correction result. The Zaneveld method, which is regarded as the standard scattering correction method, can be suitable for most water types with near-zero absorption in the nearinfrared region, such as in Case 1 or clear water. However, because of the non-zero absorption at 715 nm, apg at longer wavelengths is strongly underestimated by the two regular correction methods (flat and Zaneveld) in Case 2 water, and shorter wavelengths yield reasonably good results in coastal waters (Röttgers et al., 2013). The Rӧttgers method, as a new method that develops an empirical relationship using PSICAM data that has no scattering error, evaluates the absorption in coastal waters using AC9 meters by applying scattering corrections to the flat and Zaneveld methods. It could improve the quality of AC9 absorption at longer wavelengths (Röttgers et al., 2013) and be close to the values corrected by other methods in this study at shorter wavelengths, instead of the overestimation at shorter wavelengths in Röttgers' study (Röttgers et al., 2013). The Boss method is applicable to water with temperature or salinity that is outside the normal range and water with little or no algal content, such as the Dead Sea.
5 CONCLUSIONThe exponential method in which the scattering contribution is obtained from a power-law fit generated using nonlinear least squares minimization at seven wavelengths (412, 440, 488, 510, 532, 555, and 715 nm) was found to yield reasonable results for data sets recently collected using different AC9/ACS instruments and including data from an estuary and its adjacent coastal area, an open gulf, an inland lake, and a reservoir. This correction method proved suitable and robust for different types of turbid waters in coastal and eutrophic waters. In inland waters, it did not require the zero-NIR-absorption assumption or that the raw absorption spectra should be exponentially decreasing. The corrected spectra were shifted upwards in the red and NIR regions.
The corrected results obtained using the exponential method were compared with those of the flat, Zaneveld, Röttgers, and Boss methods. The corrected values generated by the exponential method were found to be very close to those of the flat method (variance of average value < 20%) and the Zaneveld method (variance of average value > -30%) in the blue-green bands (≤600 nm) and smaller than those in the Röttgers method (variance of median value < 35%). They are comparable with the results of the spectrophotometer measurements conducted in the laboratory.
The exponential-function assumption improved the AC9 data quality at longer wavelengths and yielded stable results at shorter wavelengths in the coastal and inland waters. However, problems arise that remain to be addressed, which will be the subjects of a further study. For instance, cm(λ) is left uncorrected in the exponential method due to the lack of an appropriate standard scattering correction. In addition, this method should be validated using samples from more water types. The algorithm also requires modification to improve the scattering correction accuracy.
6 DATA AVAILABILITY STATEMENTThe data that support the findings of this study are available from National Ocean Technology Center and Institute of Remote Sensing and Digital Earth but restrictions apply to the availability of these data, which were used under license for the current study, and thus, are not publicly available. The data are however available from the authors upon reasonable request and with permission from the National Ocean Technology Center and Institute of Remote Sensing and Digital Earth.
7 ACKNOWLEDGEMENTThe authors are appreciative to the members of the field sample experiment for their hard work during the four cruises over the gulf of Liaodongwang (2011), the estuary of Changjiang (Yangtze) River (2012), the lake of Taihu (2013), the reservoir of Guanting (2015). We greatly appreciate the two anonymous reviewers who provided detailed comments to improve the manuscript.
Babin M, Stramski D, Ferrari G M, Claustre H, Bricaud A, Obolensky G, Hoepffner N. 2003. Variations in the light absorption coefficients of phytoplankton, nonalgal particles, and dissolved organic matter in coastal waters around Europe. Journal of Geophysical Research, 108(C7): 3211.
DOI:10.1029/2001JC000882 |
Bidigare R R, Ondrusek M E, Morrow J H, Kiefer D A. 1990. In-vivo absorption properties of algal pigments. In: Proceedings of SPIE 1302, Ocean Optics X. SPIE, Orlando, FL, United States. p. 290-302.
|
Boss E, Gildor H, Slade W, Sokoletsky L, Oren A, Loftin J. 2013. Optical properties of the Dead Sea. Journal of Geophysical Research, 118(4): 1821-1829.
|
Boss E, Slade W H, Behrenfeld M, Dall'Olmo G. 2009. Acceptance angle effects on the beam attenuation in the ocean. Optics Express, 17(3): 1535-1550.
DOI:10.1364/OE.17.001535 |
Bricaud A, Claustre H, Ras J, Oubelkheir K. 2004. Natural variability of phytoplanktonic absorption in oceanic waters:influence of the size structure of algal populations. Journal of Geophysical Research, 109(C11): C11010.
DOI:10.1029/2004JC002419 |
Doxaran D, Babin M, Leymarie E. 2007. Near-infrared light scattering by particles in coastal waters. Optics Express, 15(20): 12834-12849.
DOI:10.1364/OE.15.012834 |
Hoepffner N, Sathyendranath S. 1991. Effect of pigment composition on absorption properties of phytoplankton. Marine Ecology Progress Series, 73: 11-23.
DOI:10.3354/meps073011 |
Kirk J T O. 1992. Monte Carlo modeling of the performance of a reflective tube absorption meter. Applied Optics, 31(30): 6463-6468.
DOI:10.1364/AO.31.006463 |
Kirk J T O. 2010. Light and Photosynthesis in Aquatic Ecosystems. 3rd edn. Cambridge University Press, Cambridge. p.49-95.
|
Lefering I, Bengil F, Trees C, Röttgers R, Bowers D, NimmoSmith A, Schwarz J, McKee D. 2016. Optical closure in marine waters from in situ inherent optical property measurements. Optics Express, 24(13): 14036-14052.
DOI:10.1364/OE.24.014036 |
Leymarie E, Doxaran D, Babin M. 2010. Uncertainties associated to measurements of inherent optical properties in natural waters. Applied Optics, 49(28): 5415-5436.
DOI:10.1364/AO.49.005415 |
McKee D, Piskozub J, Brown I. 2008. Scattering error corrections for in situ absorption and attenuation measurements. Optics Express, 16(24): 19480-19492.
DOI:10.1364/OE.16.019480 |
McKee D, Piskozub J, Röttgers R, Reynolds R A. 2013. Evaluation and improvement of an iterative scattering correction scheme for in situ absorption and attenuation measurements. Journal of Atmospheric and Oceanic Technology, 30(7): 1527-1541.
DOI:10.1175/JTECH-D-12-00150.1 |
Mobley C D. 1994. Light and Water:Radiative Transfer in Natural Waters. Academic Press, San Diego, USA.: p.86-100.
|
Moore C C, Zaneveld J R V, Kitchen J C. 1992. Preliminary results from an in-situ spectral absorption meter. In: Proceedings of SPIE 1750, Ocean Optics XI. SPIE, San Diego, CA, United States. p. 330-337.
|
Morel A. 2009. Are the empirical relationships describing the bio-optical properties of case 1 waters consistent and internally compatible?. Journal of Geophysical Research, 114(C1): C01016.
|
Mueller J L, Morel A, Frouin R, Davis C, Arnone R, Carder K, Lee Z P, Steward R G, Hooker S, Mobley C D, McLean S, Holben B, Miller M, Pietras C, Knobelspiesse K D, Fargion G S, Porter J, Voss K. 2003. Ocean Optics Protocols for Satellite Ocean Color Sensor Validation, Revison 4, Volume Ⅲ: Radiometric Measurements and Data Analysis Protocols. National Aeronautics and Space Administration, Washington DC, USA. p. 1-31.
|
Pegau S, Zanefeld J R V, Mitchell B G, Mueller J L, Kahru M, Wieland J, Stramska M. 2003. Inherent optical properties: instruments, characterizations, field measurements and data analysis protocols. In: Mueller J L, Fargion G S, McClain C R eds. Ocean Optics Protocols for Satellite Ocean Color Sensor Validation, Volume IV. National Aeronautics and Space Administration, Washington, DC, USA. p. 1-64.
|
Pegau W S, Gray D, Zaneveld J R V. 1997. Absorption and attenuation of visible and near-infrared light in water:dependence on temperature and salinity. Applied Optics, 36(24): 6035-6046.
DOI:10.1364/AO.36.006035 |
Roesler C S. 1998. Theoretical and experimental approaches to improve the accuracy of particulate absorption coefficients derived from the quantitative filter technique. Limnology and Oceanography, 43(7): 1649-1660.
DOI:10.4319/lo.1998.43.7.1649 |
Röttgers R, Dupouy C, Taylor B B, Bracher A, Woźniak S B. 2014. Mass-specific light absorption coefficients of natural aquatic particles in the near-infrared spectral region. Limnology and Oceanography, 59(5): 1449-1460.
DOI:10.4319/lo.2014.59.5.1449 |
Röttgers R, McKee D, Woźniak S B. 2013. Evaluation of scatter corrections for ac-9 absorption measurements in coastal waters. Methods Oceanography, 7: 21-39.
DOI:10.1016/j.mio.2013.11.001 |
Shen Q, Li J S, Zhang F F, Sun X, Li J, Li W, Zhang B. 2015. Classification of several optically complex waters in China using in situ remote sensing reflectance. Remote Sensing, 7(11): 14731-14756.
DOI:10.3390/rs71114731 |
Shi Z Q, Zhang Y L, Cai T F. 2015. Determination of the spectral absorption coefficients of suspended particulate matters in the shallow lakes in the middle and lower reaches of Yangtze river. Journal of Lake Sciences, 27(3): 519-526.
(in Chinese with English abstract) DOI:10.18307/2015.0320 |
Sokoletsky L G, Shen F. 2014. Optical closure for remotesensing reflectance based on accurate radiative transfer approximations:the case of the Changjiang (Yangtze)river Estuary and its adjacent coastal area, China. International Journal of Remote Sensing, 35(11-12): 4193-4224.
DOI:10.1080/01431161.2014.916048 |
Sosik H M, Mitchell B G. 1995. Light absorption by phytoplankton, photosynthetic pigments and detritus in the California Current system. Deep Sea Research Part I:Oceanographic Research Papers, 42(10): 1717-1748.
DOI:10.1016/0967-0637(95)00081-G |
Sullivan J M, Twardowski M S, Zaneveld J R V, Moore C M, Barnard A H, Donaghay P L, Rhoades B. 2006. Hyperspectral temperature and salt dependencies of absorption by water and heavy water in the 400-750 nm spectral range. Applied Optics, 45(21): 5294-5309.
DOI:10.1364/AO.45.005294 |
Sullivan J, Twardowski M, Moore T, McKee D, Röttgers R, Stockley N. 2016. Improving IOP measurement uncertainties for PACE ocean color remote sensing applications. Florida Atlantic University Harbor Branch, USA.
|
Tassan S, Ferrari G M. 2002. A sensitivity analysis of the 'transmittance-reflectance' method for measuring light absorption by aquatic particles. Journal of Plankton Research, 24(8): 757-774.
DOI:10.1093/plankt/24.8.757 |
Tassan S, Ferrari G M. 2003. Variability of light absorption by aquatic particles in the near-infrared spectral region. Applied Optics, 42(24): 44808-4810.
|
Twardowski M S, Sullivan J M, Donaghay P L, Zaneveld J R V. 1999. Microscale quantification of the absorption by dissolved and particulate material in coastal waters with an ac-9. Journal of Atmospheric and Oceanic Technology, 16(6): 691-707.
DOI:10.1175/1520-0426(1999)016<0691:MQOTAB>2.0.CO;2 |
WET Labs Inc. AC Meter Protocol Document (Revision Q). http: //www. seabird. com/sites/default/files/documents/manual-acprotq. pdf&nid=2320. http://www.seabird.com/sites/default/files/documents/manual-acprotq.pdf&nid=2320. Accessed on 2017-02-01.
|
Ye H P, Li J S, Li T J, Shen Q, Zhu J H, Wang X Y, Zhang F F, Zhang J, Zhang B. 2016. Spectral classification of the Yellow Sea and implications for coastal ocean color remote sensing. Remote Sensing, 8(4): 321.
DOI:10.3390/rs8040321 |
Zaneveld J R V, Kitchen J C, Moore C C. 1994. Scattering error correction of reflecting-tube absorption meters. In: Proceedings of SPIE 2258, Ocean Optics XⅡ. SPIE, Bergen, Norway. p. 44-55.
|
Zhang Y L, Gao G, Shi K, Niu C, Zhou Y Q, Qin B Q, Liu X H. 2014. Absorption and fluorescence characteristics of rainwater CDOM and contribution to Lake Taihu, China. Atmospheric Environment, 98: 483-491.
DOI:10.1016/j.atmosenv.2014.09.038 |
Zhu J H, Han B, Ye H P, Yang A A. 2014. Preliminary study on the seawater scattering properties in the outside estuary of the Yangtze River. Acta Optica Sinica, 34(S1): s101001.
(in Chinese with English abstract) |
Zhu J H, Zhou H L, Li T J, Han B. 2010. Study on applicability of pathlength amplification correction factor with T-R method based on chlorella vulgaris. Ocean Technology, 29(1): 40-45.
(in Chinese with English abstract) |
Zhu J H. 2003. The key technique for measuring spectral absorption coefficient of case Ⅱ water with spectrophotometer. Ocean Technology, 22(1): 34-39.
(in Chinese with English abstract) |