 2018, Vol. 36
Institute of Oceanology, Chinese Academy of Sciences
Article Information
- TENG Wen(腾文), CONG Rihao(丛日浩), QUE Huayong(阙华勇), ZHANG Guofan(张国范)
- De novo transcriptome sequencing reveals candidate genes involved in orange shell coloration of bay scallop Argopecten irradians
- Chinese Journal of Oceanology and Limnology, 36(4): 1408-1416
- http://dx.doi.org/10.1007/s00343-018-7063-3
Article History
- Received Mar. 3, 2017
- accepted in principle Apr. 20, 2017
- accepted for publication Jun. 8, 2017


2 University of Chinese Academy of Sciences, Beijing 100049, China;
3 Laboratory for Marine Biology and Biotechnology, Qingdao National Laboratory for Marine Science and Technology, Qingdao 266071, China;
4 National & Local Joint Engineering Laboratory of Ecological Mariculture, Qingdao 266000, China
The magnificent color of molluscan shells has attracted the interest of collectors and scientists for centuries (Comfort, 1951) and has served as an important phenotypic marker in shellfish breeding because of its high heritability (Ino, 1949; Leighton, 1961; Cole, 1975; Creese and Underwood, 1976; Newkirk, 1980; Palmer, 1985; Adamkewicz and Castagna, 1988; Winkler et al., 2001; Zheng et al., 2013). With the aid of the recently developed nextgeneration sequencing technology, various genes were revealed to be involved in shell coloration of molluscs. For instance, 358 differentially expressed genes are related to color differences in the pearl mussel Hyriopsis cumingii (Bai et al., 2013); the notch signaling pathway and calcium signaling process may equally affect shell coloration in the clam Meretrix meretrix (Yue et al., 2015); a large number of candidate genes in the Japanese scallop Patinopecten yessoensis that are associated with shell biomineralization and metal transcription may be involved in shell coloring (Ding et al., 2015); and in the pearl oyster Pinctada fucata, 10 sequences of 343 randomly selected clones from cDNA subtractive libraries are differentially expressed in white-shelled and red-shelled individuals (Guan et al., 2011).
The bay scallop Argopecten irradians (Lamarck 1819) has historically occurred on the coast of the Eastern United States and the Gulf of Mexico. It was introduced to China several times in the 1980s and 1990s (Zhang et al., 1986; Blake et al., 1997; Li et al., 2014) and has been a major cultivated molluscan species for over 20 years. The background color of A. irradians covers the whole shell and never changes throughout its lifetime. It is not only inheritable, but also attributed to a single locus (Adamkewicz and Castagna, 1988; Elek and Adamkewicz, 1990). The orange shell color is one the background colors and has been used as a phenotypic marker in the "zhongkehong" variety (accession number: GS01- 004-2006, National Certification Committee for Aquatic Varieties of China) genetically improved for growth and survivorship. Although two amplified fragment length polymorphisms (AFLPs) were identified to be linked to orange shell color in A. irradians (Qin et al., 2007), little is known about the genetic mechanism underlying the orange coloration. In the present research, high-throughput RNA sequencing and digital gene expression (DGE) analysis were used to identify differentially expressed genes associated with the shell pigmentation of a selfbred "zhongkehong" family, aiming to reveal candidate genes involved in orange shell coloration of the bay scallop.
2 MATERIAL AND METHOD 2.1 Sample collection and mRNA extractionIn this study, a self-fertilizing family was established from a parent from the "zhongkehong" variety. Thirtyday-old individuals with transparent shell color and 50-day-old individuals with orange shell color were stored in RNAstore Reagent (Qiagen, Valencia, CA, USA) (Fig. 1). Six samples (2 developmental stages × 3 replicates) were pooled in equal weight and macerated in the presence of liquid nitrogen. Given the tiny juveniles of A. irradians, multiple individuals (more than 100) were pooled to generate RNA for each sample. The RNA was isolated from each sample using an RNAprep pure Tissue Kit (Tiangen, Beijing, China) following the manufacturer's protocol. RNasefree DNase Ⅰ (Qiagen, USA) was used to remove the residual DNA. An Agilent 2100 Bioanalyzer (Agilent Technologies, Santa Clara, CA, USA) and NanoDrop Spectrophotometer (Thermo Scientific, Wilmington, DE, USA) were employed to confirm the RNA integrity.

|
| Figure 1 Major transitions during the shell development of A. irradians a. thirty-day-old individuals with transparent shell color; b. 50-day-old individuals with orange shell color. |
A paired-end cDNA library was prepared using an mRNA-seq sample preparation kit (TruSeq RNA Sample Preparation Kit; Illumina Inc., San Diego, CA, USA). First, mRNA was purified using oligo-dT magnetic beads and fragmented by incubation in a fragmentation reagent. Second, random hexamer primers and reverse transcriptase (Invitrogen, Carlsbad, CA, USA) were utilized to synthesize first strand cDNA based on the fragmented mRNA. Then the second strand cDNA was primed mainly using DNA polymerase Ⅰ (New England BioLabs, Ipswich, MA, USA) and RNase H (Invitrogen, USA). Endrepairing of the double-stranded cDNA was fulfilled using T4 DNA polymerase, and the Klenow fragment was added to the 3ʹ end of the blunt fragment immediately before the index adapter was ligated. Finally, the DNA fragment was enriched by PCR amplification and quantified in an Aglient 2100 Bioanalyzer before sequencing. The sequencing of the library was performed by Oebiotech (Shanghai, China) on an Illumina HiSeq 2500 platform to obtain paired-end reads at 125 nt.
2.3 De novo transcriptome analysisBefore transcriptome assembly, quality checking of the raw data was performed using FASTQC (http://www.bioinformatics.babraham.ac.uk/projects/fastqc/). The per base sequence quality plots and the per base sequence content for the paired-end reads from each library indicated good quality of the raw data. To eliminate the error and bias in sequencing data, NGS QC TOOLKIT v2.3.3 (Patel and Jain, 2012) was used for preprocessing, which included removing low quality reads (PHRED score < 20), reads with low quality 3ʹ terminal bases (PHRED score < 20), and those with repeated unknown bases (>35). In addition, read contamination was determined for each sample by comparing 500 000 randomly selected reads with the NCBI database (ftp://ftp.ncbi.nih.gov/blast/db); ten reads with the highest score belonged to A. irradians and related species, confirming no contamination. Transcripts of these high quality clean data were obtained using Trinity (Grabherr et al., 2011; Haas et al., 2013). The TIGR Gene Indices clustering tool (TGICL) (Pertea et al., 2003) was used to assemble unigene sequences.
2.4 Annotation of unigene sequencesUsing the BLASTx algorithm (Altschul et al., 1990), the assembled contigs were aligned against the GenBank non-redundant (NR) protein database. Furthermore, functional annotation was performed by BLAST comparison against SWISS-PROT (Boutet et al., 2016) and the EuKaryotic Orthologous Groups of proteins (KOG) (Tatusov et al., 2003). The best aligned results were used to infer the sequence direction of unigenes. According to the protein annotation of NR, gene ontology (GO) annotation was performed using Blast2GO (Conesa et al., 2005) with E-value < 10-6. KEGG annotation was conducted by software KAAS and KEGG Automatic Annotation Server with E-value < 10-10(Moriya et al., 2007).
2.5 Gene expression quantification and differential expression analysisThe assembled de novo transcriptome was used as the reference database, and the reads were mapped to the reference transcriptome. This enables us to quantitate gene expression by counting reads per genes. Briefly, clean data of gene expression quantification were mapped back to the reference transcriptome using Bowtie v0.12.9 (Langmead and Salzberg, 2012) and eXpress (Roberts and Pachter, 2012).
Subsequently, each gene's FPKM (fragments per kilobase per million mapped reads) was calculated based on the length and read counts. The potential outliers were checked by principal component analysis (PCA) and plotting of the principal components. We performed pair-wise comparisons of the gene expression of the six transcriptomes using the DESeq R package (Anders and Huber, 2010), which employs the negative binomial distribution as the basis of the modeling of RNA-seq counts. Then, MA plots and heatmaps were drawn to assess the transcriptional pattern variations. During pathway and GO enrichment analysis, significantly enriched KEGG and GO terms were identified based on threshold of P < 0.05.
3 RESULT AND DISCUSSION 3.1 Paired-end sequencing and assemblyThe Illumina sequencing of the six cDNA libraries generated 289 839 646 paired-end reads. The per base sequence quality of the paired-end reads was good, and the base distribution examination indicated no sequence-specific bias. Subsequently, the original number of sequences was reduced to 280 148 360 (96.61%) clean reads after removal of reads with poor quality and unique identifiers. The clean sequences were assembled into 70 929 transcripts using Trinity software. The average length of final unigenes was 1 018.39 bp ranging from 301 bp to 11 727 bp and the N50 was 1 655 (Table 1).

|
Using an E-value cutoff at or below 10-5 for BLASTX and BLASTN, the assembled unigenes were annotated against SWISS-PROT, NR, and KOG databases: 23 598 (33.27%), 30 896 (43.56%), and 20 084 (28.32%) unigenes were annotated in SWISSPROT, NR, and KOG database, respectively. The best matched unigenes were selected (Table S1). The tophit species distribution of the unigenes against the NR database is shown in Fig. 2. Overall, 44.33% of the hits matched to Crassostrea gigas, whereas the other hits matched to many other species but each accounted for a very small proportion. Eukaryotic Orthologous Groups (KOG) analysis classified the 20 084 unigenes into 25 functional categories. The category 'general function prediction only' contained the largest proportion of unigenes (3 384; 16.85%), followed by the 'signal transduction mechanisms' cluster (2 811; 14.00%), and the 'post-translational modification, protein turnover, chaperones' cluster (2 640; 13.14%) (Fig. 3).

|
| Figure 2 Top-hit species distribution of A. irradians unigenes against GenBank non-redundant (NR) database |

|
| Figure 3 Eukaryotic Orthologous Groups (KOG) function classifications of A. irradians |
The GO analysis of 30 896 unigenes annotated in the NR database was conducted with Blast2GO. In total, 21 755 unigenes were assigned to three main GO categories with 12 924 functional terms and further subdivided into 64 subcategories (Fig. 4). Among these GO term assignments, 66.15% were from the biological processes category, 23.5% were from the molecular function category, and 10.35% were from the cellular component category. Twelve annotated unigenes were involved in biomineralization and 52 annotated unigenes were involved in pigmentation (Table S2).

|
| Figure 4 Gene ontology annotation results of assembled unigenes |
In total, 11 347 unigenes were assigned to 350 KEGG pathways. Of these pathways, 25.14% were included in metabolism, and three major subgroups were involved in lipid metabolism, carbohydrate metabolism, and xenobiotics biodegradation and metabolism. Other pathways included organismal systems (21.71%), human diseases (20.86%), environmental information processing (10.00%), genetic information processing (6.29%), and cellular processes (6.00%).
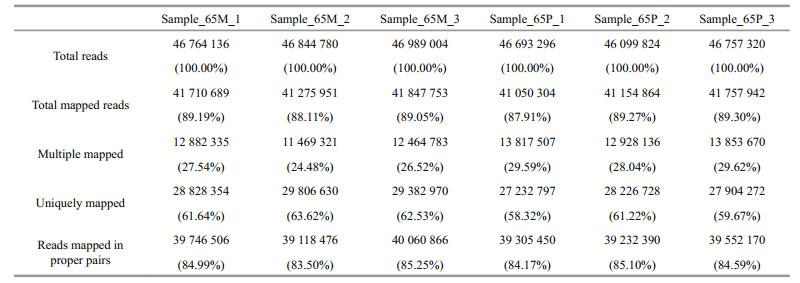
3.5 Gene expression quantification and comparative analysisAll the unigenes from the six transcriptome libraries were used as the reference transcriptome for reads mapping. The mapping rates exceeded 87% for total mapped, 58% for uniquely mapped, and 83% for reads mapped in proper pairs (Table 2).
Based on the FPKM (Mortazavi et al., 2008), the transcript abundance of the six libraries was calculated and a box-whisker plot was drawn (Fig. 5a). The PCA and sample-to-sample cluster analysis based on the expressive quantities of these genes (Fig. 5b) identified sample_65P_1 as an outlier. This may be due to sampling error (individuals collected in this sample were getting shell colored), and the outliers were removed from following analysis.

|
| Figure 5 Transcripts abundance and sample-to-sample analysis based on the expressive quantities of the genes a. box-whisker plot of six transcripts; b. sample-to-sample cluster analysis. Sample_65P_1, Sample_65P_2, and Sample_65P_3 correspond to prepigmentation, while Sample_65M-1, Sample_65M-2, and Sample_65M-3 correspond to post-pigmentation. |
Differential expression (DE) analysis was performed using the DESeq R package to screen for differentially expressed genes (DEGs) (P≤0.05). Consequently, 1 486 DEGs were identified, of which 748 were up-regulated and 738 were down-regulated (Table S3). The MA plot visually summarizes the obtained results (Fig. 6a). The global expression profiles of the DEG union in each DGE library were estimated by hierarchical clustering (Fig. 6b); the results showed that the global expression pattern of DEGs in the case group (post-pigmentation) was distinguishable from that in the control group (prepigmentation).

|
| Figure 6 Global expression profiles of differentially expressed genes (DEGs) a. MA plot based on the differentially expressed genes; b. hierarchical clustering of DEGs union among five digital gene expression (DGE) libraries. Sample_65P_1, Sample_65P_2, and Sample_65P_3 correspond to pre-pigmentation, while Sample_65M-1, Sample_65M-2, and Sample_65M-3 correspond to post-pigmentation. |
Using a reference gene database (30 896 annotated unigenes), 675 DEGs were successfully annotated and subjected to GO and KEGG pathway enrichment analysis to better delineate their function. In total, 453 DEGs were assigned to at least one GO term and 266 DEGs were annotated in the KEGG pathway database. Melanogenesis (ko04916, P < 0.05), phenylalanine tyrosine and tryptophan biosynthesis (ko00400, P < 0.01), tyrosine metabolism (ko00350, P < 0.01), iron ion transport (GO:0006826, P < 0.05), and porphyrin and chlorophyll metabolism (ko00860, P < 0.05) were significantly enriched in the upregulated genes.
Melanins are the group of black, brown, and reddish materials derived from tyrosine (Arnow, 1938). In vertebrates, the red and yellow color of hairs and feathers is largely due to pheomelanins (Zviak and Milléquant, 2005). The ink of coleoid cephalopods is blackened by melanin (Derby, 2014), and the pigment in the adductor muscle scar of the Pacific oyster is a melanin (Hao et al., 2015). In the present study, melanogenesis was highly enriched in the DEGs of the orange shell. Additionally, phenylalanine tyrosine and tryptophan biosynthesis and tyrosine metabolism were also recognized, all of which are highly involved in melanin metabolism in mammals (Sánchez-Ferrer et al., 1995). Furthermore, Tyrosinase-like protein 1 (TRP1) was significantly up-regulated in A. irradians, and the melanogenic function of TRP1 had been confirmed to be the oxidation of 5, 6-dihydroxyindole-2-carboxylic acid (DHICA) to a carboxylated indole-quinone at a downstream point in the melanin biosynthetic pathway (Kobayashi et al., 1994). Whether melanogenesis, phenylalanine tyrosine and tryptophan biosynthesis, tyrosine metabolism were involved in the shell coloration of A. irradians is an interesting question and further studies are required to provide evidence.
Porphyrins are natural and ubiquitous tetrapyrrole avian eggshell pigments. Uroporphyrin Ⅰ was found to be widely distributed in the shell of pteriomorph bivalves and other gastropod clades (Comfort, 1951; Creese & Underwood, 1976; Fox, 1976). These biological pigments were reported to be associated with red, brown or purple shell colouration (Comfort, 1949). In recent studies, the shell of Argopecten sp., one of the close relatives of A. irradians, was determined to contain small quantities of protoporphyrin using high-performance liquid chromatography (HPLC) (Verdes et al., 2015). Moreover, trace metals were reported to bind to porphyrins to form metalloporphyrin and metalloporphyrin, where different trace metals would result in differing coloration (Williams et al., 2016). It had been reported that trace metals, especially Fe2+ and Zn2+, and metal transcription are linked closely to shell coloring of P. yessoensis (Ding et al., 2015). In the present study, zinc ion binding (GO: 0008270), copper ion binding (GO: 0006825), and porphyrin and chlorophyll metabolism (ko00860) were also enriched in DEGs. This implicates that these trace metals and porphyrins were involved in the progress of A. irradians orange shell pigmentation; further study is required.
4 CONCLUSIONThe de novo transcriptome of A. irradians from two developmental stages, pre-pigmentation and post-pigmentation, was determined using the Illumina platform. A total of 70 929 unigenes were obtained and 30 896 unigenes were successfully annotated, which provided more sequences and genetic information to A. irradians, for which there is no reference genome available. According to GO analysis and KEGG database annotation, various unigenes were involved in biomineralization and pigmentation. Functional analysis of DEGs suggested melanins, trace metal elements and porphyrins may be potentially involved in the shell coloration of the bay scallop A. irradians. To support these finding, qRT-PCR should be employed to test pigmentation related genes in a future study.
6 ACKNOWLEDGMENTThanks are due to Laizhou Shunchang Aquatic Products Co., Ltd. for assistance with the experiments and to Mr. DU Runshan and Mr. YANG Linying for sample collection. In addition, we are grateful to Dr. WANG Jinpeng and Dr. Song Kai for their suggestions on the data analysis.
5 DATA AVAILABILITY STATEMENTThe raw reads generated during the current study are available in the NCBI SRA database, the accession number is SRR5469239.
Adamkewicz L, Castagna M. 1988. Genetics of shell color and pattern in the bay scallop Argopecten irradians. J. Hered., 79(1): 14-17.
DOI:10.1093/oxfordjournals.jhered.a110436 |
Altschul S F, Gish W, Miller W, Myers E W, Lipman D J. 1990. Basic local alignment search tool. J. Mol. Biol., 215(3): 403-410.
DOI:10.1016/S0022-2836(05)80360-2 |
Anders S, Huber W. 2010. Differential expression analysis for sequence count data. Genome Biol., 11(10): R106.
DOI:10.1186/gb-2010-11-10-r106 |
Arnow L E. 1938. The acid-soluble pigment of red human hair. Biochem. J., 32(8): 1281-1284.
DOI:10.1042/bj0321281 |
Bai Z Y, Zheng H F, Lin J Y, Wang G L, Li J L. 2013. Comparative analysis of the transcriptome in tissues secreting purple and white nacre in the pearl mussel Hyriopsis cumingii. PLoS One, 8(1): e53617.
DOI:10.1371/journal.pone.0053617 |
Blake S G, Blake N J, Oesterling M J, Graves J E. 1997. Genetic divergence and loss of diversity in two cultured populations of the bay scallop, Argopecten irradians(Lamarck, 1819). J. Shellfish Res., 16: 55-58.
|
Boutet E, Lieberherr D, Tognolli M, Schneider M, Bansal P, Bridge A J, Poux S, Bougueleret L, Xenarios I. 2016. UniProtKB/Swiss-Prot, the manually annotated section of the UniProt KnowledgeBase: how to use the entry view. In: Edwards D ed. Plant Bioinformatics. Methods in Molecular Biology. Humana Press, New York, USA. p. 23-54.
|
Cole T J. 1975. Inheritance of juvenile shell colour of the oyster drill Urosalpinx cinerea. Nature, 257(5529): 794-795.
DOI:10.1038/257794a0 |
Comfort A. 1949. Acid-soluble pigments of shells. 1. The distribution of porphyrin fluorescence in molluscan shells. Biochem. J., 44(1): 111-117.
|
Comfort A. 1951. The pigmentation of molluscan shells. Biol.Rev., 26(3): 285-301.
|
Conesa A, Götz S, García-Gómez J M, Terol J, Talón M, Robles M. 2005. Blast2GO:a universal tool for annotation, visualization and analysis in functional genomics research. Bioinformatics, 21(18): 3674-367.
DOI:10.1093/bioinformatics/bti610 |
Creese R G, Underwood A J. 1976. Observations on the biology of the trochid gastropod Austrocochlea constricta(Lamarck) (Prosobranchia). Ⅰ. Factors affecting shellbanding pattern. J. Exp. Mar. Biol. Ecol., 23(3): 211-228.
DOI:10.1016/0022-0981(76)90021-6 |
Derby C D. 2014. Cephalopod ink:production, chemistry, functions and applications. Mar. Drugs, 12(5): 2700-2730.
DOI:10.3390/md12052700 |
Ding J, Zhao L, Chang Y Q, Zhao W M, Du Z L, Hao Z L. 2015. Transcriptome sequencing and characterization of Japanese scallop Patinopecten yessoensis from different shell color lines. PLoS One, 10(2): e0116406.
DOI:10.1371/journal.pone.0116406 |
Elek J A, Adamkewicz S L. 1990. Polymorphism for shell color in the Atlantic bay scallop Argopecten irradians irradians (Lamarck) (Mollusca:Bivalvia) on Martha's Vineyard Island. Am. Malacol. Bull., 7: 117-126.
|
Fox D L. 1976. Animal biochromes and structural colours: physical, chemical, distributional & physiological features of coloured bodies in the animal world. 2nd edn. University of California Press, California, USA.
|
Grabherr M G, Haas B J, Yassour M, Levin J Z, Thompson D A, Amit I, Adiconis X, Fan L, Raychowdhury R, Zeng Q D, Chen Z H, Mauceli E, Hacohen N, Gnirke A, Rhind N, di Palma F, Birren B W, Nusbaum C, Lindblad-Toh K, Friedman N, Regev A. 2011. Full-length transcriptome assembly from RNA-Seq data without a reference genome. Nat. Biotechnol., 29(7): 644-652.
DOI:10.1038/nbt.1883 |
Guan Y Y, Huang L M, He M X. 2011. Construction of cDNA subtractive library from pearl oyster (Pinctada fucata Gould) with red color shell by SSH. Chin. J. Oceanol.Limnol., 29(3): 616-622.
DOI:10.1007/s00343-011-0200-x |
Haas B J, Papanicolaou A, Yassour M, Grabherr M, Blood P D, Bowden J, Couger M B, Eccles D, Li B, Lieber M, MacManes M D, Ott M, Orvis J, Pochet N, Strozzi F, Weeks N, Westerman R, William T, Dewey C N, Henschel R, LeDuc R D, Friedman N, Regev A. 2013. De novo transcript sequence reconstruction from RNA-seq using the Trinity platform for reference generation and analysis. Nat. Protoc., 8(8): 1494-1512.
DOI:10.1038/nprot.2013.084 |
Hao S X, Hou X, Wei L, Li J, Li Z H, Wang X T. 2015. Extraction and identification of the pigment in the adductor muscle scar of Pacific oyster Crassostrea gigas. PLoS One, 10(11): e0142439.
DOI:10.1371/journal.pone.0142439 |
Ino T. 1949. The effect of food on growth and coloration of the topshell (Turbo cornutus Solander). J. Mar. Res., 8: 1-5.
|
Kobayashi T, Urabe K, Winder A, Jiménez-Cervantes C, Imokawa G, Brewington T, Solano F, García-Borrón J C, Hearing V J. 1994. Tyrosinase related protein 1 (TRP1)functions as a DHICA oxidase in melanin biosynthesis. EMBO J., 13(24): 5818-5825.
|
Langmead B, Salzberg S L. 2012. Fast gapped-read alignment with Bowtie 2. Nat. Methods, 9(4): 357-359.
DOI:10.1038/nmeth.1923 |
Leighton D L. 1961. Observations of the effect of diet on shell coloration in the red abalone, Haliotis rufescens Swainson. Veliger, 4: 29-32.
|
Moriya Y, Itoh M, Okuda S, Yoshizawa A, Kanehisa M. 2007. KAAS:an automatic genome annotation and pathway reconstruction server. Nucleic Acids Res., 35(S2): W182-W185.
|
Mortazavi A, Williams B A, McCue K, Schaeffer L, Wold B. 2008. Mapping and quantifying mammalian transcriptomes by RNA-Seq. Nat. Methods, 5(7): 621-628.
DOI:10.1038/nmeth.1226 |
Newkirk G F. 1980. Genetics of shell color in Mytilus edulis L.and the association of growth rate with shell color. J. Exp.Mar. Biol. Ecol., 47(1): 89-94.
|
Palmer A R. 1985. Genetic basis of shell variation in Thais emarginata (Prosobranchia, Muricacea). Ⅰ. Banding in populations from Vancouver Island. Biol. Bull., 169(3): 638-651.
DOI:10.2307/1541306 |
Patel R K, Jain M. 2012. NGS QC Toolkit:a toolkit for quality control of next generation sequencing data. PLoS One, 7(2): e30619.
DOI:10.1371/journal.pone.0030619 |
Pertea G, Huang X Q, Liang F, Antonescu V, Sultana R, Karamycheva S, Lee Y, White J, Cheung F, Parvizi B, Tsai J, Quackenbush J. 2003. TIGR Gene Indices clustering tools (TGICL):a software system for fast clustering of large EST datasets. Bioinformatics, 19(5): 651-652.
DOI:10.1093/bioinformatics/btg034 |
Qin Y J, Liu X, Zhang H B, Zhang G F, Guo X M. 2007. Identification and mapping of amplified fragment length polymorphism markers linked to shell color in bay scallop, Argopecten irradians irradians (Lamarck, 1819). Mar. Biotechnol., 9(1): 66-73.
DOI:10.1007/s10126-006-6076-7 |
Roberts A, Pachter L. 2012. Streaming fragment assignment for real-time analysis of sequencing experiments. Nat.Methods, 10(1): 71-73.
|
Sánchez-Ferrer A, Rodríguez-López J N, García-Cánovas F, García-Carmona F. 1995. Tyrosinase:a comprehensive review of its mechanism. Biochim. Biophys. Acta, 1247(1): 1-11.
DOI:10.1016/0167-4838(94)00204-T |
Tatusov R L, Fedorova N D, Jackson J D, Jacobs A R, Kiryutin B, Koonin E V, Krylov D M, Mazumder R, Mekhedov S L, Nikolskaya A N, Rao B S, Smirnov S, Sverdlov A V, Vasudevan S, Wolf Y I, Yin J J, Natale D A. 2003. The COG database:an updated version includes eukaryotes. BMC Bioinformatics, 4: 41.
DOI:10.1186/1471-2105-4-41 |
Verdes A, Cho W, Hossain M, Brennan P L R, Hanley D, Grim T, Hauber M E, Holford M. 2015. Nature's palette:characterization of shared pigments in colorful avian and mollusk shells. PLos One, 10(12): e0143545.
DOI:10.1371/journal.pone.0143545 |
Williams S T, Ito S, Wakamatsu K, Goral T, Edwards N P, Wogelius R A, Henkel T, de Oliveira L F, Maia L F, Strekopytov S. 2016. Identification of shell colour pigments in marine snails Clanculus pharaonius and C.margaritarius (Trochoidea; Gastropoda). PLos One, 11(7): e0156664.
DOI:10.1371/journal.pone.0156664 |
Winkler F M, Estévez B F, Jollán L B, Garrido J P. 2001. Inheritance of the general shell color in the scallop Argopecten purpuratus (Bivalvia:Pectinidae). J. Hered., 92(6): 521-525.
DOI:10.1093/jhered/92.6.521 |
Yue X, Nie Q, Xiao G Q, Liu B Z. 2015. Transcriptome analysis of shell color-related genes in the clam Meretrix meretrix. Mar. Biotechnol., 17(3): 364-374.
DOI:10.1007/s10126-015-9625-0 |
Zhang F S, He Y C, Liu X S, Ma J H, Li S Y, Qi L X. 1986. A report on the introduction, spat-rearing and experimental culture of bay scallop, Argopecten irradians Lamarck. Oceanologia et Limnologia Sinica, 17(5): 367-374.
(in Chinese with English abstract) |
Zheng H P, Zhang T, Sun Z W, Liu W H, Liu H L. 2013. Inheritance of shell colours in the noble scallop Chlamys nobilis (Bivalve:Pectinidae). Aquac. Res., 44(8): 1229-1235.
DOI:10.1111/are.2013.44.issue-8 |
Zviak C, Milléquant J. 2005. Oxidation coloring. In: Bouillon C, Wilkinson J eds. The Science of Hair Care. 2nd edn. CRC Press, Boca Raton, USA. p. 251-276.
|