 2018, Vol. 36
Institute of Oceanology, Chinese Academy of Sciences
Article Information
- CHEN Yizhong(陈义中), ZHU Jianrong(朱建荣)
- Observation and simulation of 2-methylisoborneol in the Qingcaosha Reservoir, Changjiang estuary
- Chinese Journal of Oceanology and Limnology, 36(5): 1586-1596
- http://dx.doi.org/10.1007/s00343-018-7124-7
Article History
- Received Apr. 19, 2017
- accepted in principle Jun. 13, 2017
- accepted for publication Aug. 30, 2017


2 Shanghai Academy of Environmental Sciences, Shanghai 200233, China
Human activities, such as agricultural non-point source pollution and industrial sewage discharge, accelerate the eutrophication process in natural waters. Aquatic eutrophication caused by phosphorus and nitrogen can lead to blooms of cyanobacteria that produce 2-methylisoborneol (2-MIB). In China, the occurrences of 2-MIB were frequently reported. According to the published data, the peak concentrations of 2-MIB in Chinese lakes and reservoirs were mostly hundreds of times higher than in rivers (Zhang et al., 2016). This chemical, degrades water quality, and is responsible for many taste and odor (T & O) complaints related to the aesthetics of drinking water, and has been shown to be recalcitrant during conventional water treatment (Codd, 2000; Parinet et al., 2010; Burgos et al., 2014). However, the high costs of 2-MIB treatment involving powdered activated charcoal or ozone make it impractical for most facilities to continuously treat their incoming raw water (Watson et al., 2007). Therefore, predictive tools are needed to analyze the occurrence potential of T & O events and to provide useful information for better management of drinking water resources. In previous studies, several empirical models were developed based on the strong correlation between key water quality variables (e.g., chlorophyll-a (Chla), chemical oxygen demand, dissolved oxygen (DO), and Secchi depth) and T & O compounds (Smith et al., 2002; Mau et al., 2004; Sugiura et al., 2004; Christensen et al., 2006). These models could predict T & O issues and are simpler and more cost-effective to implement. In freshwater resources where cyanobacterial blooms are common, empirical models of cyanobacterial biomass (Downing et al., 1999), cyanobacterial detection systems (Izydorczyk et al., 2005; Gregor et al., 2007), and water quality variables closely related to T & O compounds (Davies et al., 2004; Sugiura et al., 2004) could be used to predict the likelihood of unacceptable T & O events (Dzialowski et al., 2009). However, few numerical models have been developed to directly simulate the generation and release of T & O compounds, including 2-MIB, according to their generation mechanisms.
The purpose of this research was to develop a numerical model for simulating the generation of 2-MIB in a shallow freshwater resource, the Qingcaosha Reservoir. In particular, we sought to validate the reliability of the simulated ecological process in the model and to analyze the relationship between the variation in 2-MIB and the changes in reservoir operations.
2 MATERIAL AND METHOD 2.1 Study area and reservoir informationThe Qingcaosha Reservoir is located in the Changjiang estuary (Fig. 1), which receives a markedly higher nutrient flow than other estuaries in China (Gao and Song, 2005). This reservoir was designed to supply more than 50% of the total freshwater used in Shanghai and to serve more than 13 million people. Construction of the reservoir was finished in 2010, and normal operation began in 2011. The reservoir was built along the northern coast of Changxing Island. Freshwater and saltwater oscillate back and forth with the ebb and flood current in this area in the dry season (Wu et al., 2006; Qiu and Zhu, 2013; Chang et al., 2014). Utilizing the water level difference between the inside and outside of the reservoir, the northwest (upper reach) and southeast (lower reach) gates of the Qingcaosha Reservoir were designed to exchange freshwater and to prevent saltwater from entering the reservoir. The reservoir area is 66.15 km2, and the water depth varies from 2.7 m to 12.1 m, generally increasing from the northwest to the southeast. The reservoir was enclosed, and no water was exchanged with Changjiang estuary during the construction from April 2009 to September 2010. Construction of the reservoir was completed, and trial operation began in October 2010. The water supply of the reservoir was approximately 800 000 tons/day, and the gates were operated only once per day to draw in water from Changjiang estuary during the trial operation period from October 2010 to December 2010. After the trial operation period, the water supply was gradually increased to 2.5 million tons/day at the end of 2011 and to 4 million tons/day at the end of 2012. The gates were opened twice daily to take water into the reservoir during the high water levels of the semi-diurnal tides.

|
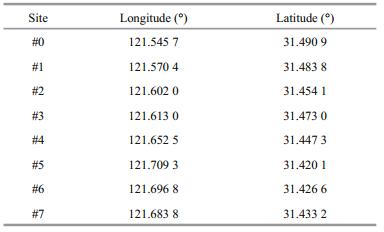
| Figure 1 Location of the Qingcaosha Reservoir and observation sites |
The observational data in this study was collected by the Shanghai Environmental Monitoring Center (SEMC) and National Engineering Research Center of Urban Water Resources (NERC) (Fig. 1, Table 1). Site #0 was located at the northwest gate to monitor the inflow water quality from the Changjiang estuary. The other observation sites (#1–#7) were set according to the bathymetry characteristics of the reservoir. DO, total nitrogen (TN), total phosphorus (TP) and phytoplankton Chl-a were collected at sites #0–#5 from 2009 to 2013. The biomass of Cyanophyta was determined at site #4 from 2009 to 2013. The 2-MIB concentrations from 2011 to 2013 were determined at sites #0, #4, #6 and #7. All the observed and experimented data were sampled at a depth of 0.5 m from the water surface. Every sample was collected instantaneously without combination. DO was in-situ measured using the electrochemical probe method, and the other water quality parameters were analyzed in laboratories. TN was analyzed by alkaline potassium persulfate digestion-UV spectrophotometry. TP was determined by ammonium molybdate spectrophotometry. Chl-a was analyzed using spectrophotometric method. The biomass of Cyanophyta was analyzed by cell counting and dry weight measurement. 2-MIB was analyzed using solid phase micro extraction (SPME) and gas chromatography.
ECOMSED model was adapted for the hydrodynamic simulation in Qingcaosha Reservoir. ECOMSED is applicable to shallow water environment, such as rivers, estuaries, reservoirs and lakes. Model performance has been evaluated by applications of the model to many real-world situations. There have been over 350 journal articles that were based on the use of the various ECOMSED sub-models (Blumberg and Krone, 2002). The orthogonal & curvilinear coordinate in the horizontal direction and the σ coordinate in the vertical direction were utilized in this model to match well with the topography and shorelines. RCA was adapted for the water quality simulation in Qingcaosha Reservoir. RCA model is the descendant of WASP/AESOP, supported by the EPA's Center for Water Quality Modeling (Fizpartick, 2004). It is able to directly interface with ECOMSED and utilizes the same model grid, geometry and bathymetric information as used in the hydrodynamic model. RCA is open-source and has a flexible structure to allow developers to add new water quality indexes and ecological modules in the model. Using RCA, we rebuilt an ecological model that had been developed to simulate the nutrients and different algal species in Dianshan Lake by the authors (Chen et al., 2016). Dianshan Lake is a tidal lake located in the lower reaches of the Taihu Lake Basin and is also an important drinking water resource for Shanghai. Dianshan Lake and Qingcaosha Reservoir are both shallow water resources with similar algal species and growth successions. The predominant algae are Bacillariophyta in winter, Chlorophyta in spring and autumn, and Cyanophyta in summer.
In this study, the ecological model rebuilt by RCA was applied in Qingcaosha Reservoir and a new module for 2-MIB was developed. The generation of 2-MIB in the model was designed according to the observed data in Qingcaosha Reservoir and the global measurements of 2-MIB (Fig. 2). The T & O compounds detected in Qingcaosha Reservoir were geosmin and 2-MIB. The maximum level of geosmin was 0.002 mg/m3, while the level of 2-MIB could exceed 2.5 mg/m3. Therefore, 2-MIB is the main T & O compound in Qingcaosha Reservoir. According to previous studies, the main source of 2-MIB is not from the growth of Cyanophyta but from the microbial decomposition of dead Cyanophyta in the sediment (Zhu et al., 2008; Deng et al., 2013). The DO concentration in the overlying water has an important influence on the release of 2-MIB. The release of 2-MIB from the sediment occurs mainly in oxygenstarved water, and sediment disturbance can aggravate this process (Zhu et al., 2008; Hu et al., 2009). Biodegradation appears to be more important than volatilization, photolysis or adsorption in the reduction of 2-MIB in water (Ho et al., 2007).

|
| Figure 2 Processes related to 2-MIB in the model |
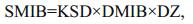
The main equations for the 2-MIB simulation are as follows:
 (1)
(1) (2)
(2) (3)
(3) (4)
(4) (5)
(5) (6)
(6) (7)
(7) (8)
(8)where DMIB is the generation rate of 2-MIB from dead Cyanophyta, DEP is the generation rate of dead Cyanophyta, RM is the mass ratio of potential 2-MIB in Cyanophyta cells, SMIB is the sediment flux of 2-MIB, DZ is the depth of each vertical layer in the model, KSD is the sediment ratio of detritus, NSMIB is the net sediment flux of 2-MIB, SEDMIB is the accumulated concentration of 2-MIB in the sediment, dt is the computational time step in the model, RMIB is the release flux of 2-MIB from the sediment, MIBDO is the threshold concentration of DO in the overlying water (which determines the presence of an anaerobic environment in the sediment), KRSMIB is the release rate of 2-MIB from the sediment at 20℃, TRSMIB is the temperature coefficient for the release rate of 2-MIB from the sediment, T is the temperature of the overlying water, HSMIB is the half-saturation constant for the sediment release of 2-MIB, DTMIB is the rate of variation of 2-MIB in the water, MIB is the 2-MIB concentration in the water, DGMIB is the degradation rate of 2-MIB in the water, KMIB is the maximum degradation rate of 2-MIB in the water at 20℃, TMIB is the temperature coefficient for the degradation rate of 2-MIB in the water, and HMIB is the half-saturation constant for the degradation of 2-MIB in the water.
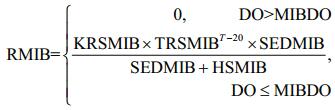
The reasonable ranges of the main coefficients in the model were determined by experiments and from the literature (Ji et al., 2004; Ho et al., 2007; Zhu et al., 2008), and their values were adjusted and confirmed in the calibration (Table 2).
The variations in the nutrients, Chl-a, algae and 2-MIB in the reservoir from 2009 to 2013 were simulated by RCA with the 2-MIB module, which was coupled with the hydrodynamic field. The flow field was simulated using ECOMSED that specified the open boundaries using historical drainage and discharge data for the reservoir and the water surface boundaries using wind data.
The concentrations of TN, TP, DO, Chl-a, Cyanophyta and 2-MIB in the 2-MIB and ecological model were validated against observational data (Figs. 3 and 4). Compared with the observational data, the model successfully simulated the variations in nutrients, algae and 2-MIB in Qingcaosha Reservoir. The observed nutrient and algal data showed that the phytoplankton quickly grew in the summer and autumn of 2009 (Fig. 3) because of stagnant water conditions due to a lack of water intake and supply in the reservoir. Nutrients decreased in 2009 because of a lack of nutrient input and nutrient consumption during algal growth. In the second half of 2010, the nutrient concentrations gradually increased to a high level because of increased intake of the high-nutrient estuarine water. The peaks in Chl-a and Cyanophyta in summer decreased year after year. The algal growth was obviously limited by the increasingly frequent water intake and supply in the reservoir. DO fluctuated seasonally, ranging mostly from 4 g/m3 in summer to 14 g/m3 in winter; DO was consumed by nutrients and algae and supplemented by water intake and atmospheric reaeration.

|
| Figure 3 Comparison of the simulated and observed water quality data at site #4 Lines: simulated results; cross spots: observed data. |

|
| Figure 4 Comparison of the simulated and 2-MIB observational data a. site #4; b. site #6; c. site #7; lines: simulated results; cross spots: observational data. |
In the simulation, 2-MIB was released mainly in summer and autumn, when DO was low and Cyanophyta levels were high. The durations of 2-MIB events were short, and the peaks were very high. The peaks gradually decreased annually as the water intake and supply increased, limiting the growth of Cyanophyta. The annual trends of the simulated 2-MIB matched the measured data quite well (Fig. 4).
The averaged relative error of each simulated parameter was calculated to evaluate the accuracy of the ecological model. The equation adopted from other similar studies is as follows (Pei and Ma, 2002; Chen et al., 2016):
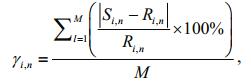 (9)
(9)where, i is the index of water quality parameters, n is the index of observation sites, l is the index of month, M is the number of total months, γ is the averaged relative error of water quality parameters, S is the monthly average of simulated results, and R is the monthly average of real data.
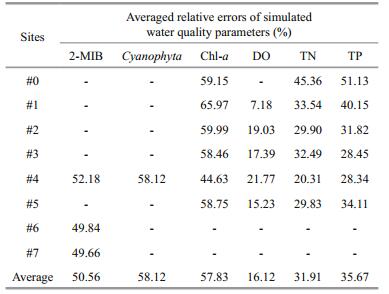
The maximum errors are from Cyanophyta, Chl-a and 2-MIB (averaged errors were 58.12%, 57.83% and 50.56%, respectively), while the minimum errors are from DO (averaged errors were 16.12%, Table 3). The 2-MIB of #0 was not included in the error statistics, because it was adapted to be the boundary concentration of upstream. The averaged errors of other parameters are about 30%. As shown in Table 3, when compared with the calibration errors in other studies (Pei and Ma, 2002; Chen et al., 2016), the errors of simulated results are acceptable to describe the variations in water quality, algae and 2-MIB in Qingcaosha Reservoir.
|
According to the temporal variations of DO in different layers (Fig. 5), the DO difference among vertical layers was very small in winter and grew larger in summer, because the oxygen consumption processes of algae and nutrients in water and sediment were more obvious while the water temperature was high. The difference was still small in 2009 and 2011, because the nutrients influx, the main oxygen consumer, was still low in the first 2 years. There was the largest difference of DO in vertical in the summer of 2011. The valley of the bottom layer, less than 1 mg/m3, was 2 mg/m3 lower than the top layer. And the difference was still obvious in the summers of 2012 and 2013, because of the adequate nutrients influx into the reservoir. The low oxygen level in the bottom layer could result in an oxygen-starved environment in the overlying water, activate the microbial decomposition of dead Cyanophyta in the sediment and lead to the release of 2-MIB from the sediment.

|
| Figure 5 Temporal variations of DO in different layers at site #1 Blue line: surface layer; red line: middle layer; green line: bottom layer. |
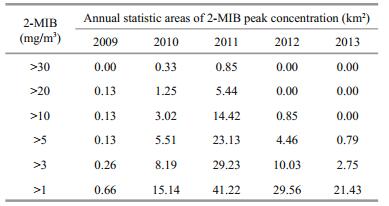
The annual statistics of the maximum simulated surface concentrations of 2-MIB in the reservoir were used to analyze the spatial and temporal variations in 2-MIB during different reservoir operations (Fig. 6; Table 4). The maximum surface concentration of Cyanophyta and the minimum concentration of DO in the overlying water were also determined to support the analysis of the 2-MIB variation (Figs. 7 and 8).

|
| Figure 6 Statistical distributions of the simulated maximum 2-MIB concentration in the surface layer from 2009 to 2013 (unit: g/m3) |

|
| Figure 7 Statistical distributions of the simulated maximum Cyanophyta abundance in the surface layer from 2009 to 2013 (unit: g/m3) |

|
| Figure 8 Statistical distributions of the simulated minimum DO concentration in the bottom layer from 2009 to 2013 (unit: g/m3) |
The spatial distribution of the simulated maximum Cyanophyta varied from 0.8 to 1 g/m3 in 2009 (Fig. 7). Cyanophyta bloomed throughout the whole reservoir under stagnant water conditions, and a small amount of 2-MIB was simultaneously released (Fig. 6). The area with 2-MIB concentrations above 1 mg/m3 in the annual statistics was only 0.66 km2 in 2009 (Table 4). This phenomenon could be explained by the annual statistics of DO in 2009 (Fig. 8). The minimum DO concentration in the overlying water exceeded 4 g/m3 in 2009, which reduced the probability of an anaerobic environment forming in the sediments. The threshold concentration of DO in the overlying water for the formation of an anaerobic environment in the sediments was set to 3.8 g/m3 in the simulation. This value was determined by the former research result in laboratory (2-MIB released little from sediment while DO was above 4 g/m3) and the model validation (Zhu et al., 2008). The microbial decomposition of dead algae was suppressed, and the release of 2-MIB was slow and small in 2009.
The maximum Cyanophyta abundance was decreased by half with the increasing water intake and supply to the reservoir in 2010. However, the intake of water adds nutrients to the reservoir, and higher nutrient levels in the reservoir lead to greater oxygen consumption. An oxygen-starved area appeared in the northwest region of the reservoir, near the gate for water intake (Fig. 8), and the microbial decomposition of dead algae occurred in the anaerobic environment. The 2-MIB levels were high in the same area, and the maximum 2-MIB concentration exceeded 30 mg/m3 in 2010 (Fig. 6; Table 4).
The most severe 2-MIB episode occurred in 2011. The maximum level of 2-MIB was greater than 10 mg/m3 along the central wetland in the reservoir. This event covered an area of 14.42 km2, representing almost 30% of the total area of the Qingcaosha Reservoir (Fig. 6; Table 4). In 2011, the water intake continuously increased, and the water exchange was more frequent in the reservoir. The maximum Cyanophyta abundance was limited to 0.06–0.2 g/m3 (Fig. 7), but the area of a potential anaerobic environment extended to the entire western portion of the reservoir because more oxygen-consuming nutrients were taken into the reservoir (Fig. 8). The anaerobic environment and the potential sediment source of 2-MIB accumulated in 2009 and 2010, causing the 2-MIB episode in 2011.
The low-oxygen area in the bottom of the reservoir inevitably expanded in 2012 and 2013 because of the increasing water supply and frequent water intake (Fig. 8). However, the maximum levels and highconcentration areas of 2-MIB obviously decreased in these two years (Fig. 6; Table 4) because the 2-MIB in the sediment had been sufficiently released and because the Cyanophyta had been essentially controlled since 2011 (Figs. 6 and 7). The maximum 2-MIB concentration varied from 3 to 10 mg/m3 in 2012 and was mainly concentrated in the mid-north and southeast shoals along the reservoir embankment. The maximum 2-MIB level decreased to 3–5 mg/m3 in 2013, and the area shrank to the southeast shoal (Fig. 6).
4 CONCLUSIONIn this research, an ecological module based on RCA was developed to simulate the generation and release of 2-MIB in the Qingcaosha Reservoir, which is an important drinking water source. This model was designed based on observational data in the reservoir and previous global measurements and analyses of 2-MIB. The simulated variation trends of nutrients, algae and 2-MIB in the reservoir were fairly consistent with the observed data.
According to the simulation, 2-MIB episodes in the reservoir were the combined result of a Cyanophyta bloom and an oxygen-starved environment in the overlying water. 2-MIB can be quickly released only when the sediment with enough dead algae source is overlain by an anaerobic environment. Therefore, to suppress the generation and release of 2-MIB, water authorities could increase water exchange and improve water mobility in water resources to inhibit algal growth and implement water aeration devices to increase the oxygen levels in areas prone to becoming anaerobic.
This study enhances the understanding of the generation and release mechanisms of 2-MIB, thereby providing useful information for better management of drinking water resources experiencing T & O problems caused by 2-MIB.
5 DATA AVAILABILITY STATEMENTThe data that support the findings of this study are available from Shanghai Academy of Environmental Sciences, but restrictions apply to the availability of these data, which were used under license for the current study, and so are not publicly available. Data are however available from the authors upon reasonable request and with permission of Shanghai Academy of Environmental Sciences.
6 ACKNOWLEDGMENTWe acknowledge the anonymous reviewers for their valuable comments and suggestions.
Blumberg A F, Krone R B. 2002. ECOMSED Manual. Academic Press, New York, USA. 194p.
|
Burgos L, Lehmann M, De Andrade H H R, de Abreu B R R, de Souza A P, Juliano V B, Dihl R R. 2014. In vivo and in vitro genotoxicity assessment of 2-methylisoborneol, causal agent of earthy-musty taste and odor in water. Ecotoxicology & Environmental Safety, 100: 282-286.
|
Chang P H, Isobe A, Kang K R, Ryoo S B, Kang H, Kim Y H. 2014. Summer behavior of the Changjiang diluted water to the East/Japan Sea: A modeling study in 2003. Continental Shelf Research, 81: 7-18.
DOI:10.1016/j.csr.2014.03.007 |
Chen Y Z, Lin W Q, Zhu J R, Lu S Q. 2016. Numerical simulation of an algal bloom in Dianshan Lake. Chinese Journal of Oceanology and Limnology, 34(1): 231-244.
|
Christensen V G, Graham J L, Milligan C R, Pope L M, Zeigler A C. 2006. Water quality and relation to taste-and-odor compounds in the North Fork Ninnescah River and Cheney reservoir, Southcentral Kansas, 1997-2003. United States Geological Survey Scientific Investigations Report, 2006-5095, 43p.
|
Codd G A. 2000. Cyanobacterial toxins, the perception of water quality, and the prioritisation of eutrophication control. Ecological Engineering, 16(1): 51-60.
|
Davies J M, Roxborough M, Mazumder A. 2004. Origins and implications of drinking water odours in lakes and reservoirs of British Columbia, Canada. Water Research, 38(7): 1900-1910.
|
Deng X W, Tao M, Zhang L, Xie P, Chen J, Zhang J. 2013. Relationships between Odors and Algae and Water Quality in Dongting Lake. Research of Environmental Sciences, 26(1): 16-21.
(in Chinese with English abstract) |
Downing J A, Watson S B, McCauley E. 1999. Predicting cyanobacteria dominance in lakes. Canadian Journal of Fisheries and Aquatic Sciences, 58(10): 1905-1908.
|
Dzialowski A R, Smith V H, Huggins D G, Denoyelles F, Lim N C, Baker D S, Beury J H. 2009. Development of predictive models for geosmin-related taste and odor in Kansas, USA, drinking water reservoirs. Water Research, 43(11): 2829-2840.
|
Fizpartick J J. 2004. A user's guide for RCA: release 3. 0. HydroQual Inc., New Jersey, USA. 217p.
|
Gao X L, Song J M. 2005. Phytoplankton distributions and their relationship with the environment in the Changjiang Estuary, China. Marine Pollution Bulletin, 50(3): 327-335.
|
Gregor J, Maršálek B, Šípková H. 2007. Detection and estimation of potentially toxic cyanobacteria in raw water at the drinking water treatment plant by in vivo fluorescence method. Water Research, 41(1): 228-234.
|
Ho L, Hoefel D, Bock F, Saint C P, Newcombe G. 2007. Biodegradation rates of 2-methylisoborneol (MIB) and geosmin through sand filters and in bioreactors. Chemosphere, 66(11): 2210-2218.
DOI:10.1016/j.chemosphere.2006.08.016 |
Hu J D, Zhang X H, Wan Z M, Wang Z J. 2009. Investigation on characteristics of odor compounds and bacterial community in a typical urban polluted river. Research of Environmental Sciences, 22(1): 47-51.
(in Chinese with English abstract) |
Izydorczyk K, Tarczynska M, Jurczak T, Mrowczynski J, Zalewski M. 2005. Measurement of phycocyanin fluorescence as an online early warning system for cyanobacteria in reservoir intake water. Environmental Toxicology, 20(4): 425-430.
|
Ji R P, Lu X W, Li X N. 2004. Removal of taste and odor compounds from eutrophic raw water. Water & Wastewater Engineering, 30(10): 8-13.
(in Chinese with English abstract) |
Mau D P, Ziegler A C, Porter S D, Pope L M. 2004. Surfacewater-quality conditions and relation to taste-and-odor occurrences in the Lake Olathe Watershed, Northeast Kansas, 2000-02. United States Geological Survey Scientific Investigations Report, 2004-5047, 95p.
|
Parinet J, Rodriguez M J, Sérodes J. 2010. Influence of water quality on the presence of off-flavour compounds (geosmin and 2-methylisoborneol). Water Research, 44(20): 5847-5856.
|
Pei H P, Ma J Y. 2002. Study on the algal dynamic model for West Lake, Hangzhou. Ecological Modelling, 148(1): 67-77.
|
Qiu C, Zhu J R. 2013. Influence of seasonal runoff regulation by the Three Gorges Reservoir on saltwater intrusion in the Changjiang River Estuary. Continental Shelf Research, 71: 16-26.
DOI:10.1016/j.csr.2013.09.024 |
Smith V H, Sieber-Denlinger J, de Noyelles F Jr, Campell S, Pan S G, Randtke S J, Blain G T, Strasser V A. 2002. Managing taste and odor problems in a eutrophic drinking water reservoir. Lake and Reservoir Management, 18(4): 319-323.
DOI:10.1080/07438140209353938 |
Sugiura N, Utsumi M, Wei B, Iwami N, Okano K, Kawauchi Y, Maekawa T. 2004. Assessment for the complicated occurrence of nuisance odours from phytoplankton and environmental factors in a eutrophic lake. Lakes & Reservoirs: Research and Management, 9(3-4): 195-201.
|
Watson S B, Charlton M, Rao Y R, Howell T, Ridal J, Brownlee B, Marvin C, Millard S. 2007. Off flavours in large waterbodies: physics, chemistry and biology in synchrony. Water Science & Technology, 55(5): 1-8.
|
Wu H, Zhu J R, Chen B R, Chen Y Z. 2006. Quantitative relationship of runoff and tide to saltwater spilling over from the North Branch in the Changjiang Estuary: A numerical study. Estuarine, Coastal and Shelf Science, 69(1-2): 125-132.
DOI:10.1016/j.ecss.2006.04.009 |
Zhang Y C, Zhang N, Xu B B, Kumirska J, Qi F. 2016. Occurrence of earthy–musty taste and odor in Taihu Lake, China: spatial and seasonal patterns. RSC Advances, 6(83): 79723-79733.
|
Zhu C W, Zhang X H, Wang L Y. 2008. Coupled influence of algae and sediment on typical odor compound in water source. China Water & Waste Water, 24(5): 14-17.
(in Chinese with English abstract) |