 2018, Vol. 36
Institute of Oceanology, Chinese Academy of Sciences
Article Information
- LIU Hongmei(刘红梅), WANG Bin(王斌), HU Xiaoke(胡晓珂)
- Sediment bacterial communities are more complex in coastal shallow straits than in oceanic deep straits
- Chinese Journal of Oceanology and Limnology, 36(5): 1643-1654
- http://dx.doi.org/10.1007/s00343-018-7133-6
Article History
- Received May. 4, 2017
- accepted in principle Aug. 7, 2017
- accepted for publication Sep. 23, 2018


2 Key Laboratory of Coastal Biology and Bioresource Utilization, Yantai Institute of Coastal Zone Research, Chinese Academy of Sciences, Yantai 264003, China
The bacterial communities are major decomposers, secondary producers (Li and Gao, 2012) and major drivers of biogeochemical processes in the marine (Fuhrman et al., 2015). It is therefore important to investigate the marine bacterial communities. One fundamental question is the bacterial community assembly laying emphasis on the structures, diversities, abundant and rare bacteria and coexist relationships (Pedrós-Alió, 2012; Nemergut et al., 2013; Lynch and Neufeld, 2015). According to the niche theory (Pontarp et al., 2012), the structures and diversities of bacterial communities are determined by environmental variables. The hydrological environments in the marine exert great effects on the environmental variables and the microbial dispersion (Gilbert et al., 2012), suggesting that the assembly of marine bacterial community should be related to the hydrological environments such as currents. In the water body, for instance, regions with strong currents and large thermal fluctuations selected microbial communities with the greatest capacities for flexibility and evolution (Doblin and van Sebille, 2016), and the taxonomic and functional richness increased with depth, possibly resulting from vertical stratification with changes in physicochemical parameters (Sunagawa et al., 2015). Thus, these findings implied that water movements will exert effects on the microbial communities. Since sediment transportation is carried by currents (Shao et al., 2007), and the structures of bacterial communities in the sediments of Fram Strait with West Spitsbergen Warm Current (WSWC) and East Greenland Cold Current (EGCC) were similar along the direction of currents (Jacob et al., 2013), we inferred that the currents might influence the bacterial communities in the area they flowed along. However, investigations on the bacterial communities in sediments in the regions with strong currents remain sparse.
Additionally, the abundances of bacterial communities are affected not only by environmental variables but also by coexisting bacteria in the habitats. Various relationships among bacteria (e.g., competition and symbiosis) exert distinct influences on the parties (Hibbing et al., 2010). The widespread biofilm also provides excellent evidence (Singh et al., 2006). Bacterial associations thus should be included to contribute better understandings of the bacterial communities assembly (Faust and Raes, 2012; Nemergut et al., 2013; Coutinho et al., 2015). Recently, network analysis, which was used to investigate the associations among different phylotypes, has been introduced into bacterial communities in soil and marine environments (Chaffron et al., 2010; Zhou et al., 2011a; Barberan et al., 2014).
The straits, which separate and connect two large bodies of water, are influenced by strong tidal currents. According to the morphology, oceanic and atmospheric forcing, and flow characteristics of straits, straits have been classified into different types including shallow strait and deep strait (Li et al., 2015). The Bohai Strait (BS) is the foremost channel for the materials exchange between the Bohai Sea and the Yellow Sea. It is a typical shallow strait with depth ranged from 14 m in the south to 80 m in the north. The regional current pattern described as "north-in south-out" of the BS is the important factor controlling the sediment transportation in the BS (Li et al., 2016). Meanwhile, the BS adjacent to well-developed economic zones including Dalian and Yantai in the north and south, respectively, is an important fishery and navigable seaway. The anthropogenic influences exacerbate the complexity of environments in the BS. Thus, the BS is a representative to investigate the bacterial communities in the sediments with currents and anthropogenic influences. Despite some studies have investigated the microbial communities in the deep strait such as Fram strait (Jacob et al., 2013) and Bransfield Strait (Signori et al., 2014), few studies were reported in the coastal shallow straits. The Fram Strait is typical deep strait with depth around 2 500 m. It is the only deep-water connection between the Arctic Ocean and the World Oceans. Considering the little studies on the microbial ecology in straits, BS and FS are pretty much the extremes, at least for which samples probably exist, although there are lots of straits with the depth ranged from 20 m to 2 500 m including Strait of Hormuz, Strait of Gibraltar and Strait of Messina. Comparative studies on bacterial communities between in the BS and FS may provide more understanding on the ecological roles of bacterial communities in the straits.
This study aimed to investigate the structures, biogeographic patterns and bacterial associations of bacterial communities in surface sediments of BS in winter compared to those in FS. Our study will provide more evidences for the bacterial ecology in straits representing hydrologically complex environments.
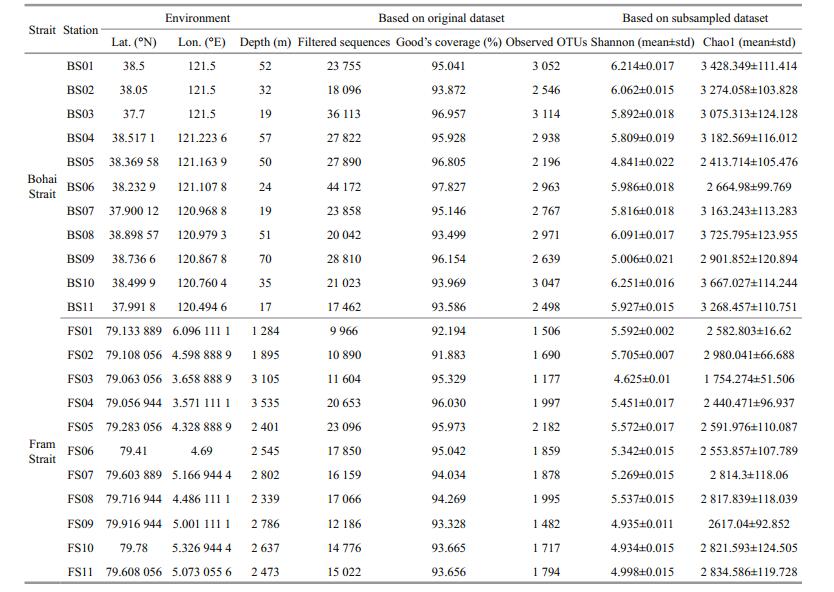
2 MATERIAL AND METHOD 2.1 Sediment sampling, DNA extraction, PCR amplification, and Illumina-Miseq sequencingEleven stations were sampled to cover the BS (Fig. 1). At the time of sampling, composite samples of surface sediments were collected between December 17, 2013, and December 21, 2013. At each station, sediments were sampled in triplicates for the 0–5 cm surface layer using box grab. The sediment samples were transferred to sterile polythene bags, mixed, and stored at -80℃ in the dark until processing. Information regarding the depth of the stations was obtained from a navigational report. Eleven stations in the Fram Strait (FS) were selected for comparative analysis (Table 1). The samples in FS were collected in July 2009. For the environmental variables, only depth was both detected in the BS and FS.

|
| Figure 1 Locations of the eleven survey stations in the Bohai Strait and Fram Strait (plotted with Surfer 11.0TM) Map drawing No. GS(2016)2945 (accessed from the National Administration of Surveying, Mapping and Geoinformation of China). |
Bacterial genomic DNA was extracted using MoBio PowerSoilTM kit (MoBio, Carlsbad, CA, USA) according to the manufacturer's instructions. Three replications were extracted and mixed together for each sample. Eleven DNA extracts were obtained. The universal primers 515F (5′-GTGCCAGCMGCCGCGG-3′) and 907R (5′-CCGTCAATTCMTTTRAGTTT-3′) were used to amplify the V4–V5 region of the bacterial 16S rRNA gene using PCR. After extracting and purifying amplicons from 2% agarose gels using the AxyPrep DNA Gel Extraction Kit (Axygen Biosciences, Union City, CA, US), the purified amplicons were quantified using QuantiFluorTM-ST (Promega, Fitchburg, WI, USA). An Illumina-Miseq platform (Illumina Inc., San Diego, CA, USA) was applied for paired-end sequencing (2×250) according to the standard protocols in Majorbio (Shanghai, China).
2.2 Sequence data processingThe FS sequence data were downloaded from the GenBank Sequence Read Archives (www.ncbi.nlm.nih.gov) under BioProject ID: PRJNA208712. The sequences were obtained using 454 pyrosequencing of the 16S rRNA gene's V4–V6 region described previously (Jacob et al., 2013). The BS and FS sequence data were then transformed into operational taxonomic unit (OTU)-by-sample tables using Mothur software (version 1.36.1) (Schloss et al., 2009) according to the standard operating procedure (Kozich et al., 2013) and previous description (Jacob et al., 2013). Because of the different amplification region, the sequence data from BS and FS were processed separately. There were three alterations: (ⅰ) the latest release of the Silva reference (downloaded from http://www.mothur.org/wiki/Silva_reference_files, Release 123) with more reference sequences was applied for assigning taxonomic information; (ⅱ) singletons containing only one sequence across all samples are more likely to be artefacts, and we preferred to remove them to reduce the impact of spurious errors for both FS and BS. Each OTU was filtered to contain more than two sequences from at least two samples (Zhou et al., 2011b; Flynn et al., 2015); (ⅲ) as the primers we used are supposed to amplify members of the bacteria, thus those OTUs affiliated to archaea, chloroplasts and mitochondria, which might be undesirable and random mistakes or have no functional role in microbial communities (Kozich et al., 2013) were removed.
2.3 Comparative analysis between FS and BSFirst of all, the following data processing was executed separately for the BS and FS. Those OTUs with average relative abundance (RA) of less than 0.1% were considered to be rare (Coveley et al., 2015; Lynch and Neufeld, 2015). Shannon and chao1 indices were applied to estimate the α-diversity. Because sequencing depth has great influence on estimated diversity (Magurran, 2003) and the sequencing depths of FS and BS were different, original datasets were subsampled to 9 900 sequences per sample (the lowest number of sequences in samples was 9 966). The Bray-Curtis index was applied to evaluate dissimilarities in community composition within samples. Cluster analysis was applied based on the average distance matrices, which were respectively calculated with entire OTUs, rare OTUs, and abundant OTUs of subsamples. Subsampling and calculating the three indices were executed 103 times to obtain the mean values. For the taxonomic composition, high Good's coverage across all samples was necessary (Magurran, 2003). The original datasets with higher Good's coverage were thus normalized into RA. The RAs of OTUs were summarized at the class, family, and genus levels. T-test was used to analyze the significant differences in the RA at different levels between in FS and BS. OTUs that occurred in fewer than five samples in FS or BS were removed, considering the following reasons: (ⅰ) the 11 samples were considered to be parallel; and (ⅱ) the network with reduced complexity facilitated the determination of core communities. Datasets with 9900 rarefied sequences per sample were used to calculate the Spearman correlation coefficients (P < 0.05, adjusted with "Benjamini Hochberg") to explore the abundance associations among OTUs in FS and BS. Those correlations were visualized into the networks, in which the nodes and connections represented the bacterial populations and the correlations. Based on network topology, the keystone species in the bacterial communities can be discerned (Zhou et al., 2011a). The degree defined as the number of connections connected to one node was used to evaluate the influence of the nodes in the network (Barberan et al., 2014). Significant correlations between two species were often related to their direct or indirect interactions (Faust and Raes, 2012; Barberan et al., 2014; Lupatini et al., 2014; Coutinho et al., 2015). An OTU with a higher degree value, which means more OTUs were correlated with the OTU, was thus considered to perform stronger influence (directly or indirectly) on the abundances of the correlated members in the network. R software (version 3.3.2) was employed to perform calculations and to plot the results.
3 RESULT AND DISCUSSION 3.1 The data were comparableThe survey stations are shown in Fig. 1. Some measures have been taken to make sure that the data of FS and BS were comparable: (ⅰ) the sequence data was processed in the same methods; (ⅱ) considering the different amplification region, the sequence data of FS and BS were processed separately; (ⅲ) considering that the sequencing depth affects estimating alpha- and beta-diversity, subsampled datasets with same sequences were used; (ⅳ) comparative analysis was performed on the taxonomic level with relative abundances, when Good's coverage (BS: 95.34%±1.5%, FS: 94.13%±1.39%) indicated that sequencing captured majority of the bacterial diversity in the samples (Table 1).
3.2 The bacterial community in BS was more complex than that in FSFirst, after quality and OTU filtering, 289 043 and 169 268 16S rRNA gene sequences with 5 309 and 4 313 OTUs, identified at a 3% dissimilarity cutoff were obtained across samples in FS and BS, respectively (Table 1). The Shannon and Chao1 values were both higher in BS (Shannon: 5.81±0.46, Chao1: 3 160.49±393.84) than those in FS (Shannon: 5.27±0.35, Chao1: 2 599.45±339.86, P < 0.01, Table 1), indicating that the bacterial communities in BS were more diverse and richer than those in FS.
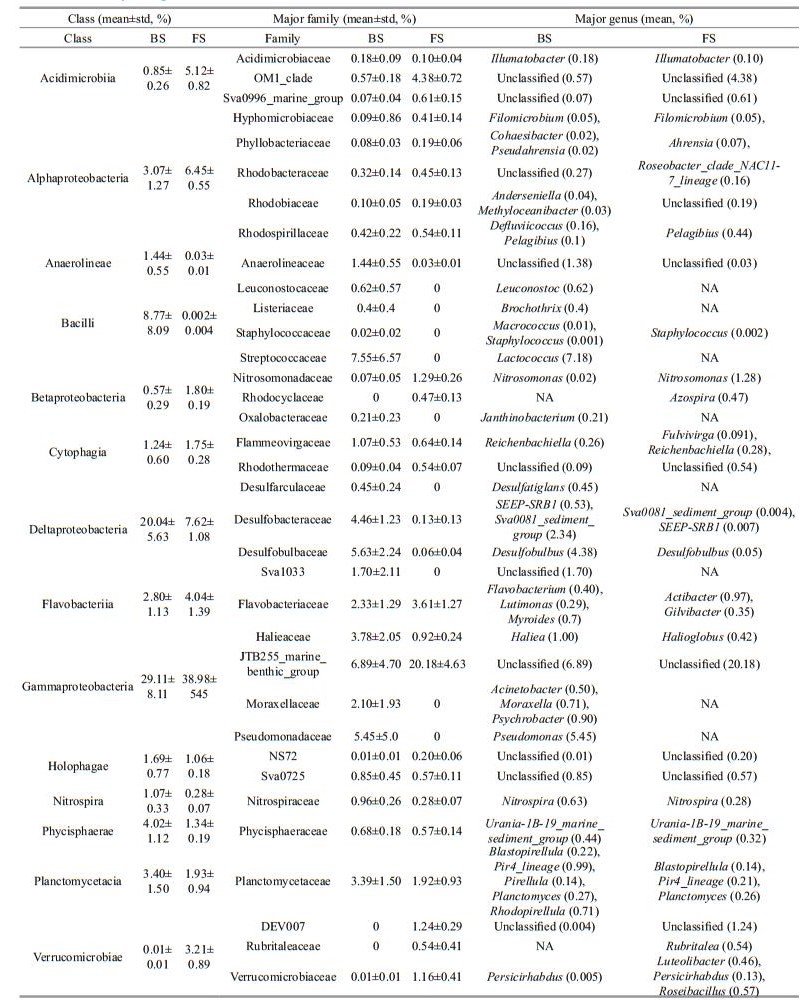
Second, the taxonomic compositions in BS and FS showed typical characteristics of bacterial communities in coastal and oceanic regions, respectively. At class level, the relative abundance of Deltaproteobacteria was higher in BS (20.04%±5.63%) than in FS (7.62%±1.07%, P < 0.05, Table 2). The major contributors at family level were Desulfobacteraceae and Desulfobulbaceae. At a global scale, the relative abundance of Deltaproteobacteria in sediments tended to decrease from the coastal sea to the open sea (Liu et al., 2015). At family level, the Halieaceae (Haliea genus and unclassified in BS, Halioglobus genus and unclassified in FS) affiliated to Gammaproteobacteria is aerobic anoxygenic phototrophic bacteria (AAPB) and mainly inhabits in coastal sea. Members of this family require dissolved organic carbon (DOM) as carbon source, and are capable of using bacteriochlorophyll a and carotenoids to harvest light and utilize light as additional energy source (Spring et al., 2015). Its relative abundance in BS was 3.78%±2.05% while the number in FS was 0.92%±0.24%. Taking into account the availability of DOM and light limitation for AAPB, the shallow depth and vertically well mixed water are benefit for the colonization of AAPB in BS. The family OM1_ clade affiliated to the class Acidimicrobiia and the family JTB255_marine_benthic_group affiliated to Gammaproteobacteria showed higher relative abundance in FS (4.38%±0.72% and 20.18%±4.63%) than in BS (0.57%±0.18% and 6.89%±4.70%, Table 2). Both of them were more sequence-abundant in polar, cold regions (Bienhold et al., 2016).
|
Moraxella and Psychrobacter were psychrophiles with widespread distributions in deep seas such as in the Japan Trench and cold Antarctic environments (Maruyama et al., 2000). However, the genera Acinetobacter, Moraxella, and Psychrobacter affiliated to Moraxellaceae were not observed in FS but in BS. Meanwhile, our previous study had isolated one crude oil-degrading Acinetobacter sp. strain HC8-3S from sediments of the Bohai Sea (Lin et al., 2014; Liu et al., 2016). Likewise, the genus Pseudomonas in the family Pseudomonadaceae, which is able to colonize a wide range of niches (Madigan et al., 2014), was abundant in BS but not detected in FS, despite that Pseudomonas has been previously found in deep seas (Pan and Hu, 2015; Yoshida et al., 2015). Therefore, further explorations on these unusual phenomena might be helpful to investigate the microbial ecology in straits.
Third, compared to the FS, the BS was more susceptible to the anthropogenic influences. At class level, the relative abundance of Bacilli in BS was higher (8.77%±8.09%) than that in FS (7.62%±1.07%, P < 0.05, Table 2). The genus Lactococcus (7.18%±6.53% in BS; not observed in FS), which contributed greatly to the high abundance of Bacilli in BS, was found to be abundant in fish and shellfish (Itoi et al., 2014). Since the Bohai Sea is an important fishing farm in China, the fishery breeding was supposed to influence the bacterial communities in the surface sediments of BS.
3.3 The structures of bacterial community differed with increasing water depthThe tidal current scour in straits may lead to depth gradients. In the BS, the depth gradients are due to the scour of coastal and tidal currents (Li et al., 2016). Depth may shape the composition and structure of microbial communities in the global ocean (Sunagawa et al., 2015). In BS, cluster analysis based on Bray Curtis shows that the samples were separated by their depth layer (Fig. 2a), 15–20 m (BS11, BS07 and BS03), 21–50 m (BS10, BS08, BS02 and BS06) and 50–70 m (BS09, BS05, BS04 and BS01). The results shown in Fig. 2d were same to what described by Jacob et al. (2013). They indicated significant differences of bacterial community compositions and structures along the bathymetric transect. Remarkably, Gong et al. have revealed that depth shapes α and β diversities of the single-celled eukaryote in surficial sediments in the Bohai Sea and Yellow Sea (Gong et al., 2015).

|
| Figure 2 Dendrograms of cluster analysis based on the Bray-Curtis index among survey stations in BS and FS a. entire bacterial communities in BS; b. abundant compositions in BS; c. rare compositions in BS; d. entire bacterial communities in FS; e. abundant compositions in FS; f. rare compositions in FS. |
The rare OTUs termed as rare bacterial biosphere were acknowledged to make up a great fraction of the bacterial communities (Jacob et al., 2013; Coveley et al., 2015; Lynch and Neufeld, 2015). Approximately 97% of the OTUs were considered to be rare in this study. In total of 5 185 and 4 178 OTUs were considered to be rare and their relative abundances were 40.92%±5.6% and 27.74%±3.94% in BS and FS, respectively (data not shown). The cluster relationships among samples in abundant and rare communities (Fig. 2b, c) were both similar to those in entire communities (Fig. 2a). However, the dissimilarities among samples showed a descending order as Fig. 2c, Fig. 2a and Fig. 2b. For instance, the distances between BS07 and BS11 were approximately 0.1 in Fig. 2b, more than 0.2 in Fig. 2a and about 0.35 in Fig. 2c. Similar tendencies were found in FS (Fig. 2d, e, f). These findings were likely due to that microbes with high abundance have great effects on the structure and functions (Campbell and Kirchman, 2013; Zhang et al., 2013) while the more diverse rare communities were the major contributors to the diversity of communities (Lynch and Neufeld, 2015). Additionally, comparison between BS and FS indicated that dissimilarities among samples were lower in FS than in BS, in contrast to depth gradients in them (Table 1). It could be due to the more complex environmental shapers in BS than in FS.
3.4 Filamentous bacteria Desulfobulbaceae play key roles in BSBacteria do not exist in isolation but form complex ecological interaction webs (Faust and Raes, 2012), and the associations within the bacterial community are important elements of the structure of bacterial communities. The impacts of interaction may be positive, negative, and neutral. For instance, syntrophy between two species can benefit both species involved (positive impact), while competition results in negative impacts on both (Hibbing et al., 2010; Molloy, 2014). These interactions can be reflected by their abundance correlations (Faust and Raes, 2012). Numerous studies on the microbial biogeography (Campbell and Kirchman, 2013; Jacob et al., 2013; Buttigieg and Ramette, 2014; Coveley et al., 2015; Piontek et al., 2015) and the niche theory (Pontarp et al., 2012) known as the habitat filtering have indicated that members with positive correlations among them respond similarly to the environmental conditions in the habitats. That is, if two species showed positive correlations in their abundance across multiple environments or samples, it can be interpreted as evidence that they occupy similar ecological niches (Coutinho et al., 2015). Based on these observations, significant correlations between two species were often related to the direct or indirect interactions between the two species (Faust and Raes, 2012; Barberan et al., 2014; Lupatini et al., 2014; Coutinho et al., 2015)
In this work, 1 976 and 975 OTUs in BS and FS were used to calculate Spearman correlation coefficients. The number of significant correlations for BS and FS were 164 422 and 31 163. It is difficult to draw a clear conclusion from the huge and complex network (1 976 nodes and 164 422 edges in BS network, 975 nodes and 31 163 edges in FS network). In order to better interpret the network and increase the confidence for detecting only strong interactions, correlations with |r|≥0.9 (P≤0.05) were extracted to construct a new network (Fig. 3a, b). There are 1 303 nodes (65.94%) and 2 642 edges in the BS network. The numbers in FS network were 390 nodes (40%) and 315 edges. That is, 60% of the OTUs in FS did not perform strong abundance correlations with others, while the percentage in BS was 34.06%. Obviously, the BS network was more connected than the FS network. Therefore, we inferred that the bacterial community in the BS might be more interactive than that in the FS.

|
| Figure 3 a. BS; b. FS. Networks reveal Spearman correlations among the abundance of filtered OTUs. The nodes represent OTUs; c. BS; d. FS. The bubble diagram describes the number of OTUs affiliated to the family, the sum of degree values, its RA, and the max degree value performed by the OTUs affiliated to the family Different colors of nodes represent different families. The families other than the first ten families with high RAs were grouped into "Others." Nodes connected by red edges are positively correlated, and those connected by blue edges are negatively correlated (P < 0.05). |
To evaluate the taxonomic importance in the extracted network, degree value of nodes were calculated. Notably, about 75.5% of the nodes in the extracted network of BS were unclassified (the percentage in the extracted network of FS was 87.7%). The degree values were hence summarized at the family level. For clarity, OTUs unclassified at the family level were omitted in the following discussions. As shown in the Fig. 3c & d, there were 4 characteristics determining the importance of the involved families, including the relative abundance, the number of OTUs, the max degree values, and the sum degree values. As mentioned, microbes with high abundance have great effects on the structure and functions (Campbell and Kirchman, 2013; Zhang et al., 2013). In most case, the high number of OTUs was related to high relative abundance. The max degree values indicated the importance of the most important OTU affiliated to the families. The sum degree values revealed the importance of the families. In the extracted network of BS (Fig. 3c), 98 OTUs were affiliated to the family Planctomycetaceae with degree sum of 291. However, the highest degree value of these OTUs was only 16. In contrast, the three members of the family Streptococcaceae exhibited high max degree values (the three degree values were 45, 42, and 35). The Planctomycetaceae, Flavobacteriaceae, and the JTB255_marine_benthic_ group families were found in the FS network at the same time, suggesting that these three widely distributed families might play universal roles in constructing the bacterial communities. For the family Desulfobulbaceae, the number of OTUs, the relative abundance and the max degree value was 27, 5.14% and 30, respectively.
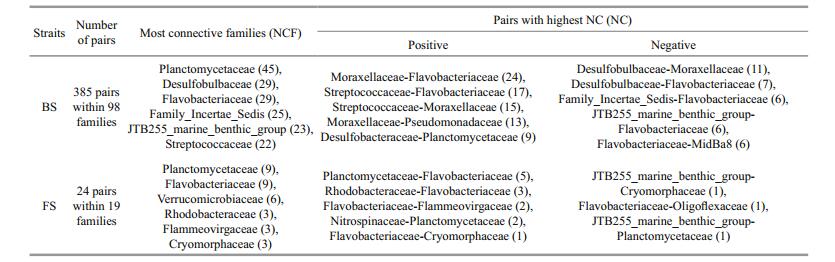
Additionally, taxon assignment on lower taxonomic levels is not always accurate, which might confuse the ecological signals and artefacts (Faust and Raes, 2012). To consider links and patterns above a certain taxonomic rank (for example, above family) were therefore suggested (Freilich et al., 2010). In this work (Table 3), 285 and 24 pairs of correlated families in BS and FS were observed, respectively. Planctomycetaceae, Flavobacteriaceae, and Desulfobulbaceae were the three most connected families in BS (degree values were 45, 29 and 29 in that order). In FS, they were Planctomycetaceae, Flavobacteriaceae, and Verrucomicrobiaceae (degree values were 9, 9, and 6 in that order). Additionally, the numbers of connections (NC) between two families at the OTU level were summarized to estimate the strength of connections between the two families. For instance, the positive NC value between Flavobacteriaceae and Streptococcaceae was 17, while the NC value between Flavobacteriaceae and Moraxellaceae was 24 (Table 3). In FS and BS, the highest NC values were both connected to Flavobacteriaceae. Flavobacteriaceae was a major component of microbial biomass in the marine pelagic zone, strongly coupled to phytoplanktonic primary production (photosynthesis), and has been reported to be responsible for a major fraction of organic matter remineralization in the oceans (Bowman, 2006). The shared pairs of positively correlated families consisted of Flammeovirgaceae-Planctomycetaceae, Flavobacteriaceae-Cryomorphaceae, and Phycisphaeraceae-Planctomycetaceae.
We firstly note that only one representative of each type of strait was picked in this study due to the lack of data, which might undermine the convincing of this study. Additionally, the environmental variables, for instance, temperature and nutrients which were generally accepted as the drivers of bacterial community structures were not detected in FS. The geographic distance especially latitude gradient was an important factor driving the variability of bacterial communities (Liu et al., 2015) when the locations of FS and BS were obviously different. Thus, it was difficult to accurately test what drove the differences of bacterial communities between FS and BS. More work such as the investigation on the bacterial communities in other straits and more detailed environmental variables are in request.
Network inference approaches cannot distinguish between true ecological interactions and other nonrandom processes (Faust and Raes, 2012). For instance, both syntrophy and niche overlap might lead to positive correlations in abundances between two species, despite the fact that syntrophy benefits both species while niche overlap leads to competition (Molloy, 2014; Coutinho et al., 2015). Thus, the summary of links and patterns at the family level in this study were just preliminary data for further exploration (e.g., metabolic activities or potential) to differentiate the true ecological interactions from other nonrandom processes.
4 CONCLUSIONIn this study, the bacterial communities in the surface sediments of the Bohai Strait were investigated and compared with that in the Fram Strait. Both of the coastal shallow Bohai Strait and the oceanic deep Fram Strait are influenced by strong currents. Our results suggested that the bacterial communities in Bohai Strait were more complex than what in Fram Strait. The structures of bacterial communities in the two straits differed significantly with increasing water depth as the results of tidal current scour in the straits. Rare compositions contributed to the bacterial seed bank while abundant compositions presented greater effects on the entire bacterial community structures. The bacterial community in BS might be more interactive than that in the FS. Filamentous bacteria from the family Desulfobulbaceae played a key role in BS but not in FS. Planctomycetaceae and Flavobacteriaceae were the most connected families in both FS and BS.
5 DATA AVAILABILITY STATEMENTThe 16S rRNA sequences have been deposited in the NCBI database under accession number PRJNA304670 (biosample accession numbers are from SAMN05206979 to SAMN05206989).
6 ACKNOWLEDGEMENTWe thank James Klippel-Cooper in School of Biological Sciences at Flinders University for his polishing to improve the language.
7 CONFLICT OF INTERESTThere are no conflicts of interest.
Barberan A, Bates S T, Casamayor E O, Fierer N. 2014. Using network analysis to explore co-occurrence patterns in soil microbial communities (vol 6, pg 343, 2012). ISME J., 8(4): 952.
|
Bienhold C, Zinger L, Boetius A, Ramette A. 2016. Diversity and biogeography of bathyal and abyssal seafloor bacteria. PLoS One, 11(1): e0148016.
DOI:10.1371/journal.pone.0148016 |
Bowman J P. 2006. The marine clade of the family flavobacteriaceae: the genera aequorivita, arenibacter, cellulophaga, croceibacter, formosa, gelidibacter, gillisia, maribacter, mesonia, muricauda, polaribacter, psychroflexus, psychroserpens, robiginitalea, salegentibacter, tenacibaculum, ulvibacter, vitellibacter and zobellia. In: Dworkin M, Falkow S, Rosenberg E, Schleifer K-H, Stackebrandt E eds. The Prokaryotes: Volume 7: Proteobacteria: Delta, Epsilon Subclass.Springer, New York. p.677-694.
|
Buttigieg P L, Ramette A. 2014. Biogeographic patterns of bacterial microdiversity in Arctic deep-sea sediments(HAUSGARTEN, Fram Strait). Frontiers in Microbiology, 5: 660.
DOI:10.3389/fmicb.2014.00660 |
Campbell B J, Kirchman D L. 2013. Bacterial diversity, community structure and potential growth rates along an estuarine salinity gradient. The ISME Journal, 7(1): 210-220.
DOI:10.1038/ismej.2012.93 |
Chaffron S, Rehrauer H, Pernthaler J, von Mering C. 2010. A global network of coexisting microbes from environmental and whole-genome sequence data. Genome Research, 20(7): 947-959.
DOI:10.1101/gr.104521.109 |
Coutinho F H, Meirelles P M, Moreira A P B, Paranhos R P, Dutilh B E, Thompson F L. 2015. Niche distribution and influence of environmental parameters in marine microbial communities:a systematic review. PeerJ, 3: e1008.
DOI:10.7717/peerj.1008 |
Coveley S, Elshahed M S, Youssef N H. 2015. Response of the rare biosphere to environmental stressors in a highly diverse ecosystem (Zodletone spring, OK, USA). PeerJ, 3: e1182.
DOI:10.7717/peerj.1182 |
Doblin M A, van Sebille E. 2016. Drift in ocean currents impacts intergenerational microbial exposure to temperature. Proceedings of the National Academy of Sciences of the United States of America, 113(20): 5700-5705.
DOI:10.1073/pnas.1521093113 |
Faust K, Raes J. 2012. Microbial interactions:from networks to models. Nature Reviews Microbiology, 10(8): 538-550.
DOI:10.1038/nrmicro2832 |
Flynn J M, Brown E A, Chain F J J, MacIsaac H J, Cristescu M E. 2015. Toward accurate molecular identification of species in complex environmental samples:testing the performance of sequence filtering and clustering methods. Ecology and Evolution, 5(11): 2252-2266.
DOI:10.1002/ece3.1497 |
Freilich S, Kreimer A, Meilijson I, Gophna U, Sharan R, Ruppin E. 2010. The large-scale organization of the bacterial network of ecological co-occurrence interactions. Nucleic Acids Research, 38(12): 3857-3868.
DOI:10.1093/nar/gkq118 |
Fuhrman J A, Cram J A, Needham D M. 2015. Marine microbial community dynamics and their ecological interpretation. Nature Reviews Microbiology, 13(3): 133-146.
DOI:10.1038/nrmicro3417 |
Gilbert J A, Steele J A, Caporaso J G, Steinbruck L, Reeder J, Temperton B, Huse S, McHardy A C, Knight R, Joint I, Somerfield P, Fuhrman J A, Field D. 2012. Defining seasonal marine microbial community dynamics. ISME J., 6(2): 298-308.
DOI:10.1038/ismej.2011.107 |
Gong J, Shi F, Ma B, Dong J, Pachiadaki M, Zhang X L, Edgcomb V P. 2015. Depth shapes α-and β-diversities of microbial eukaryotes in surficial sediments of coastal ecosystems. Environmental Microbiology, 17(10): 3722-3737.
DOI:10.1111/1462-2920.12763 |
Hibbing M E, Fuqua C, Parsek M R, Peterson S B. 2010. Bacterial competition:surviving and thriving in the microbial jungle. Nature Reviews Microbiology, 8(1): 15-25.
DOI:10.1038/nrmicro2259 |
Itoi S, Uchida J, Takanashi S, Narita T, Abe K, Naya S, Sugita H. 2014. The clam Meretrix lamarckii (Bivalvia:Veneridae) is a rich repository of marine lactic acid bacterial strains. Annals of Microbiology, 64(3): 1267-1274.
DOI:10.1007/s13213-013-0771-1 |
Jacob M, Soltwedel T, Boetius A, Ramette A. 2013. Biogeography of deep-sea benthic bacteria at regional scale (LTER HAUSGARTEN, Fram Strait, Arctic). PLoS One, 8(9): e72779.
DOI:10.1371/journal.pone.0072779 |
Kozich J J, Westcott S L, Baxter N T, Highlander S K, Schloss P D. 2013. Development of a dual-index sequencing strategy and curation pipeline for analyzing amplicon sequence data on the MiSeq illumina sequencing platform. Applied and Environmental Microbiology, 79(17): 5112-5120.
DOI:10.1128/AEM.01043-13 |
Li A C, Qiao L L, Wan X Q, Ma W W. 2016. Distribution, flux and seasonal variation of suspended particulate matters in the Bohai Strait. Oceanologia et Limnologia Sinica, 47(2): 310-318.
(in Chinese with English abstract) |
Li W, Gao K S. 2012. A marine secondary producer respires and feeds more in a high CO2 ocean. Marine Pollution Bulletin, 64(4): 699-703.
DOI:10.1016/j.marpolbul.2012.01.033 |
Li Y F, Wolanski E, Zhang H. 2015. What processes control the net currents through shallow straits? A review with application to the Bohai Strait, China. Estuarine, Coastal and Shelf Science, 158: 1-11.
DOI:10.1016/j.ecss.2015.03.013 |
Lin M, Liu Y H, Chen W W, Wang H, Hu X K. 2014. Use of bacteria-immobilized cotton fibers to absorb and degrade crude oil. International Biodeterioration & Biodegradation, 88: 8-12.
DOI:10.1016/j.ibiod.2013.11.015 |
Liu J W, Liu X S, Wang M, Qiao Y L, Zheng Y F, Zhang X H. 2015. Bacterial and archaeal communities in sediments of the North Chinese marginal seas. Microbial Ecology, 70(1): 105-117.
DOI:10.1007/s00248-014-0553-8 |
Liu Y H, Hu X K, Liu H. 2016. Industrial-scale culturing of the crude oil-degrading marine Acinetobacter sp. strain HC8-3S. International Biodeterioration & Biodegradation, 107: 56-61.
DOI:10.1016/j.ibiod.2015.11.007 |
Lupatini M, Suleiman A K A, Jacques R J S, Antoniolli Z I, de Siqueira Ferreira A, Kuramae E E, Roesch L F W. 2014. Network topology reveals high connectance levels and few key microbial genera within soils. Frontiers in Environmental Science, 2: 10.
DOI:10.3389/fenvs.2014.00010 |
Lynch M D J, Neufeld J D. 2015. Ecology and exploration of the rare biosphere. Nature Reviews Microbiology, 13(4): 217-229.
DOI:10.1038/nrmicro3400 |
Madigan M T, Martinko J M, Bender K S, Buckley D H, Stahl D A, Brock T. 2014. Brock Biology of Microorganisms. 14th edn. Pearson Benjamin Cummings,, San Francisco.
|
Magurran A E. 2003. Measuring Biological Diversity. WileyBlackwell, Oxford.
|
Maruyama A, Honda D, Yamamoto H, Kitamura K, Higashihara T. 2000. Phylogenetic analysis of psychrophilic bacteria isolated from the Japan Trench, including a description of the deep-sea species Psychrobacter pacificensis sp. nov. International Journal of Systematic and Evolutionary Microbiology, 50(2): 835-846.
DOI:10.1099/00207713-50-2-835 |
Molloy S. 2014. Environmental microbiology:disentangling syntrophy. Nature Reviews Microbiology, 12(1): 7.
DOI:10.1038/nrmicro3194 |
Nemergut D R, Schmidt S K, Fukami T, O'Neill S P, Bilinski T M, Stanish L F, Knelman J E, Darcy J L, Lynch R C, Wickey P, Ferrenberg S. 2013. Patterns and processes of microbial community assembly. Microbiology and Molecular Biology Reviews, 77(3): 342-356.
DOI:10.1128/MMBR.00051-12 |
Pan H Q, Hu J C. 2015. Draft genome sequence of the novel strain Pseudomonas sp. 10B238 with potential ability to produce antibiotics from deep-sea sediment. Marine Genomics, 23: 55-57.
DOI:10.1016/j.margen.2015.05.003 |
Pedrós-Alió C. 2012. The rare bacterial biosphere. Annual Review of Marine Science, 4: 449-466.
DOI:10.1146/annurev-marine-120710-100948 |
Piontek J, Sperling M, Nöthig E M, Engel A. 2015. Multiple environmental changes induce interactive effects on bacterial degradation activity in the Arctic Ocean. Limnology and Oceanography, 60(4): 1392-1410.
DOI:10.1002/lno.10112 |
Pontarp M, Canbäck B, Tunlid A, Lundberg P. 2012. Phylogenetic analysis suggests that habitat filtering is structuring marine bacterial communities across the globe. Microbial Ecology, 64(1): 8-17.
DOI:10.1007/s00248-011-0005-7 |
Schloss P D, Westcott S L, Ryabin T, Hall J R, Hartmann M, Hollister E B, Lesniewski R A, Oakley B B, Parks D H, Robinson C J, Sahl J W, Stres B, Thallinger G G, Van Horn D J, Weber C F. 2009. Introducing mothur:open-source, platform-independent, community-supported software for describing and comparing microbial communities. Applied and Environmental Microbiology, 75(23): 7 537-7 541.
DOI:10.1128/AEM.01541-09 |
Shao L, Li X J, Geng J H, Pang X, Lei Y C, Qiao P J, Wang L L, Wang H B. 2007. Deep water bottom current deposition in the northern South China Sea. Science in China Series D:Earth Sciences, 50(7): 1 060-1066.
DOI:10.1007/s11430-007-0015-y |
Signori C N, Thomas F, Enrich-Prast A, Pollery R C G, Sievert S M. 2014. Microbial diversity and community structure across environmental gradients in Bransfield Strait, Western Antarctic Peninsula. Frontiers in Microbiology, 5: 647.
DOI:10.3389/fmicb.2014.00647 |
Singh R, Paul D, Jain R K. 2006. Biofilms:implications in bioremediation. Trends in Microbiology, 14(9): 389-397.
DOI:10.1016/j.tim.2006.07.001 |
Spring S, Scheuner C, Göker M, Klenk H P. 2015. A taxonomic framework for emerging groups of ecologically important marine gammaproteobacteria based on the reconstruction of evolutionary relationships using genome-scale data. Frontiers in Microbiology, 6: 281.
DOI:10.3389/fmicb.2015.00281 |
Sunagawa S, Coelho L P, Chaffron S, Kultima J R, Labadie K, Salazar G, Djahanschiri B, Zeller G, Mende D R, Alberti A, Cornejo-Castillo F M, Costea P I, Cruaud C, d'Ovidio F, Engelen S, Ferrera I, Gasol J M, Guidi L, Hildebrand F, Kokoszka F, Lepoivre C, Lima-Mendez G, Poulain J, Poulos B T, Royo-Llonch M, Sarmento H, Vieira-Silva S, Dimier C, Picheral M, Searson S, Kandels-Lewis S, Bowler C, de Vargas C, Gorsky G, Grimsley N, Hingamp P, Iudicone D, Jaillon O, Not F, Ogata H, Pesant S, Speich S, Stemmann L, Sullivan M B, Weissenbach J, Wincker P, Karsenti E, Raes J, Acinas S G, Bork P, Boss E, Bowler C, Follows M, Karp-Boss L, Krzic U, Reynaud E G, Sardet C, Sieracki M, Velayoudon D. 2015. Structure and function of the global ocean microbiome. Science, 348(6237): 1 261-1 359.
DOI:10.1126/science.1261359 |
Yoshida M, Yoshida-Takashima Y, Nunoura T, Takai K. 2015. Identification and genomic analysis of temperate Pseudomonas bacteriophage PstS-1 from the Japan trench at a depth of 7000 m. Research in Microbiology, 166(9): 668-676.
DOI:10.1016/j.resmic.2015.05.001 |
Zhang X M, Liu W, Schloter M, Zhang G M, Chen Q S, Huang J H, Li L H, Elser J J, Han X G. 2013. Response of the abundance of key soil microbial nitrogen-cycling genes to multi-factorial global changes. PLoS One, 8(10): e76500.
DOI:10.1371/journal.pone.0076500 |
Zhou J Z, Deng Y, Luo F, He Z L, Yang Y F. 2011a. Phylogenetic molecular ecological network of soil microbial communities in response to elevated CO2. mBio, 2(4): e00122-11.
DOI:10.1128/mBio.00122-11 |
Zhou J Z, Wu L Y, Deng Y, Zhi X Y, Jiang Y H, Tu Q C, Xie J P, Van Nostrand J D, He Z L, Yang Y F. 2011b. Reproducibility and quantitation of amplicon sequencingbased detection. The ISME Journal, 5(8): 1 303-1 313.
DOI:10.1038/ismej.2011.11 |