 2018, Vol. 36
Institute of Oceanology, Chinese Academy of Sciences
Article Information
- WANG Weicheng(王卫成), SUN Song(孙松), ZHANG Fang(张芳), SUN Xiaoxia(孙晓霞), ZHANG Guangtao(张光涛)
- Zooplankton community structure, abundance and biovolume in Jiaozhou Bay and the adjacent coastal Yellow Sea during summers of 2005-2012: relationships with increasing water temperature
- Chinese Journal of Oceanology and Limnology, 36(5): 1655-1670
- http://dx.doi.org/10.1007/s00343-018-7099-4
Article History
- Received Mar. 27, 2017
- accepted in principle Jul. 25, 2017
- accepted for publication Oct. 26, 2018


2 Jiaozhou Bay Marine Ecosystem Research Station, Chinese Academy of Sciences, Qingdao 266071, China;
3 University of Chinese Academy of Sciences, Beijing 100049, China;
4 Laboratory for Marine Ecology and Environmental Science, Qingdao National Laboratory for Marine Science and Technology, Qingdao 266071, China
Global warming is considered to be one of the most important factors for future changes in marine ecosystems (Mackas et al., 2012), and its effects are a fundamental area of research. Zooplankton are undoubtedly the most abundant metazoans on Earth, playing pivotal roles in the transfer of energy from primary producers and the microbial food web to upper trophic levels (Sherr and Sherr, 2009). Zooplankton also play an important role in biogeochemical cycles in the ocean (Dam et al., 1995). Because zooplankton are ectotherms with short life cycles that allow for fast response to stressors through phenotypic plasticity or evolutionary adaptation, they are considered as sentinels for the response of the oceanic biota to climate change (Hays et al., 2005; Dam, 2013).
In recent decades, scientific knowledge on marine ecosystem responses to global warming has significantly increased (Roemmich and McGowan, 1995; Wernberg et al., 2011; Lewandowska et al., 2014; Chiba et al., 2015), with many investigators finding that global warming could impact zooplankton community structure. In the Sevastopol Coast in the Black Sea, species richness of copepods decreased between 1976 and 1990, and community structure has changed as well due to the increasing of warm-water species Acartia tonsa and sharp decreasing of the cold-water species Pseudocalanus elongatus (Gubanova et al., 2001). In the Northeast Atlantic, the diversity of calanoid copepods has significantly increased due to increase of sea surface temperature (SST) in the western European basin (Beaugrand and Ibañez, 2002). During this process, zooplankton size also changed, with a shift in diversity as small warm water species were gained and larger cool water species were lost. Daufresne et al. (2009) proposed that long-term warming will result in a general decrease in the size of marine ectotherms by decreasing individual mean size and/or increasing abundance of smaller copepods species. Long-term data series are essential to understand such changes (Suikkanen et al., 2013).
Jiaozhou Bay is a eutrophic semi-enclosed bay situated in the western part of the Shandong Peninsula, China. It is surrounded by Qingdao City (population 9×10⁶), with an area of 374 km2 and an average water depth of about 7 m. The bay mouth narrows to 2.5 km and connects the bay with the South Yellow Sea, which is a traditionally productive fishing ground as well as a spawning and nursery area for local fish populations (Jin et al., 2010; Tang et al., 2016). Previous studies on zooplankton have mainly focused on spatial distribution and population dynamics (Zhang et al., 2009; Liu et al., 2011; Sun et al., 2011a; Wang and Sun, 2015), while their community structure has been studied only rarely. Because of individual body size was different across taxonomic groups and between various life stages of the same species, community composition assessments may differ between abundance and biovolume. Thus, combined consideration of abundance and biovolume together are recommended for assessing the zooplankton community (Dai et al., 2016a). Furthermore, studies describing the time variability of zooplankton in Jiaohzou Bay are of coarse even fewer and did not allow to evidence fluctuations at larger time scales. Considering the strategic situation of Jiaozhou Bay in northeast China (Zhang et al., 2015), the lack of long time series of zooplankton in the area motivated the present study.
Seawater temperature has a warming rate of 0.023℃/a between the 1960s and 2009 in Jiaozhou Bay, consistent with rising northern hemisphere temperature (NHT) (Sun et al., 2012). Similar trends have also been reported in adjacent coastal seas, such as the Bohai Sea (Lin et al., 2001; Ning et al., 2010) and Yellow Sea (Lin et al., 2005; Kang et al., 2007). In this study, we found that summer water temperature increased from 2005 to 2012 in Jiaozhou Bay and the adjacent coastal Yellow Sea. Given this trend, we sought to investigate the following objectives: (1) to study the summer zooplankton community structure in the northwestern Yellow Sea, and (2) to test whether changes observed in copepods are consistent with predictions of the effects of warming on ectotherms (Daufresne et al., 2009).
2 MATERIAL AND METHOD 2.1 Zooplankton samplingZooplankton samples were collected using vertical tows of a conical plankton net with total length of 140 cm, ring diameter of 31.6 cm and mesh size of 160 μm, from the demersal to the surface at two different sampling points. These included Station 5 (36°06′00″N, 120°15′00″E) in Jiaozhou Bay with an average depth of 15.4 m, and Station 10 (35°59′00″N, 120°25′30″E) in the coastal Yellow Sea in the vicinity of the mouth of Jiaozhou Bay with an average depth of 17.4 m. Samples were collected yearly in mid-August from 2005 to 2012 (Table 1, Fig. 1). After collection, samples were preserved immediately in 5% neutral formaldehyde seawater solution.


|
| Figure 1 Location of sampling stations 5 and 10 in Jiaozhou Bay and the coastal Yellow Sea |
At each station, vertical temperature and salinity profiles were recorded by a CTD instrument (CTG MiniPack CTD-F in 2005–2007, ALEC AAQ 1183- 1F CTD in 2008–2012). Column temperature and salinity means were obtained from surface, 5 m, 10 m and bottom measures. Chlorophyll a concentrations were determined fluorometrically using a Turner Designs model-10 fluorometer (Parsons et al., 1984) for seawater taken with a rosette sampler near the surface.
2.2 Zooplankton analysisPreserved zooplankton samples were subjected to image analysis using a semi-automatic ZooScan system (http://www.zooscan.com). In the laboratory, a fraction of each plankton sample was obtained with a Motoda box splitter (Motoda, 1959). Subsamples, usually between 1/4 and 1/64 of the original samples, were scanned in a scanning cell with a transparent frame (11 cm×24 cm) and digitized at 4 800 dpi following the scanning protocol (Schultes and Lopes, 2009). After processing the samples with ZooProcess, the detected objects were automatically classified according to a learning set, and corrections were made manually (Grosjean et al., 2004; Gorsky et al., 2010). By default, only objects having an equivalent spherical diameter (ESD) of >300 μm were detected and processed. Zooplankton taxonomic groups were identified through the ZooScan system. Based on this dataset, we divided total copepods into two different ESD-based body sizes, S1 (300-500 μm) and S2 (>500 μm).
Abundance (ind./m3) of total zooplankton in each taxonomic group was calculated using the following equation:
Abundance=number of zooplankton(splitting/net volume).
Zooplankton biovolume (mm3/m3) was calculated as follows:
Biovolume=volume of zooplankton individuals (splitting/net volume).
Zooplankton volume (mm3) for all taxa except Noctiluca scintillans was approximately equal to ellipsoidal volume, and was calculated as

while for Noctiluca, volume (mm3) was also determined assuming that the cells are spherical. This was calculated as
where the net volume can be obtained by multiplying the area of net mouth and the vertical distance that the net was towed, the Major, Minor and ESD (μm) of each object were provided by ZooScan.
2.3 Data analysisYearly differences in environmental variables (temperature, salinity and Chl α) were compared using one-way analysis of variance (ANOVA), and difference in variables between the two sampling stations were analysed by t-test.
Redundancy analysis (RDA) was used to assess relationships between zooplankton abundance and environmental variables, and was performed using CANOCO software version 5 (Microcomputer Power, USA). The zooplankton species data are analysed using detrended correspondence analysis (DCA) to identify the ordination methods (Hill and Gauch, 1980). If the maximum gradient length of the four axes is lower than 3, redundancy analysis (RDA) is recommended (Peng et al., 2012). Zooplankton abundance values and environmental variables were transformed as log(x+1) to stabilize variance and normalize data distributions.

|
| Figure 2 Vertical profiles of temperature and salinity at both sampling stations in August 2005–2012 Station 5: (a) and (b); station 10: (c) and (d). |
Linear regression was applied to evaluate the relationship between average total volume of copepods and water temperature.
3 RESULT 3.1 HydrographyBetween 2005 and 2012, temperature decreased relative to increasing depth at the two sampling stations (Fig. 2a, c). Surface temperature fluctuated between 25.1 and 28.0℃, and 23.9 and 26.5℃ at stations 5 and 10, respectively, and reached low points of 22.5 and 18.4℃ at bottom depth in 2005. Average water column temperature ranged from 23.3 to 26.4℃ (Fig. 3a), and 22.1 to 26.2℃ (Fig. 3c) at stations 5 and 10, respectively. Significant temperature differences among the years were clearly observed at both stations (ANOVA, station 5: P=0.003; station 10: P=0.05). The period of 2005–2012 exhibited an overall warming trend despite 2011 as an outlier. The year 2012 was the warmest year of the sampling period.

|
| Figure 3 Interannual variation in water column averaged temperature and salinity at both sampling stations in August 2005–2012 Station 5: (a) and (b); station 10: (c) and (d). Vertical bars show SE. |
Conversely, salinity increased with increasing depth (Fig. 2b, d). Salinity varied from 19.8 to 30.8, and 29.0 to 31.2 on the surface, and reached 28.1 and 29.2 at the bottom depth at stations 5 and 10, respectively. Average water column salinities ranged from 25.7 to 30.8 (Fig. 3b), and from 29.1 to 31.2 (Fig. 3d) at stations 5 and 10, respectively. Salinity also showed significant interannual variation (ANOVA, station 5: P=0.001; station 10, P < 0.001), with the lowest value in 2007, an increasing trend was only observed at station 5.
Chl α concentrations varied among years (Fig. 4), with a maximum in 2008 (station 5: 12.6 μg/L; station 10: 5.2 μg/L) and minima in 2009 at station 5 (0.7 μg/L) and in 2007 at station 10 (0.3 μg/L).

|
| Figure 4 Interannual variation in sea surface chlorophyll α (μg/L) at both sampling stations in August 2005–2012. |
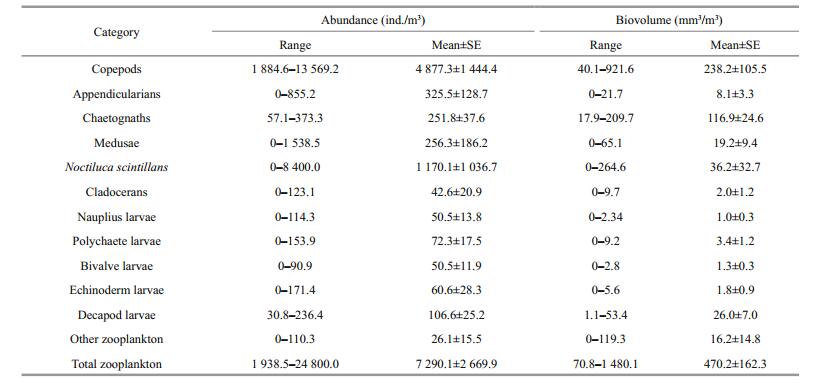
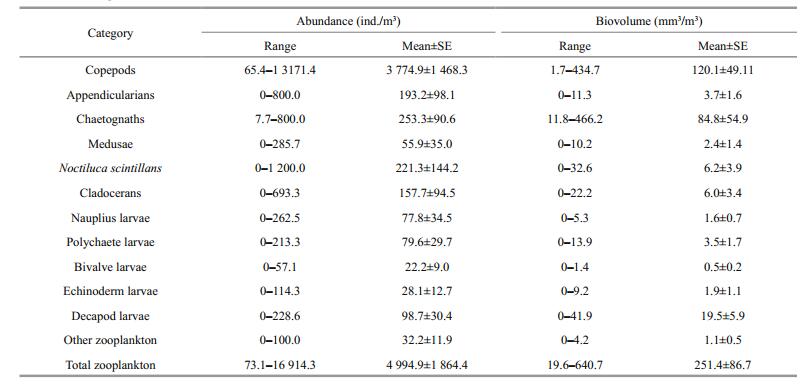
During the study period, zooplankton abundance and biovolume ranged from 1 938.5 to 24 800 ind./m3 and 70.8 to 1 480.1 mm3/m3 at station 5 and 73.1 to 16 914.3 ind./m3 and 19.6 to 640.7 mm3/m3 at station 10 (Tables 2, 3). Generally, both zooplankton abundance and biovolume at station 5, were higher than at station 10.
|
|
Twelve diverse zooplankton taxonomic groups were observed in total: appendicularians, bivalve larvae, chaetognaths, cladocerans, copepods, decapod larvae, echinoderm larvae, medusae, polychaete larvae, nauplius larvae, Noctiluca scintillans and other zooplankton (Figs. 5, 6). Copepods were the most abundant zooplankton group, comprising 66.9% of total abundance at station 5 and 75.6% at station 10, followed by N. scintillans (16.1%) at station 5 and chaetognaths (5.1%) at station 10. Appendicularians were the next most abundant group, comprising 4.5% at station 5 and 3.9% at station 10. Gelatinous zooplankton are generally considered to include appendicularians, chaetognaths and medusae, together accounting for 11.5% and 10.1% of the total abundance at stations 5 and 10, respectively. In this study, meroplankton comprised bivalve larvae, decapod larvae, echinoderm larvae and polychaete larvae, and accounted for 4.0% and 4.6% of the total abundance at stations 5 and 10. Copepods dominated zooplankton biovolume, making up 50.7% of the total at station 5 and 47.8% of the volume at station 10. These were followed by chaetognaths, making up 24.9% at station 5 and 33.7% at station 10, then N. scintillans at station 5 making up 7.7%, and decapod larvae at station 10 making up 7.8%.

|
| Figure 5 Relative abundance of zooplankton taxonomic groups averaged across all cruises at two sampling locations in late summer 2005–2012 a. station 5; b. station 10. |

|
| Figure 6 Relative biovolume of different zooplankton taxonomic groups averaged across all cruises at two stations in late summer 2005–2012 a. station 5; b. station 10. |
We observed year to year variability in the main groups of zooplankton (Figs. 7, 8), characterised by an overall decrease in abundance and biovolume for some groups from 2005 to 2012. This decrease was particularly evident in the populations of copepods, appendicularians and medusae, which clearly declined over the course of the study. Large population numbers (>4 900 ind./m3 for copepods, >250 ind./m3 for appendicularians and >200 ind./m3 for medusae) occurring in 2005–2007 did not reappear between 2008 and 2012 at either sampling station. N. scintillans also exhibited a decreasing trend with the largest cell density in 2005. Chaetognaths and meroplankton showed a fluctuation during the study period, while an increasing trend was observed in pluteus (53.3 ind./ m3 in 2006, 15.4 ind./m3 in 2008, 85.7 ind./m3 in 2011 and 137.9 ind./m3 in 2012) in Jiaozhou Bay. The highest abundance (114.3 ind./m3) of pluteus has been observed in 2011 in coastal Yellow Sea. Biovolume of each zooplankton group was correlated with its abundance, and exhibited a similar variability (Fig. 8).

|
| Figure 7 Interannual variability in abundance (ind./m3) of zooplankton groups in August 2005–2012 a. copepods; b. Noctiluca scintillans; c. appendicularians; d. chaetognaths; e. medusae; f. meroplankton. Left panel: station 5; right panel: station 10. |

|
| Figure 8 Interannual variability in biovolume (mm3/m3) of zooplankton groups in August 2005–2012 a. copepods; b. Noctiluca scintillans; c. appendicularians; d. chaetognaths; e. medusae; f. meroplankton. Left panel: station 5; right panel: station 10. |
RDA results are displayed in ordination plots for both stations (Fig. 9). At station 5, abundance of copepods, N. scintillans, bivalve larvae and decapod larvae were correlated negatively with water temperature, while echinoderm larvae were positively correlated with water temperature and Chl α. Medusae, appendicularians and polychaete larvae were negatively correlated with salinity. At station 10, medusae, appendicularians and N. scintillans were negatively related with salinity, and copepods, nauplius larvae, polychaete larvae, bivalve larvae and decapod larvae negatively associated with temperature.

|
| Figure 9 Biplot of zooplankton groups (response variables) and environmental factors (explanatory variables) on the space formed by the two first axis of the RDA for the data set of abundance Cope: copepods; Appe: appendicularians; Chae: chaetognaths; Medu: medusae; Noct: Noctiluca scintillans; Clad: cladocerans; Naup: nauplius larvae; Poly: polychaete larvae; Biva: bivalve larvae; Echi: echinoderm larvae; Deca: Decapod larvae; SAT: sea average temperature; SAS: sea average salinity; Chl α: chlorophyll α. Circles represent years from 2005 to 2012. a. station 5; b. station 10. |
In the case of copepods, the abundance of size rank S1 (300–500 μm) was generally higher than that of size rank S2 (>500 μm), and the abundances of both size ranks showed a decreasing trend at either station (Fig. 10). In addition, we found that the relative abundance of size rank S1 significantly increased, while that of size rank S2 significantly decreased at both sampling stations (Fig. 11). At the same time, the average volume of copepods decreased. A statistically significant relationship was found between the average volume of copepods and water temperature (station 5: R2=0.66, P=0.026; station 10: R2=0.54, P=0.032) (Fig. 12).

|
| Figure 10 Interannual variation in the abundance of two copepod size classes (S1: 300–500 μm and S2: >500 μm) in late summer 2005–2012 a. station 5; b. station 10. |

|
| Figure 11 Interannual variation in the abundance ratio of two size classes (S1: 300–500 μm and S2: >500 μm) in the abundance of total copepods in late summer 2005–2012 a. station 5; b. station 10. |

|
| Figure 12 Average volume (V, mm3) of copepods in relation to water column average temperature (T, ℃) in August from 2005 to 2012 a. station 5; b. station 10. |
The abundance and biovolume of zooplankton in Jiaozhou Bay and the adjacent Yellow Sea were calculated in this study. These values were consistently higher at station 5 than at station 10, and both were within range of the reported abundance and biovolume in the coast of South Yellow Sea (Dai et al., 2016b). The high abundance and low biovolume of zooplankton in the present study area, in comparison to geographically similar areas in the Northwest Pacific (Sato et al., 2015), indicates a dominance of small-sized species in the zooplankton community.
Our data provide basic information about the summer zooplankton community in the northwestern Yellow Sea. In both regions, copepods were the most abundant group, accounting for a large proportion of total zooplankton (66.9% and 75.6% at stations 5 and 10, respectively). Moreover, copepods also comprised about half of the total biovolume (50.7% and 47.8% at stations 5 and 10), which reflects their community dominance in this region. Our results are in the 50%– 80% range reported for copepods in many marine ecosystems (Wickstead, 1976). N. scintillans also made up considerable abundance, especially in Jiaozhou Bay (16.1%, Fig. 5a). We also found that chaetognaths ranked second in total biovolume, in keeping with previous reports by Ishizaka et al. (1997). In Jiaozhou Bay, copepods, N. scintillans and appendicularians were the top three dominant taxonomic groups based on abundance, while chaetognaths were a dominant taxonomic group based on biovolume. In the adjacent coastal Yellow Sea, copepods, chaetognaths and meroplankton dominate the zooplankton based on both abundance and biovolume. As evidenced by this ranking, meroplankton also occupied a very important position in the coastal ecosystem in summer, but have often been ignored in prior investigations.
4.2 The relationship between zooplankton community and water temperatureA decreasing inter-annual trend was observed in both zooplankton abundance and biovolume, reflected in the major taxa including copepods. Copepod abundance was negatively correlated with water temperature in both regions (Fig. 9), suggesting that a progressive depletion in zooplankton could be a response to the warming trend. Similar results were found during a 30-year study from 1959 to 1992 in the Bohai Sea (Tang et al., 2003). We also found that the proportion of small-sized copepods increased and the mean size of all copepods was reduced during our study period, in close relationship with temperature (Fig. 12). Our results were consistent with predictions of the effects of warming on ectotherms (Daufresne et al., 2009).
In Jiaozhou Bay and the adjacent coastal Yellow Sea, the summer copepod community was comprised mainly of a few species considered to be main secondary producers, including Paracalanus parvus, Acartia bifilosa, Acartia pacifica, Oithona brevicornis and Calanus sinicus (Sun et al., 2008). Many studies have found that the embryonic development and survival of C. sinicus are optimised below 20℃ (Huang and Zheng, 1986; Uye, 1988). During our study, water temperature in August was generally higher (Fig. 2a, c), likely affecting the growth and population of C. sinicus, Acartia, Oithona and Paracalanus. Copepods have also been shown lower abundance at warmer ambient temperature in laboratory experiments, particularly as adults (Garzke et al., 2015).
Noctiluca scintillans is a large-sized heterotrophic and omnivorous dinoflagellate, frequently blooms massively in spring and early summer in temperate coastal waters (Harrison et al., 2011). Many studies have reported that temperature is the limiting factor for the growth of N. scintillans in summer, and it was probably due to high water temperatures since its growth rate drastically decreased when water temperature above 25℃ (Huang and Qi, 1997; Tada et al., 2004; Dela-Cruz et al., 2008). N. scintillans in this study was negative correlated with water temperature (Fig. 9a), and the highest abundance was recorded with the lowest temperature in 2005 (Fig. 7b).
Gelatinous zooplankton are generally considered to include medusae, chaetognaths and appendicularians, comprising more than 10% of the total abundance in our studied areas (Fig. 5). Medusae are recognized as predators feeding mostly on microzooplankton, mesozooplankton and fish larvae. By analysing the distribution patterns of zooplankton functional groups in the South Yellow Sea, Shi et al. (2015) found that medusae were mainly distributed in coastal waters, concurrent with small copepods. Therefore, a decrease in copepod abundance may cause fluctuation in medusozoan populations. In our studied regions, Sagitta crassa is the only chaetognaths species occurring in summer (Sun et al., 2008; Wang et al., 2010), has a wide survival temperature and salinity range (0–28℃ and 9.3–48.7, respectively) (Liu et al., 2007), which includes the range in our study period. S. crassa mainly feeds on copepods and zooplankton larvae. In Jiaozhou Bay, the lowest feeding pressures of S. crassa on zooplankton biomass and production (0.08% and 2.48%) were recorded in summer (Wang et al., 2010), indicating food items were abundant for S. crassa. Thus, as shown in our results chaetognaths exhibited a fluctuation. Oikopleura dioica is the only appendicularian species that occurred (Sun et al., 2008), and can quickly respond to environmental change. For example, the lowest salinity during our study was observed in the summer of 2007 after heavy rains (270 mm in one day), coincident with a high abundance of appendicularians (Figs. 7c, 8c). Furthermore, we found that the abundance of appendicularians was negatively correlated with salinity over the course of the study (Fig. 9). Similar results have previously reported in other coastal waters. In the Seto Inland Sea, Japan, low salinity and nutrient-rich waters were introduced to the surface layer in the aftermath of typhoon rains, causing a bloom of appendicularians (Nakamura, 1998). Similarly, in southern Kaneohe Bay, Hawaii, appendicularians exhibited the most dramatic response to a major runoff event, with biomass increasing six-fold in one day (Hoover et al., 2006).
Meroplankton occupied a very important position in the coastal ecosystem, and was considered to be more sensitive than holozooplankton in response to climate change (Edwards and Richardson, 2004; Hays et al., 2005). In North Sea, an increased abundance of the larvae of a benthic echinoderm, Echinocardium cordatum, was recorded (Lindley and Batten, 2002). Kirby et al. (2007) proposed that warmer conditions in the North Sea after 1987, together with increased phytoplankton, may act synergistically to increase the reproduction output and population density of this species. In present study, an increasing abundance of pluteus (a larva of echinoderm) was registered, which was positive with water temperature and Chl a (Fig. 9a). In Jiaozhou Bay, increased temperature was reported, particularly in winter and spring (Sun et al., 2012); this would enhance individual fecundity and reduce mortality during the larval stage of echinoderm (Rumrill, 1990). In addition, the total abundance of phytoplankton increased from 1980s in Jiaozhou Bay (Sun et al., 2011b), which was considered to be important for the growth and development of the planktonic larvae of benthic echinoderms (Fenaux et al., 1994). In recent years, starfish blooms took place to cause severe damage in bivalve aquaculture in Jiaozhou Bay (Zhang et al., 2015). Thus, more attention should be given to meroplankton, such as echinoderm larvae.
It has been suggested that global warming selects for smaller organisms in marine systems (Daufresne et al., 2009; Forster et al., 2012; Garzke et al., 2015). Decreasing copepod size with increasing temperature, as seen in our study, has been previously reported under laboratory conditions (Garzke et al., 2015) and in the field (Suikkanen et al., 2013; Rice et al., 2015), with two possible explanations. First, small copepods exhibit high fecundity and growth rates when food supply is adequate at warmer temperatures (Turner, 2004). Generation time from egg to adult of Paracalanus sp. would be 21.8 days when raised at an average temperature of 15℃, with this duration decreasing as temperature increased (Uye, 1991). By this mechanism, the higher relative abundance of small-sized copepods in our study (Fig. 11) may be attributed to warmer temperatures in these years. This is keeping with a study in the South Yellow Sea, which found higher biomass of small copepods during warmer years (Shi et al., 2015). As an alternative explanation, a rise in temperature could reduce the average size of copepods. We found that the average volume of total copepods had a clear negative correlation with water temperature (Fig. 10a, b). This phenomenon can be explained by the temperature- size rule (TSR), which states that the individual body size of ectotherms tends to decrease with increasing temperature (Daufresne et al., 2009). It is confirmed that rates of growth and development in copepods are unequally affected by temperature, such that the rate of development increases more quickly with temperature than does growth rate (Lehman, 1988). Therefore, under warmer conditions, the adult stage is reached before the largest potential size is achieved (Forster and Hirst, 2012). For example, mean size of adult Acartia sp. decreased by 123 μm when raised at 17.5℃ instead of 9.5℃ (Garzke et al., 2015).
Apart from these direct effects, increasing temperature may have indirect effects on copepod size by affecting the quality of their food. Previous mesocosm studies have shown that mean cell size of phytoplankton decreased with temperature (Sommer and Lengfellner, 2008). Copepods feed selectively on > 10 μm food particles, and the degree to which herbivorous coastal copepods are food-limited may be strongly dependent on the structure of the phytoplankton assemblage (Dam and Peterson, 1991). In our study areas, the proportion of nano- phytoplankton (2–20 μm) compared to micro- phytoplankton (> 20 μm) has increased since the 1990s in significant correlation with rising water temperature, and nano-phytoplankton were dominant during our study period (Sun and Sun, 2012). This change in phytoplankton composition may favour smaller-sized copepods.
General decreases in zooplankton abundance and mean size of total copepods and an increase in the relative abundance of small-sized copepods in Jiaozhou Bay and the adjacent coastal Yellow Sea are in line with predictions regarding the impact of global warming on marine ecosystems (Daufresne et al., 2009; Garzke et al., 2015). Because of the southern Yellow Sea is a spawning and nursery area for local finfish populations (Jin et al., 2010; Tang et al., 2016), all of the abovementioned changes could disrupt fisheries by affecting predator-prey dynamics between larval fish and their primary copepod prey, particularly as most planktivorous fish are visual predators and select prey based on both type and size. This may, in turn, lead to ecological changes affecting community structure and ecosystem function such as secondary production and the flux of biogenic materials.
5 CONCLUSIONThe present study provides basic information on the zooplankton community over an 8-year period in relation to environmental variables in Jiaozhou Bay and the adjacent coastal Yellow Sea. In both areas, copepods were dominant based on both abundance and biovolume, followed by chaetognaths. In Jiaozhou Bay, N. scintillans occupied a more important role than in the Yellow Sea, where meroplankton were more prevalent. We identify a progressive decrease in zooplankton abundance over the study period, particularly in copepods. In addition, the proportion of small-sized copepods increased while the mean size of total copepods decreased, with the concurrent increase in water temperature likely driving these changes. Phenological change is also very common for zooplankton, such as copepods, is there any phenological change in our studied regions, and how long the species can adapt to global warming need more studies. Considering the limitations of time scales in this study, further long-term monitoring survey is recommended.
6 ACKNOWLEDGEMENTWe sincerely thank Dr. CHENG Fangping for help in identifying zooplankton of the training set, and ZHU Mingliang for helping with the ZooScan data analyses. We would like also to thank Dr. ZHOU Konglin for constructive comments on an earlier version of the manuscript. We are grateful for all the staff at the Jiaozhou Bay Marine Ecosystem Research Station for their valuable help with field work and collecting the samples.
Beaugrand G, Ibañez F. 2002. Spatial dependence of calanoid copepod diversity in the North Atlantic Ocean. Marine Ecology Progress Series, 232: 197-211.
DOI:10.3354/meps232197 |
Chiba S, Batten S D, Yoshiki T, Sasaki Y, Sasaoka K, Sugisaki H, Ichikawa T. 2015. Temperature and zooplankton size structure:climate control and basin-scale comparison in the North Pacific. Ecology and Evolution, 5(4): 968-978.
DOI:10.1002/ece3.2015.5.issue-4 |
Dai L P, Li C L, Wang S W, Wang Y Q, Zhang F. 2016b. Analysis of community structure of zooplankton in south Yellow Sea in summer with ZooScan. Oceanologia et Limnologia Sinica, 47(4): 764-773.
(in Chinese with English abstract) |
Dai L P, Li C L, Yang G, Sun X X. 2016a. Zooplankton abundance, biovolume and size spectra at western boundary currents in the subtropical North Pacific during winter 2012. Journal of Marine Systems, 155: 73-83.
DOI:10.1016/j.jmarsys.2015.11.004 |
Dam H G, Peterson W T. 1991. In situ feeding behavior of the copepod Temora longicornis:effects of seasonal changes in chlorophyll size fractions and female size. Marine Ecology Progress Series, 71: 113-123.
DOI:10.3354/meps071113 |
Dam H G, Roman M R, Youngbluth M J. 1995. Downward export of respiratory carbon and dissolved inorganic nitrogen by diel-migrant mesozooplankton at the JGOFS Bermuda time-series station. Deep Sea Research Part Ⅰ:Oceanographic Research Papers, 42(7): 1 187-1 197.
DOI:10.1016/0967-0637(95)00048-B |
Dam H G. 2013. Evolutionary adaptation of marine zooplankton to global change. Annual Review of Marine Science, 5: 349-370.
DOI:10.1146/annurev-marine-121211-172229 |
Daufresne M, Lengfellner K, Sommer U. 2009. Global warming benefits the small in aquatic ecosystems. Proceedings of the National Academy of Sciences of the United States of America, 106(31): 12 788-12 793.
DOI:10.1073/pnas.0902080106 |
Dela-Cruz J, Middleton J H, Suthers I M. 2008. The influence of upwelling, coastal currents and water temperature on the distribution of the red tide dinoflagellate, Noctiluca scintillans, along the east coast of Australia. Hydrobiologia, 598(1): 59-75.
DOI:10.1007/s10750-007-9140-z |
Edwards M, Richardson A J. 2004. Impact of climate change on marine pelagic phenology and trophic mismatch. Nature, 430(7002): 881-884.
DOI:10.1038/nature02808 |
Fenaux L, Strathmann M F, Strathmann R R. 1994. Five tests of food-limited growth of larvae in coastal waters by comparisons of rates of development and form of echinoplutei. Limnology and Oceanography, 39(1): 84-98.
DOI:10.4319/lo.1994.39.1.0084 |
Forster J, Hirst A G, Atkinson D. 2012. Warming-induced reductions in body size are greater in aquatic than terrestrial species. Proceedings of the National Academy of Sciences of the United States of America, 109(47): 19310-19 314.
DOI:10.1073/pnas.1210460109 |
Forster J, Hirst A G. 2012. The temperature-size rule emerges from ontogenetic differences between growth and development rates. Functional Ecology, 26(2): 483-492.
DOI:10.1111/j.1365-2435.2011.01958.x |
Garzke J, Ismar S M H, Sommer U. 2015. Climate change affects low trophic level marine consumers:warming decreases copepod size and abundance. Oecologia, 177(3): 849-860.
DOI:10.1007/s00442-014-3130-4 |
Gorsky G, Ohman M D, Picheral M, Gasparini S, Stemmann L, Romagnan J B, Cawood A, Pesant S, García-Comas C, Prejger F. 2010. Digital zooplankton image analysis using the ZooScan integrated system. Journal of Plankton Research, 32(3): 285-303.
DOI:10.1093/plankt/fbp124 |
Grosjean P, Picheral M, Warembourg C, Gorsky G. 2004. Enumeration, measurement, and identification of net zooplankton samples using the ZOOSCAN digital imaging system. ICES Journal of Marine Science, 61(4): 518-525.
DOI:10.1016/j.icesjms.2004.03.012 |
Gubanova A D, Prusova I Y, Niermann U, Shadrin N V, Polikarpov I G. 2001. Dramatic change in the copepod community in Sevastopol Bay (Black Sea) during two decades (1976-1996). Senckenbergiana Maritima, 31(1): 17-27.
DOI:10.1007/BF03042833 |
Harrison P J, Furuya K, Glibert P M, Xu J, Liu H B, Yin K, Lee J H W, Anderson D M, Gowen R, Al-Azri A R, Ho A Y T. 2011. Geographical distribution of red and green Noctiluca scintillans. Chinese Journal of Oceanology and Limnology, 29(4): 807-831.
DOI:10.1007/s00343-011-0510-z |
Hays G C, Richardson A J, Robinson C. 2005. Climate change and marine plankton. Trends in Ecology & Evolution, 20(6): 337-344.
|
Hill M O, Gauch Jr H G. 1980. Detrended correspondence analysis:an improved ordination technique. Vegetatio, 42(1-3): 47-58.
DOI:10.1007/BF00048870 |
Hoover R S, Hoover D, Miller M, Landry M R, DeCarlo E H, Mackenzie F T. 2006. Zooplankton response to storm runoff in a tropical estuary:bottom-up and top-down controls. Marine Ecology Progress Series, 318: 187-201.
DOI:10.3354/meps318187 |
Huang C, Qi Y. 1997. The abundance cycle and influence factors on red tide phenomena of Noctiluca scintillans(Dinophyceae) in Dapeng Bay, the South China Sea. Journal of Plankton Research, 19(3): 303-318.
DOI:10.1093/plankt/19.3.303 |
Huang J Q, Zheng Z. 1986. The effects of temperature and salinity on the survival of some copepods from Xiamen Harbour. Oceanologia et Limnologia Sinica, 17(2): 161-167.
(in Chinese with English abstract) |
Ishizaka J, Harada K, Ishikawa K, Kiyosawa H, Furusawa H, Watanabe Y, Ishida H, Suzuki K, Handa N, Takahashi M. 1997. Size and taxonomic plankton community structure and carbon flow at the equator, 175°E during 1990-1994. Deep Sea Research Part Ⅱ:Topical Studies in Oceanography, 44(9-10): 1 927-1 949.
DOI:10.1016/S0967-0645(97)00019-2 |
Jin X S, Zhang B, Xue Y. 2010. The response of the diets of four carnivorous fishes to variations in the Yellow Sea ecosystem. Deep Sea Research Part Ⅱ:Topical Studies in Oceanography, 57(11-12): 996-1000.
DOI:10.1016/j.dsr2.2010.02.001 |
Kang J H, Kim W S, Jeong H J, Shin K, Chang M. 2007. Why did the copepod Calanus sinicus increase during the 1990s in the Yellow Sea?. Marine Environmental Research, 63(1): 82-90.
DOI:10.1016/j.marenvres.2006.05.005 |
Kirby R R, Beaugrand B, Lindley J A, Richardson A J, Edwards M, Reid P C. 2007. Climate effects and benthic-pelagic coupling in the North Sea. Marine Ecology Progress Series, 330: 31-38.
DOI:10.3354/meps330031 |
Lehman J T. 1988. Ecological principles affecting community structure and secondary production by zooplankton in marine and freshwater environments. Limnology and Oceanography, 33(4): 931-945.
|
Lewandowska A M, Boyce D G, Hofmann M, Matthiessen B, Sommer U, Worm B. 2014. Effects of sea surface warming on marine plankton. Ecology Letters, 17(5): 614-623.
DOI:10.1111/ele.2014.17.issue-5 |
Lin C L, Su J L, Xu B R, Tang Q S. 2001. Long-term variations of temperature and salinity of the Bohai Sea and their influence on its ecosystem. Progress in Oceanography, 49(1-4): 7-19.
DOI:10.1016/S0079-6611(01)00013-1 |
Lin C, Ning X, Su J, Lin Y, Xu B. 2005. Environmental changes and the responses of the ecosystems of the Yellow Sea during 1976-2000. Journal of Marine Systems, 55(3-4): 223-234.
DOI:10.1016/j.jmarsys.2004.08.001 |
Lindley J A, Batten S D. 2002. Long-term variability in the diversity of North Sea zooplankton. Journal of the Marine Biological Association of the United Kingdom, 82(1): 31-40.
|
Liu M T, Li C L, Sun S. 2011. Seasonal variation in fatty acid composition of seston and the copepod Calanus sinicus(Brodsky, 1962) in Jiaozhou Bay and its trophic implications. Chinese Journal of Oceanology and Limnology, 29(6): 1 164-1 173.
DOI:10.1007/s00343-011-0275-4 |
Liu Q, Qu H, Zhang S. 2007. Preliminary studies on the tolerance to temperature and salinity in Sagitta crassa. Transactions of Oceanology and Limnology, (1): 111-116.
(in Chinese with English abstract) |
Mackas D L, Greve W, Edwards M, Chiba S, Tadokoro K, Eloire D, Mazzocchi M G, Batten S, Richardson A J, Johnson C, Head E, Conversi A, Peluso T. 2012. Changing zooplankton seasonality in a changing ocean:Comparing time series of zooplankton phenology. Progress in Oceanography, 97-100: 31-62.
DOI:10.1016/j.pocean.2011.11.005 |
Motoda S. 1959. Devices of simple plankton apparatus. Memoirs of the Faculty of Fisheries, Hokkaido University, 7(1-2): 73-94.
|
Nakamura Y. 1998. Blooms of tunicates Oikopleura spp. and Dolioletta gegenbauri in the Seto Inland Sea, Japan, during summer. Hydrobiologia, 385(1-3): 183-192.
|
Ning X R, Lin C L, Su J L, Liu C G, Hao Q, Le F F, Tang Q S. 2010. Long-term environmental changes and the responses of the ecosystems in the Bohai Sea during 1960-1996. Deep Sea Research Part Ⅱ:Topical Studies in Oceanography, 57(11-12): 1 079-1 091.
DOI:10.1016/j.dsr2.2010.02.010 |
Parson T R, Maita Y, Lalli C M. 1984. A Manual of Chemical and Biological Methods for Seawater Analysis. Pergamon Press, New York. p.3-122.
|
Peng S T, Qin X B, Shi H H, Zhou R, Dai M X, Ding D W. 2012. Distribution and controlling factors of phytoplankton assemblages in a semi-enclosed bay during spring and summer. Marine Pollution Bulletin, 64(5): 941-948.
DOI:10.1016/j.marpolbul.2012.03.004 |
Rice E, Dam H G, Stewart G. 2015. Impact of climate change on estuarine zooplankton:surface water warming in long island sound is associated with changes in copepod size and community structure. Estuaries and Coasts, 38(1): 13-23.
DOI:10.1007/s12237-014-9770-0 |
Roemmich D, McGowan J. 1995. Climatic warming and the decline of zooplankton in the california current. Science, 267(5202): 1 324-1 326.
DOI:10.1126/science.267.5202.1324 |
Rumrill S S. 1990. Natural mortality of marine invertebrate larvae. Ophelia, 32(1-2): 163-198.
DOI:10.1080/00785236.1990.10422030 |
Sato K, Matsuno K, Arima D, Abe Y, Yamaguchi A. 2015. Spatial and temporal changes in zooplankton abundance, biovolume, and size spectra in the neighboring waters of Japan:analyses using an optical plankton counter. Zoological Studies, 54(1): 18.
DOI:10.1186/s40555-014-0098-z |
Schultes S, Lopes R M. 2009. Laser Optical Plankton Counter and Zooscan intercomparison in tropical and subtropical marine ecosystems. Limnology and Oceanography:Methods, 7(11): 771-784.
DOI:10.4319/lom.2009.7.771 |
Sherr E, Sherr B. 2009. Understanding roles of microbes in marine pelagic food webs: a brief history. In: Kirchman D L ed. Microbial Ecology of the Oceans. 2nd edn. John Wiley & Sons Inc., New York. p.27-44.
|
Shi Y Q, Sun S, Zhang G T, Wang S W, Li C L. 2015. Distribution pattern of zooplankton functional groups in the Yellow Sea in June:a possible cause for geographical separation of giant jellyfish species. Hydrobiologia, 754(1): 43-58.
DOI:10.1007/s10750-014-2070-7 |
Sommer U, Lengfellner K. 2008. Climate change and the timing, magnitude, and composition of the phytoplankton spring bloom. Global Change Biology, 14(6): 1 199-1 208.
DOI:10.1111/j.1365-2486.2008.01571.x |
Suikkanen S, Pulina S, Engström-Öst J, Lehtiniemi M, Lehtinen S, Brutemark A. 2013. Climate change and eutrophication induced shifts in northern summer plankton communities. PLoS One, 8(6): e66475.
DOI:10.1371/journal.pone.0066475 |
Sun S, Li Y H, Sun X X. 2012. Changes in the small-jellyfish community in recent decades in Jiaozhou Bay, China. Chinese Journal of Oceanology and Limnology, 30(4): 507-518.
DOI:10.1007/s00343-012-1179-7 |
Sun S, Zhou K, Yang B, Zhang Y S, Ji P. 2008. Ecology of zooplankton in the Jiaozhoubay Ⅰ. species composition. Oceanologia et Limnologia Sinica, 39(1): 1-7.
(in Chinese with English abstract) |
Sun X H, Sun S, Li C L, Zhang G T. 2011a. Seasonal and spatial variability in egg production, abundance and production of small copepods in and near Jiaozhou Bay, China. Journal of Plankton Research, 33(5): 741-750.
DOI:10.1093/plankt/fbq135 |
Sun X X, Sun S, Wu Y L, Zhang Y S, Zheng S. 2011b. Longterm changes of phytoplankton community structure in the Jiaozhou Bay. Oceanologia et Limnologia Sinica, 42(5): 639-646.
(in Chinese with English abstract) |
Sun X X, Sun S. 2012. Phytoplankton size structure and its temporal and spatial changes in Jiaozhou Bay. Oceanologia et Limnologia Sinica, 43(3): 411-418.
(in Chinese with English abstract) |
Tada K, Pithakpol S, Montani S. 2004. Seasonal variation in the abundance of Noctiluca scintillans in the Seto Inland Sea, Japan. Plankton Biology & Ecology, 51(1): 7-14.
|
Tang Q S, Jin X S, Wang J, Zhuang Z M, Cui Y, Meng T X. 2003. Decadal-scale variations of ecosystem productivity and control mechanisms in the Bohai Sea. Fisheries Oceanography, 12(4-5): 223-233.
DOI:10.1046/j.1365-2419.2003.00251.x |
Tang Q S, Ying Y P, Wu Q. 2016. The biomass yields and management challenges for the Yellow sea large marine ecosystem. Environmental Development, 17(S1): 175-181.
|
Turner J T. 2004. The importance of small planktonic copepods and their roles in pelagic marine food webs. Zoological Studies, 43(2): 255-266.
|
Uye S I. 1988. Temperature-dependent development and growth of Calanus sinicus (Copepoda: Calanoida) in the laboratory. In: Boxshall G A, Schminke H K eds. Biology of Copepods. Springer, Dordrecht, Netherlands. p.285-293.
|
Uye S. 1991. Temperature-dependent development and growth of the planktonic copepod Paracalanus sp. in the laboratory. Bulletin of the Plankton Society of Japan, Special Volume: 627-636.
|
Wang Q, Sun S, Huo Y Z, Yang B. 2010. The ecology of chaetognaths in Jiaozhou Bay. Oceanologia et Limnologia Sinica, 41(4): 639-644.
(in Chinese with English abstract) |
Wang Y T, Sun S. 2015. Population dynamics of Aurelia sp.1ephyrae and medusae in Jiaozhou Bay, China. Hydrobiologia, 754(1): 147-155.
DOI:10.1007/s10750-014-2021-3 |
Wernberg T, Russell B D, Moore P J, Ling S D, Smale D A, Campbell A, Coleman M A, Steinberg P D, Kendrick G A, Connell S D. 2011. Impacts of climate change in a global hotspot for temperate marine biodiversity and ocean warming. Journal of Experimental Marine Biology and Ecology, 400(1-2): 7-16.
DOI:10.1016/j.jembe.2011.02.021 |
Wickstead J H. 1976. Marine Zooplankton. The Institute of Biology's Studies in Biology No. 62. Edward Arnold, London.
|
Zhang T W, Zhu L Y, Xu P P, Zhou H, Qi B J. 2009. Seasonal variation and distribution characteristics of Noctiluca scintillans in Jiaozhou Bay. Periodical of Ocean University of China, 39(S): 89-93.
(in Chinese with English abstract) |
Zhang Z H, Zhang X L, Xu Z J, Yao H Y, Li G, Liu X J. 2015. Emergency countermeasures against marine disasters in Qingdao City on the basis of scenario analysis. Natural Hazards, 75(S2): S233-S255.
DOI:10.1007/s11069-014-1332-z |