 2018, Vol. 36
Institute of Oceanology, Chinese Academy of Sciences
Article Information
- WU Renxie(吴仁协), ZHANG Haoran(张浩冉), LIU Jing(刘静), NIU Sufang(牛素芳), XIAO Yao(肖瑶), CHEN Yongxia(陈咏霞)
- DNA barcoding of the family Sparidae along the coast of China and revelation of potential cryptic diversity in the IndoWest Pacific oceans based on COI and 16S rRNA genes
- Chinese Journal of Oceanology and Limnology, 36(5): 1753-1770
- http://dx.doi.org/10.1007/s00343-018-7214-6
Article History
- Received Jul. 26, 2017
- accepted in principle Sep. 12, 2017
- accepted for publication Oct. 9, 2017


2 Laboratory of Marine Organism Taxonomy and Phylogeny, Institute of Oceanology, Chinese Academy of Sciences, Qingdao 266071, China;
3 College of Life Sciences, Hebei University, Baoding 071002, China
The family Sparidae (Teleostei, Percoidei) contains approximately 133 species in 36 genera (Shao, 2017). These are demersal fishes of continental shelf and slope and primarily inhabit the tropical and temperate coastal waters of Atlantic, Indian and Pacific oceans (Carpenter and Niem, 2001; Nelson, 2006). The sparid fishes are of considerable economic importance in marine fishery and aquaculture. In Chinese coastal waters, 4 genera of sparid fishes with approximately 19 species have been recorded from the Bohai Sea to the South China Sea, including a new record of Pagrus caeruleostictus and a new species Evynnis mononematos (Fan et al., 2011; Guan et al., 2012; Wu et al., 2012a; Chen et al., 2015a). Therefore, the species diversity of the family Sparidae in China is considered relatively high. However, because of convergent evolution and complicated speciation patterns (Chiba et al., 2009), similarities occur in the overall appearance within some taxa of sparids, particularly among species of the genusAcanthopagrus (Fan et al., 2011; Wu et al., 2012a). These similarities are challenging for accurate species identification and delimitation in the family Sparidae in China seas.
Several studies have been conducted on the phylogenetic relationships and species identification for sparid fishes in China using the mitochondrial cytochrome b (Cyt b) sequence and random amplified polymorphic DNA (RAPD) markers (reviewed in Fan et al., 2011). However, small sample sizes (e.g., there were only 5 species in the RAPD study by Yang and Jiang, 2006), limited sampling scale (e.g., four species of sparid fishes were all sampled from Zhoushan sea in Cyt b analysis, Xu et al., 2010) and inaccurate sample source of sampling designs (e.g., Xia (2007) used Cyt b sequences derived from NCBI for species identification, but their sample sources were unknown) prevented these studies from reaching more robust conclusions. Recently, the validity of Acanthopagrus schlegelii distributed in Chinese coastal waters was confirmed by mitochondrial cytochrome oxidase subunit І (COI) and control region sequences (Wu et al., 2012a), although this species was reported indistinguishable from Acanthopagrus sivicolus in the coastal waters of Taiwan Island based on Cyt b sequence analysis (Hsu et al., 2011). The molecular phylogeny of the sparids from China seas was also studied using the COI sequence (Chen et al., 2015b). However, analyses of a barcoding gap and genetic threshold from these studies for the purpose of species delimitation are still lacking. The barcoding gap refers to the separation between mean intra- and interspecific sequence variability, and the accuracy of genetic threshold is critically dependent on the extent of the species barcoding gap (Meyer and Paulay, 2005). These two conceptions have been stressed to be of paramount importance for species delimitation and examining species boundaries (Meier et al., 2008; Knebelsberger et al., 2014; Cardoni et al., 2015). Therefore, although the substantial progress achieved in the previous reports, some genetic problems concerning species delimitation in sparid fishes remain unaddressed. Accordingly, a comparable and standardized DNA barcoding approach is required to identify and delimit sparid species on the coast of China.
DNA barcoding, using a universal gene region and a routine analytical procedure, has greatly promoted the identification of species and the discovery of new species in a wide variety of animal taxa (Hebert et al., 2003a, b, 2004a, b; Ward et al., 2005; Hajibabaei et al., 2006). For most animals, the COI gene is recommended as the standard barcoding marker, and the distance and tree-based methods are suggested as classical barcoding analysis processes (Hebert et al., 2003b; Ward et al., 2005; Ratnasingham and Herbert, 2007). Based on COI barcoding, high rates of specieslevel identification are well documented in many animal species, such as 95.27% for northwestern Pacific molluscs (Sun et al., 2016), ca. 98% for marine fishes and 93.6% for birds (Ward, 2009), with increases in species diversity also revealed in many regions (Ward et al., 2008; Zemlak et al., 2009; Puckridge et al., 2013). However, some complicating problems concern the use of COI barcoding, such as the hybridization and introgression of species and the discrimination of recently differentiated species (Moritz and Cicero, 2004; Ward et al., 2005, 2009), with these problems considered major challenges for COI barcoding in fishes (Ward et al., 2009). Thus, additional mitochondrial markers (e.g., 16S ribosomal RNA, 16S; NADH dehydrogenase 2, NADH2) and nuclear markers should be considered as candidate barcodes (Bhattacharya et al., 2016). As a conserved gene, the 16S sequence can exactly measure the true divergences among remotely related species and can be readily amplified and sequenced across various animals (Lakra et al., 2009; Ma et al., 2013, 2015). It has been effectively applied to discriminate different species for many animals, including Zoantharia (Sinniger et al., 2008), hydrozoans (Zheng et al., 2014), fishes (Wu et al., 2011; Lee et al., 2014), and amphibians (Vences et al., 2005). Recently, 16S has been used as the supplement of new species descriptions to review the genus Acanthopagrus of sparid fishes (Iwatsuki, 2013), which successfully implemented the species identification in the Acanthopagrus latus complex, indicating its potential power of species delineation and taxonomy in the sparid fishes.
Given these considerations, we first used both COI and 16S genes as DNA barcodes in the sparid species identification from Chinese coastal waters and assessed the barcoding gap and genetic threshold for species delimitation. Second, we employed the detected genetic threshold to reveal the potential cryptic species of sparids in the Indo-West Pacific region, because this area is known to have the richest diversity of many marine organisms including the studied taxa. This study contributes significantly to the use of DNA barcoding for species delimitation in the family Sparidae and provides insights into the species diversification and for the biodiversity conservation of the sparid fishes in the Indo-West Pacific region.
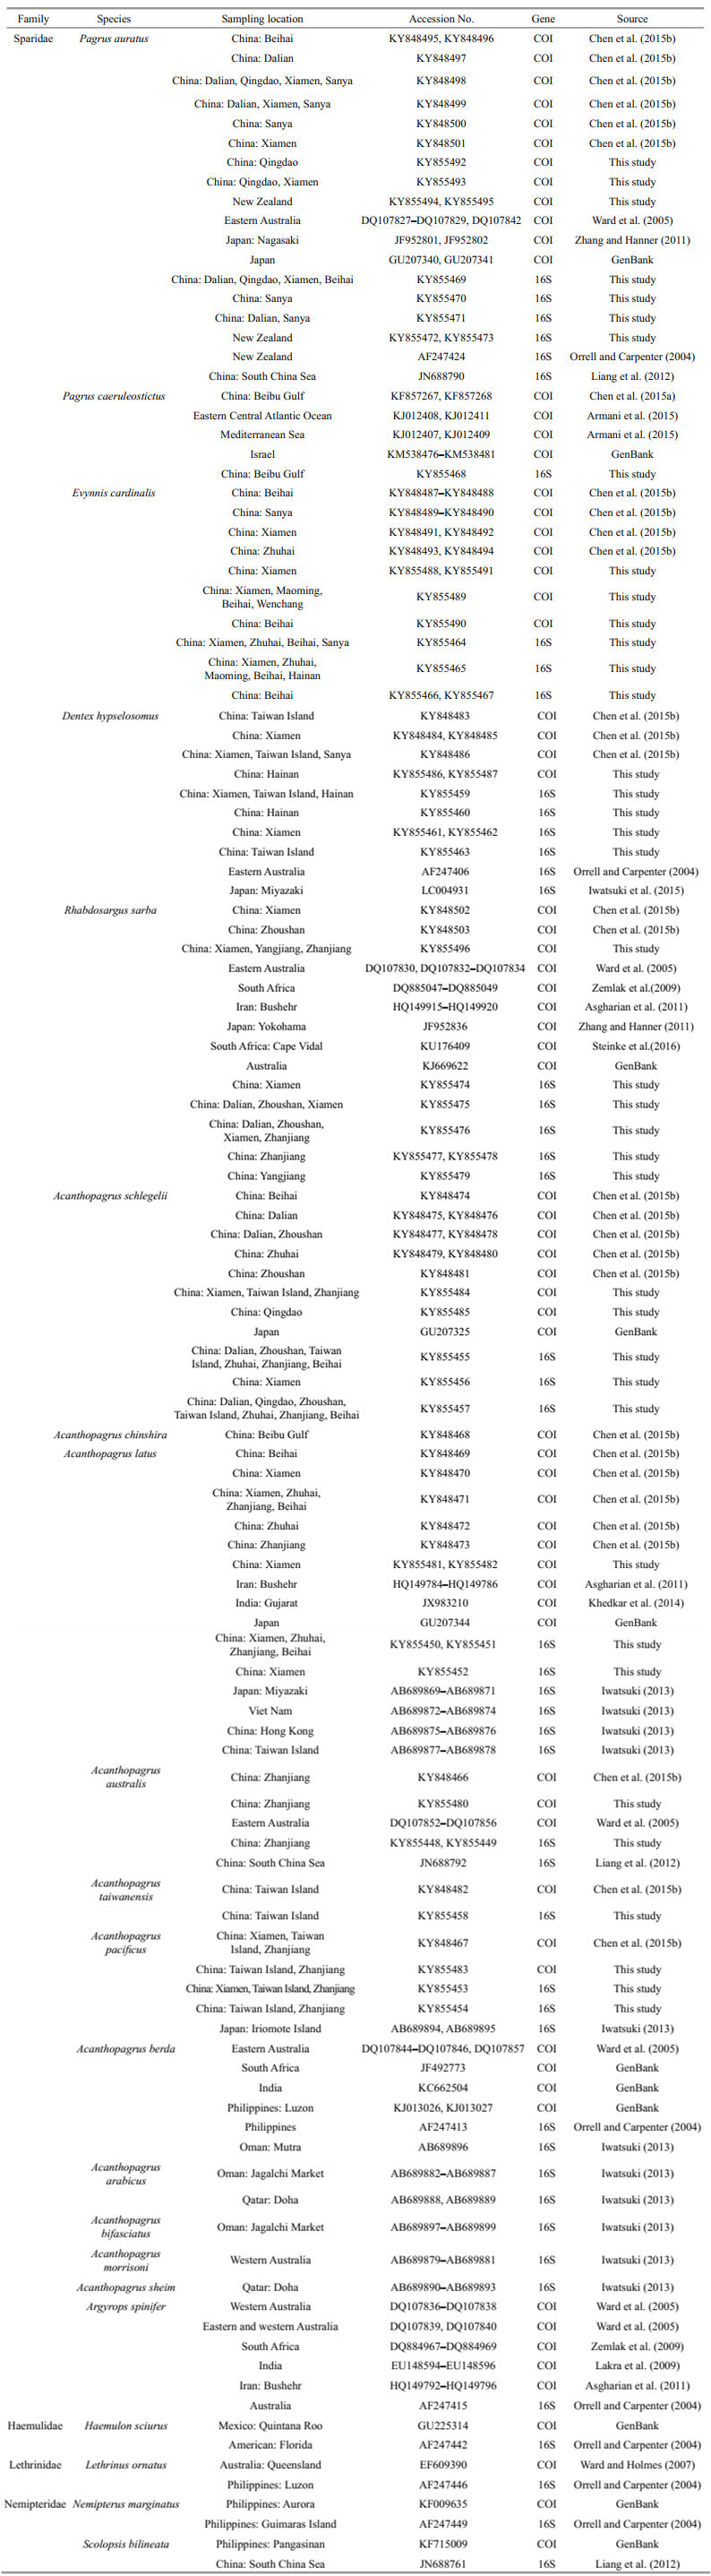
2 MATERIAL AND METHOD 2.1 Specimen collection and species identificationA total of 124 specimens of 11 species under 5 genera in the family Sparidae were collected by bottom otter trawls along the coast of China or purchased from local fishermen from August 2012 to May 2015. Additionally, four Pagrus auratus specimens collected in New Zealand were also included in this study. The detailed information for all 128 specimens is listed in Table 1. All specimens were preliminary identified by co-authors during the field sampling period and then validated based on the currently published taxonomic literature (Paulin, 1990; Iwatsuki et al., 2007; Iwatsuki, 2013; Chen et al., 2014; Liu et al., 2016). Dorsal muscle tissue was dissected from each fresh specimen and preserved in 75%‒95% alcohol at -20℃ for further molecular assays. When possible, voucher specimens were saved and deposited at Guangdong Ocean University and Hebei University. Approximately 84 COI sequences (defined 40 haplotypes, GenBank accession numbers: KF857267, KF857268, KY848466–KY848503, Table 1) used in this study derived from our earlier work (Chen et al., 2015a, b), and the other 44 COI sequences and the 127 16S sequences (one contaminated specimen of DNA was discarded) were newly sequenced in this study.
|
Total genomic DNA was extracted from muscle using the standard phenol-chloroform method (Sambrook and Russell, 2001). The partial mitochondrial 16S gene sequence was amplified by polymerase chain reaction (PCR) with the AR and BR primers (Palumbi, 1996). The standard DNA barcode sequence of the 5' region of the mitochondrial COI gene was amplified from two universal combinations of fish-specific primers: FishF1 and FishR1, FishF2 and FishR2 (Ward et al., 2005). The PCR was conducted in 50 μL volumes containing 20–50 ng of extracted DNA, 5 μL of 10× reaction buffer, 1.5 mmol/L MgCl2, 200 μmol/L dNTP mixture, 0.2 μmol/L each primer, and 2.5 units of Taq DNA polymerase (Transgen Biotech Co., Ltd., Beijing, China). The PCR amplifications were performed on a VeritiTM96-Well Thermal Cycler (Applied Biosystems, USA) under the following conditions: an initial denaturation at 95℃ for 4 min, followed for 35 cycles of 95℃ for 45 s, 50℃ for 45 s, 72℃ for 45 s, and a final extension at 72℃ for 10 min. All sets of PCR amplifications included a negative control reaction tube in which all reagents were included, except the template DNA. PCR products were separated on 1.2% agarose gel, and good PCR products were sent to Sangon Biotech Co., Ltd. (Shanghai, China) for DNA sequencing with the PCR primers by an ABI Prism 3730 automatic sequencer (Applied Biosystems, USA).
2.3 Genetic divergences, barcoding gap and neighbour-joining tree analysesThe raw sequences were initially visualized on the chromatogram and then edited with the program EditSeq V7.1.0 (Lasergene, DNASTAR) to ensure sequencing quality. Sequences were aligned using the program MegAlign V7.1.0 (Lasergene, DNASTAR) based on the ClustalW algorithm with the default settings. Haplotypes of COI and 16S genes for each species were generated by Dnasp5.10.01 software (Librado and Rozas, 2009) and directly submitted to GenBank. The sequence variation indices, including the number of polymorphic sites, base composition, transition/transversion ratios (R) and indels, were analysed using the MEGA V6 program (Tamura et al., 2013).
Based on the Kimura-2 parameter (K2P) model, we conducted genetic distance, barcoding gap and tree-based species monophyly analyses in this study to investigate species delimitation of the family Sparidae; these methods are recommended for a standard analysis process in DNA barcoding studies (Hebert et al., 2003a, b; Ward et al., 2005; Meyer and Paulay, 2005). Genetic distances between any two haplotypes, including intraspecies, interspecies and intergeneric, were determined in MEGA V6. The occurrence of a barcoding gap for each species was then calculated as the difference between the minimum interspecific distance and the maximum intraspecific distance (Meier et al., 2008; Cardoni et al., 2015). For evaluation of species reciprocal monophyly, the neighbour-joining (NJ) tree with bootstrap analysis (1 000 replicates) was performed using MEGA V6. Additionally, the nucleotide variance rates within congeneric species were also compared between COI and 16S genes in this study.
2.4 Barcode lineage pattern analyses in the collective data setTo assess barcode discrimination and reveal cryptic diversity, we integrated both COI and 16S sequences of the studied species from other geographic regions and of other species in the same genus from the published data (Table 1). Thus, a collective data set of 126 COI haplotypes and 70 16S haplotypes from the Indo-West Pacific oceans was created. In this data set, the two kinds of gene haplotypes were obtained from different species and the sequence sources of these two genes in the same species were also different. Therefore, each gene haplotypes were analysed separately in this study rather than the combined together.
Sequence divergence among geographic individuals was calculated for each conspecific with the K2P model. Phylogenetic relationships among the sparid species of collective sequences were reconstructed by NJ and Maximum-Likelihood (ML) trees. The evolution models of the collective sequences were evaluated using Akaike information criteria (AIC) tests implemented by jModelTest V2.1.10 (Darriba et al., 2012). The NJ and ML trees were constructed in Phylip version 3.6 (Felsenstein, 2002) and MEGA V6 with 1 000 bootstrap replicates, respectively, based on the best-fit evolution model with a gamma shape parameter (16S: K2P+I+G, I=0.402 2, G=0.745 3; COI: HKY+I+G, I=0.606 3, G=1.670 2) given from jModelTest. The closely related to sequences in collective dataset of four species, Haemulon sciurus, Lethrinus ornatus, Nemipterus marginatus and Scolopsis bilineata, from GenBank were used as out-groups (Table 1). According to Hubert et al. (2012), four COI lineage patterns are found in the Indo-Pacific coral reef fishes: shallow spatial structure (Pattern 1), geographic monophyly (Pattern 2), geographic paraphyly (Pattern 3), and taxonomic paraphyly or polyphyly (Pattern 4). Correspondingly, we used them to determine the pattern of barcode lineage of each sparid species with the Indo-West Pacific region distribution in this study.
3 RESULT 3.1 Sequence variationFor the COI gene, a total of 44 specimens were newly sequenced with the sequence length from 627 to 655 bp, which defined 17 haplotypes (GenBank accession numbers: KY855480–KY855496, Table 1). Combined with the 40 previously defined COI haplotypes, a total of 57 COI haplotypes of 11 species of Sparidae were analysed in this study. After multiple sequence alignments, the consensus sequences of the COI gene were 603 bp (excluding primer region), encoding 201 amino acids. The average content of A, T, C and G was 23.1%, 30.4%, 27.4% and 19.1%, respectively, which showed AT bias (53.5%) and antiguanine bias. The G+C content (46.5%) differed among three codon positions, with 56.4% in the first, 44.3% in the second and 38.6% in the third position. Of the 603 sites, 192, 184 and 8 were variable, parsimony informative and singleton sites, respectively. Transitional pairs (si=53) were more frequent than transversional pairs (sv=20) with the mean si/sv ratio of 2.68.
The only DNA specimen of Acanthopagrus chinshira was contaminated and therefore was discarded. The remaining 127 specimens of 10 species of Sparidae were sequenced in the 16S gene with lengths that ranged from 549 to 579 bp, defining 32 haplotypes (GenBank accession numbers: KY855448–KY855479, Table 1). A few insertions or deletions were found on the 558 bp consensus sequences, which primarily occurred in the regions of 281‒295 bp and 363‒429 bp. The mean content of A, T, C and G was 29.4%, 21.7%, 25.3% and 23.7%, respectively, which showed an obvious bias for adenine but not an anti-guanine bias. Of the 558 sites, a total of 101 variable sites were found, containing 92 parsimony informative sites and 9 singleton sites. As expected, transitions (si=25) were more common than transversions (sv=10), and the overall si/sv ratio was 2.53.
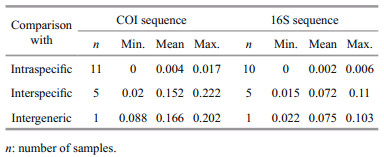
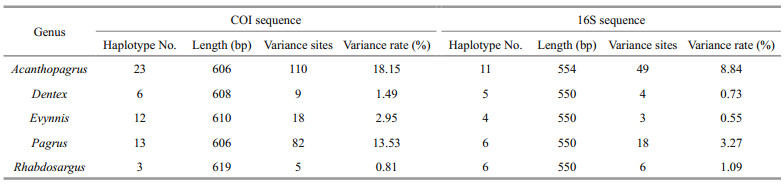
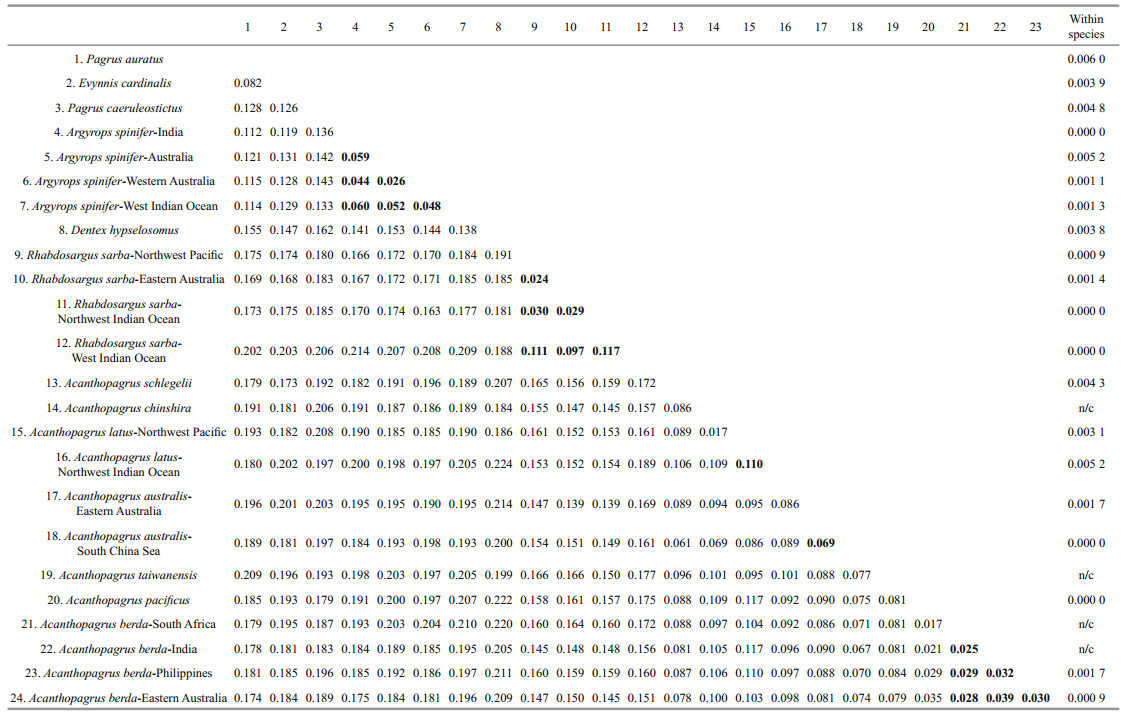
3.2 DNA barcodingFor the COI sequence of 11 sparid species, the intraspecific, interspecific and intergeneric distances ranged from 0.000 to 0.017 (mean=0.004, same as below), 0.020 to 0.222 (0.152), and 0.088 to 0.202 (0.166) (Table 2), respectively, based on the K2P genetic model. These distances showed that the degree of genetic divergence increased progressively with the increase in taxonomic level of taxa. This relation was also detected for the 16S sequence of 10 sparid species, with intraspecific, interspecific and intergeneric distances ranging between 0.000 and 0.006 (0.002), 0.015 and 0.110 (0.072), and 0.022 and 0.103 (0.075) (Table 2), respectively. The average interspecific divergence of COI and 16S was respectively 38-fold and 36-fold higher than their mean intraspecific distance. The nucleotide variance rates of COI within congenerics were approximately 2‒5-fold higher than those of 16S, except for the genus Rhabdosargus (one species, Rhabdosargus sarba), which had a slightly lower variance rate in COI than in 16S (Table 3).
|
|
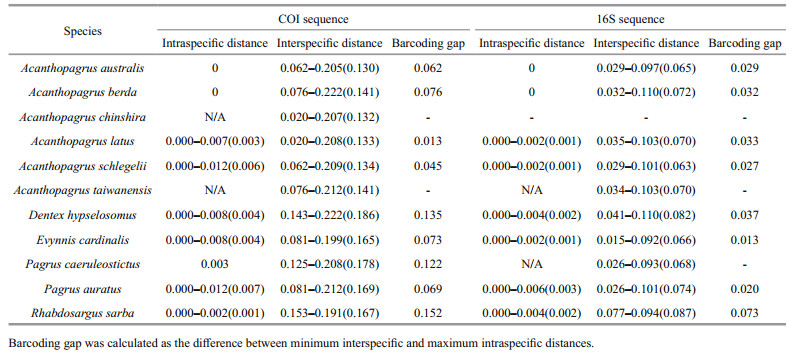
As shown in Table 4, for both COI and 16S, intraspecific variation was notably less than, and did not overlap with, interspecific variation, indicating that an obvious barcoding gap (range 0.013‒0.152 for COI; range 0.013‒0.073 for 16S) occurred in each species. These results showed that a common genetic threshold of divergence value could be defined for unambiguous discrimination of the sparid species, i.e., a 1.3% cutoff for both COI and 16S sequences. The COI barcoding gap of each species was obviously greater (1.7‒5.6-fold) than the 16S barcoding gap, except for Acanthopagrus latus, which had a lower COI barcoding gap (0.013) that was largely due to the low COI genetic distance between A. latus and A. chinshira (0.020) (Table 4). In the NJ analysis, all the conspecific individuals formed monophyletic clusters with high support (93%‒100%) for both COI and 16S genes (Figs. 1, 2), which indicated the utility of both markers to provide species-level resolution.
|

|
| Figure 1 Neighbour-joining tree (K2P distance) of 11 sparid species based on 57 haplotypes of the COI gene Numbers above the branches represent bootstrap values with 1 000 replications, only values over 70% are shown. |

|
| Figure 2 Neighbour-joining tree (K2P distance) of 10 sparid species based on 32 haplotypes of the 16S rRNA gene Numbers above the branches represent bootstrap values with 1 000 replications, only values over 70% are shown. |
Since NJ and ML analyses yielded trees with the same topology, and the bootstrap values of each branch of the two trees were approximately equal, only the NJ tree of each gene was shown in this study (Figs. 3, 4). In the thirteen sparid species (126 COI haplotypes), excluding two species with one haplotype (A. chinshira and Acanthopagrus taiwanensis), six species including Pagrus auratus, P. caeruleostictus, Evynnis cardinalis, Dentex hypselosomus, A. schlegelii and Acanthopagrus pacificus exhibited shallow spatial structures (Pattern 1; Fig. 3), and their intraspecific variation (0.000 0‒0.006 0, Table 5) was significantly lower than the 1.3% genetic threshold. However, five other norminal species Argyrops spinifer, Rhabdosargussarba, A.latus, Acanthopagrus australis and Acanthopagrus berda showed very clear geographic differentiation (Patterns 3, 4; Fig. 3), and their deep intraspecific divergences (0.024‒0.117, Table 5) were obviously higher than the 1.3% genetic threshold. For Ar. spinifer, four distinct lineages corresponded to the four geographic regions which are India, western Australia, eastern and western of Australia, and the west Indian Ocean (South Africa and Iran) (Pattern 3). The genetic divergence among the lineages ranged from 0.026 to 0.060. For R. sarba, two closely related lineages (eastern Australia, China and Japan) were restricted to the west Pacific, whereas two other very divergent lineages (Iran, South Africa) were found in the West Indian Ocean (Pattern 3). These four lineages diverged by 0.024 and up to 0.117. Moreover, the lineages of A. australis between eastern Australia and the South China Sea diverged by 0.069 (Pattern 3). By contrast, two distinct lineages were detected in A. latus separated by 0.110, but the northwest Pacific lineage (China and Japan) of A. latus was more closely related to A. chinshira (diverging by 0.017) from the Beibu Gulf (South China Sea) than its conspecifics from the northwest Indian Ocean (Iran and western India) (Pattern 4). Among the four lineages of A. berda (diverging by 0.025 and up to 0.039), the South Africa lineage first clustered with A. pacificus from the East and South China seas, whereas the other three lineages were distributed in India, Philippines and eastern Australia (Pattern 4).

|
| Figure 3 Neighbour-joining tree (HKY+I+G model, I=0.606 3, G=1.670 2) of sparid species with Indo-West Pacific range distribution based on 126 haplotypes of the COI gene Numbers above the branches represent bootstrap values with 1 000 replications, only values over 70% are shown. |

|
| Figure 4 Neighbour-joining tree (K2P+I+G model, I=0.402 2, G=0.745 3) of sparid species with Indo-West Pacific range distribution based on 70 haplotypes of the 16S rRNA gene Numbers above the branches represent bootstrap values with 1 000 replications, only values over 70% are shown. |
|
In the sixteen sparid species (70 16S haplotypes), excluding three species with one haplotype (A. taiwanensis, Ar. spinifer, P. caeruleostictus), eleven species including P. auratus, E. cardinalis, R. sarba, A. schlegelii, A. pacificus, A. latus, A. australis, Acanthopagrus morrisoni and Acanthopagrus sheim showed a lack of spatial differentiation (Pattern 1; Fig. 4) with their low intraspecific variation (0.000 0‒0.005 6, Table 6) (< 1.3% genetic threshold). However, two other norminal species A. berda and D. hypselosomus were differentiated geographically (Patterns 3, 4; Fig. 4), with high levels of intraspecific divergences (Table 6, 0.034 > 1.3% genetic threshold). Similar to the COI, the 16S lineages of A. berda also showed taxonomic paraphyly (Pattern 4). The Philippines lineage of A. berda was more closely related to A. pacificus from the northwest Pacific (China and Japan) (diverging by 0.014) than to the conspecific from the Indian Ocean (Oman) (diverging by 0.034). In D. hypselosomus, two distinct lineages diverging by 0.034 were detected within the west Pacific (Pattern 3), with one only found in eastern Australian, whereas the other was widely distributed in the northwest Pacific (China and Japan).

|
The utility of DNA barcoding relies on the principle that interspecific divergence is higher than intraspecific variation, which has been confirmed for a wide range of taxa (Hebert et al., 2003a, b, 2004a, b; Ward et al., 2005; Hajibabaei et al., 2006). Hebert et al. (2004b) proposed that the average interspecific divergence should be approximately 10-fold higher than the average intraspecific variation (the so-called 10-fold rule). However, the intraspecific variation generally increases with greater sampling intensity and larger sampling scales, and interspecific divergences decrease with the addition of closely related species (Dasmahapatra and Mallet, 2006). Accordingly, an overlap could occur between intra- and interspecific variation, leading to ineffective DNA barcoding (Meyer and Paulay, 2005). In this case, the species reciprocal monophyly is constructed by DNA barcoding sequences, which is considered an alternative approach to replace the genetic distance analysis (Ward, 2009). The DNA barcoding based on distance and phylogenetic tree methods is a demonstrated efficient and reliable approach for species discrimination.
Compared with the interspecific distance (0.000‒0.241 8, 0.081 1) of COI barcoding reported in many fishes (Ward et al., 2005, 2009), the interspecific divergence in our COI sequences (0.020‒0.222, 0.152) showed great variability, which indicated that COI is a useful marker for species diagnosis in the family Sparidae. In this study, although the degree of genetic variation in 16S was generally lower than that in COI, our average interspecific divergence of 16S (0.072) was comparable to that of COI reported in other fishes (e.g., 0.074 8 for 210 Australasian chondrichthyan species, 0.070 8 for 35 Cyprinidae fishes, and 0.065 9 for 45 perch-like fishes) (Ward et al., 2008; Shen et al., 2016; Turanov et al., 2016). This considerable variability in our 16S suggested that this marker is also a promising tool for species identification in the family Sparidae. Indeed, 16S has been successfully applied to assist in the discovery of three new Acanthopagrus species (Iwatsuki, 2013) and one new Symphurus species (Lee et al., 2014) and in distinguishing the valid species within the Trichiurus lepturus complex (Wu et al., 2011). Moreover, the level of interspecific divergence obtained for COI and 16S were respectively 38-fold and 36-fold higher than the intraspecific distance in the studied taxa, which were notably higher than the '10-fold rule', indicating the robust taxonomic resolution in both markers. In the phylogenetic NJ trees, both COI and 16S showed 100% success in species discrimination with high bootstrap support, providing support that each species was a distinct monophyletic cluster. This result is consistent with the high species discrimination rates (ca. 98%) in other marine fishes barcoding studies (Ward et al., 2005, 2009; Knebelsberger et al., 2014). Based on the above analyses, both COI and 16S barcodes clearly have high efficacy for species discrimination in the sparid fishes.
4.2 Barcoding gap and the genetic threshold for sparid species delimitationSince the development of DNA barcoding, the criteria for setting the genetic threshold for species delimitation have been established by several researchers. However, controversy remains about what threshold should be applied to distinguish species (Meyer and Paulay, 2005; Meier et al., 2008; Knebelsberger et al., 2014). In early barcoding studies, Hebert et al. (2003b) used a 2% COI divergence as a threshold for species diagnosis, and also recommended a standard threshold of the 10-fold rule to identify new animal species (Hebert et al., 2004b). Given that the mean intraspecific distances were 0.4% COI and 0.2% 16S sequence divergences in this study, neither the 2% genetic threshold nor the 10-fold rule applied (corresponding genetic threshold of 4% COI and 2% 16S for our data), because the established threshold values were significantly higher than several detected interspecific distances in the sparid species. Thus, to guide the species delimitation of sparids, these criteria could not be applied. Alternatively, Meyer and Paulay (2005) defined the separation between mean intraspecific and mean interspecific variation as the barcoding gap, with the difference used as the basis for setting the genetic threshold. This approach set a greater threshold of 14.8% COI and 7% 16S divergences in our data, which indicated that using mean interspecific distance could artificially inflate the barcoding gap and lead to misidentification (Meier et al., 2008). Therefore, the mean genetic distance was also unreasonable as the basis for the threshold in our analysis.
By contrast, Meier et al. (2008) demonstrated that using the smallest instead of the mean interspecific distance is more appropriate for barcoding gap computation. Under this criterion, both COI and 16S barcoding gaps were consistently detected for each species in our study, and a common genetic threshold of 1.3% sequence divergence was also defined for the sparids delimitation. Coincidentally, our threshold value was identical to the minimum 16S interspecific distance among seven species of the genus Acanthopagrus detected by Iwatsuki (2013), although the set of species analysed between these two studies are obviously different. Because the multiple independent origins and old evolutionary history have been argued for the sparids (Orrell et al., 2002; Chiba et al., 2009), based on inference, this coincidence might reflect the inherent (or fixed) genetic differences between closely related species within the family Sparidae, although the high similarities in appearance among them are derived from convergent evolution (Chiba et al., 2009). Moreover, the threshold defined in our study does not include those species with high intraspecies divergences. For the six sparid species from the Indo-West Pacific, the deep intraspecific divergences containing cryptic diversity were all higher than the 1.3% genetic threshold, whereas the remaining intraspecific variations were all lower than the 1.3% genetic threshold. Clearly, based on the smallest interspecific distance, we yielded a robust genetic threshold to minimize false positives and false negatives. This result strongly confirms the rational formula of genetic threshold setting proposed by Meier et al. (2008). Thus, the genetic threshold discovered here can be used to assist in the species delimitation and species discovery in the family Sparidae and will be helpful to reveal species diversity of the family Sparidae in the Indo-West Pacific oceans because of the high species richness and wide distribution ranges.
4.3 Barcoding lineage and potential cryptic diversity in the sparid fishes with Indo-West Pacific range distributionThe barcoding lineages of COI in six species and of 16S in eleven species showed shallow spatial structure, and their low levels of intraspecific variation (< 1.3% genetic threshold) were detected in our data. The lack of intraspecific differentiation might reflect the population historical demography. In the Pleistocene ice age, many marginal marine fishes experienced a recent population range expansion, which has resulted in insufficient time to create significant intraspecific genetic differentiation (Hewitt, 2000; Liu et al., 2007; Wu et al., 2012b). Thus, a similar explanation could be applied here; however, two facts could not be ignored in this study. First, except both P. caeruleostictus and P. auratus which covered their entire species distribution range, most of the above species were restricted to a single ocean (e.g., the northwest Pacific, west Indian Ocean or western Australia), which may lead to an underestimate of intraspecific variation (Dasmahapatra and Mallet, 2006). Second, both COI and 16S genes are relatively conserved within mtDNA, and therefore, the levels of the above intraspecific variations were low in both markers. For these reasons, greater sampling intensity and broader sampling range for barcoding lineage studies of the above species in the future are essential.
By contrast, a total of six nominal species, Ar. spinifer, R. sarba, D. hypselosomus, A. latus, A. australis and A. berda, with Indo-West Pacific range distributions exhibited remarkable geographic lineage structure based on our COI and 16S data, because they have high genetic distances among lineages (> 1.3% genetic threshold). Generally, high intraspecific divergence reflects either interspecific hybridization or cryptic and unrecognized speciation events (Ward et al., 2005; Puckridge et al., 2013). The clearest signature of interspecific hybridization is the sharing of sympatric mtDNA haplotypes between closely allied species (Funk and Omland, 2003). However, in the present study, this signature was not found. Accordingly, our deep intraspecific divergences were considered to be indicative of cryptic speciation. Such potential cryptic speciation appears particularly credible because the divergent lineages within each of the six sparid species were allopatrically distributed. Examples of this deep intraspecific divergence with the corresponding geographic differentiation have been noted in various fishes with Indo-West Pacific range distribution and have also led to identification of cryptic species (Ward et al., 2005, 2008; Zemlak et al., 2009; Hubert et al., 2012; Jaafar et al., 2012; Puckridge et al., 2013). The results of the present study clearly indicate that obvious geographic isolation occurred among the populations of each of these six sparid species. Thus, these species are likely to harbour unrecognized cryptic species, although we only analysed their barcoding sequences from published data, and cannot get their voucher specimens for further morphological verification.
By comparing the locations of potential cryptic diversity revealed in this study, most of the lineage divergences occurred between the Indian and West Pacific oceans or within the Indian Ocean, such as for Ar. spinifer, R. sarba, A. latus and A. berda. This finding could result from phylogeographic processes or a geographical barrier. Because of the decreasing sea level in the glacial period, the emergence of the Sunda Shelf and the integration of islands in Southeast Asia, geographic isolation formed between the Indian and West Pacific oceans (Springer and Williams, 1990; Voris, 2000). These historical processes could cause a strong genetic break between the two oceans and facilitate allopatric speciation for numerous marine fishes (Carpenter and Springer, 2005; Hubert et al., 2011, 2012). A clear phylogeographic break between the populations in the two oceans was also reported in marine invertebrates, inculding the coconut crab Birgus latro (Lavery et al., 1996), mud crab Scylla serrata (He et al., 2011), and starfish Linckia laevigata (Williams and Benzie, 1998). Within the Indian Ocean, the wide abyssal zone between the western Indian Ocean and Australia (approximately 7 000 km width) would have acted as a barrier to gene flow of marine organisms, potentially aiding the regional genetic divergence and ultimately speciation (Zemlak et al., 2009). This hypothesis has been particularly demonstrated in nine inshore fishes and three Platycephalidae species, showing clear species-level genetic difference between populations from opposite sides of the Indian Ocean (Zemlak et al., 2009; Puckridge et al., 2013), in addition to the sparid species mentioned in our study. Alternatively, a few lineage divergences found within the West Pacific (e.g., D. hypselosomus and A. australis) might be signatures of the secondary contact of once-isolated groups between marginal seas of this area (Wu et al., 2012b; Puckridge et al., 2013). Based on the above analyses, the potential cryptic diversity of this study was primarily attributed to the allopatric divergences, indicating that geographic isolation greatly influenced the cryptic speciation of the sparids. This conclusion was also supported by the phylogeographic pattern of our deep barcode lineages, because both Patterns 3 and 4 of cryptic diversity were also caused by geographic isolation in 12 species of Indo-Pacific coral reef fishes (Hubert et al., 2012). The revelation of potential cryptic diversity of the sparid fishes in the Indo-West Pacific oceans is of critical importance in understanding the diversification of species and also in guiding conservation and management of this group.
Additionally, the potential cryptic species diversity detected in this study is also consistent with the Centre-of-Overlap hypothesis for explanation of the highest marine biodiversity in the Indo-MalayPhilippines Archipelago (IMPA) (Hubert et al., 2012). However, we could not exclude the other possible hypothesis of the Centre-of-Origin for explaining the biodiversity accumulation in the IMPA (Carpenter and Springer, 2005), because, although our high levels of cryptic diversity occurred outside the IMPA, only a few sequences from this area were analysed in this study. In further research, more IMPA sparid fishes must be sampled to uncover the barcoding lineage and species diversification in this area. On the other hand, owing to its maternal inheritance, mitochondrial gene may result in low phylogenetic signal between species and therefore could not be used to build deep molecular phylogenies (Hajibabaei et al., 2007; Zheng et al., 2014). In our analysis, the phylogenetic relationships of the most Acanthopagrus species were not clearly resolved with low bootstrap values (< 70%) in both the COI and 16S trees, which indicated that the short barcode sequences used here did not contain enough information to reveal the accurate phylogenetic relationships among closely related taxa. Thus, future studies are needed to apply an integrative DNA barcoding including nuclear markers with biparental inheritance, mitochondrial genes, multi-locus, and morphology (Hubert and Hanner, 2015) for the species delineation and assembly of a complete phylogentic tree in the sparid fishes, especially the genus Acanthopagrus.
5 CONCLUSIONThe present study demonstrated that both COI and 16S genes could not only efficiently discriminate species but also could successfully detect the barcoding gap and define a common genetic threshold in the sparid fishes from China. Based on these results and the advantages of 16S gene, we propose that the COI gene serve as the standard DNA barcode for sparid fishes, and that the 16S gene could also be an ideal candidate barcode. Furthermore, each of those six species representing potential cryptic species corresponding with allopatrically divergent lineages was detected in the sparid fishes of the Indo-West Pacific region. Therefore, we must carefully examine the taxonomic status of these species in the future and initiate the necessary priority conservation strategies, because each of the six sparid species has a long history and a distinct evolutionary lineage.
6 DATA AVAILABILITY STATEMENTThe mitochondrial COI and 16S sequences presented here are deposited in GenBank (accession numbers KY855480–KY855496, KY855448–KY855479).
7 ACKNOWLEDGEMENTWe thank Dr. SU Junhu of Gansu Agricultural University for providing samples of New Zealand.
Armani A, Guardone L, Castigliego L, D'Amico P, Messina A, Malandra R, Gianfaldonia D, Guidia A. 2015. DNA and mini-DNA barcoding for the identification of Porgies species (family Sparidae) of commercial interest on the international market. Food Control, 50: 589-596.
DOI:10.1016/j.foodcont.2014.09.025 |
Asgharian H, Sahafi H H, Ardalan A A, Shekarriz S, Elahi E. 2011. Cytochrome c oxidase subunit 1 barcode data of fish of the Nayband National Park in the Persian Gulf and analysis using meta-data flag several cryptic species. Mol.Ecol. Resour., 11(3): 461-472.
DOI:10.1111/men.2011.11.issue-3 |
Bhattacharya M, Sharma A R, Patra B C, Sharma G, Seo E M, Nam J S, Chakraborty C, Lee S S. 2016. DNA barcoding to fishes:current status and future directions. Mitochondrial DNA Part A, 27(4): 2 744-2 752.
|
Cardoni S, Tenchini R, Ficulle I, Piredda R, Simeone M C, Belfiore C. 2015. DNA barcode assessment of Mediterranean mayflies (Ephemeroptera), benchmark data for a regional reference library for rapid biomonitoring of freshwaters. Biochem. Syst. Ecol., 62: 36-50.
DOI:10.1016/j.bse.2015.07.035 |
Carpenter K E, Niem V H. 2001. FAO species identification guide for fishery purposes. The living marine resources of the Western Central Pacific. Volume 5. Bony fishes part 3(Menidae to Pomacentridae). FAO, Rome. p.2 990-3 003.
|
Carpenter K E, Springer V G. 2005. The center of the center of marine shore fish biodiversity:the Philippine islands. Environ. Biol. Fish., 72(4): 467-480.
DOI:10.1007/s10641-004-3154-4 |
Chen Y X, Liu J, Liu L. 2014. Comparative osteology in eight sparid fishes (Osteichthyes:Perciformes) with remarks on their classification. J. Fish. China, 38(9): 1 360-1 374.
(in Chinese with English abstract) |
Chen Y X, Liu J, Wu R X. 2015a. A new record of blue-spotted seabream Pagrus caeruleostictus from Chinese coastal waters documented from morphology and DNA barcoding. Chin. J. Oceanol. Limnol., 33(2): 500-505.
DOI:10.1007/s00343-015-4059-0 |
Chen Y X, Wu R X, Liang N, Liu J. 2015b. Phylogenetic relationship in family Sparidae of China in mitochondrial COI gene sequence. Oceanol. Limnol. Sin., 46(3): 611-619.
(in Chinese with English abstract) |
Chiba S N, Iwatsuki Y, Yoshino T, Hanzawa N. 2009. Comprehensive phylogeny of the family Sparidae(Perciformes:Teleostei) inferred from mitochondrial gene analyses. Genes Genet. Syst., 84(2): 153-170.
DOI:10.1266/ggs.84.153 |
Darriba D, Taboada G L, Doallo R, Posada D. 2012. jModelTest 2:more models, new heuristics and parallel computing. Nat. Methods, 9(8): 772.
|
Dasmahapatra K K, Mallet J. 2006. Taxonomy:DNA barcodes:recent successes and future prospects. Heredity, 97(4): 254-255.
DOI:10.1038/sj.hdy.6800858 |
Fan J R, Wu R X, Zhao Y J, Liu J. 2011. Progresses on taxonomy and phylogeny of family Sparidae from China. J. Fish. Sci.China, 18(2): 472-480.
(in Chinese with English abstract) |
Felsenstein J P. 2002. PHYLIP (phylogeny inference package)version 3.6. Phil. Trans. R. Soc. Lond. B., 356: 1 661-1 679.
|
Funk D J, Omland K E. 2003. Species-level paraphyly and polyphyly:frequency, causes, and consequences, with insights from animal mitochondrial DNA. Annu. Rev.Ecol. Evol. Syst., 34(1): 397-423.
DOI:10.1146/annurev.ecolsys.34.011802.132421 |
Guan Z C, Tang W Q, Wu H L. 2012. One new species of the genus Evynnis from China (Perciformes, Sparidae). Acta Zoot. Sin., 37(1): 217-221.
(in Chinese with English abstract) |
Hajibabaei M, Janzen D H, Burns J M, Hallwachs W, Hebert P D N. 2006. DNA barcodes distinguish species of tropical Lepidoptera. Proc. Natl. Acad. Sci. USA, 103(4): 968-971.
DOI:10.1073/pnas.0510466103 |
Hajibabaei M, Singer G A C, Hebert P D N, Hickey D A. 2007. DNA barcoding:how it complements taxonomy, molecular phylogenetics and population genetics. Trends Genet., 23(4): 167-172.
DOI:10.1016/j.tig.2007.02.001 |
He L J, Zhang A B, Zhu C D, Weese D, Qiao Z G. 2011. Phylogeography of the mud crab (Scylla serrata) in the Indo-West Pacific reappraised from mitochondrial molecular and oceanographic clues:transoceanic dispersal and coastal sequential colonization. Mar. Ecol., 32(1): 52-64.
DOI:10.1111/mae.2011.32.issue-1 |
Hebert P D N, Cywinska A, Ball S L, Dewaard J R. 2003a. Biological identification through DNA Barcodes. Proc.Roy. Soc. B:Biol. Sci., 270(1512): 313-321.
DOI:10.1098/rspb.2002.2218 |
Hebert P D N, Penton E H, Burns J M, Janzen D H, Hallwachs W. 2004a. Ten species in one:DNA barcoding reveals cryptic species in the neotropical skipper butterfly Astraptes fulgerator. Proc. Natl. Acad. Sci. USA, 101(41): 14 812-14 817.
DOI:10.1073/pnas.0406166101 |
Hebert P D N, Ratnasingham S, De Waard J R. 2003b. Barcoding animal life:cytochrome c oxidase subunit 1 divergences among closely related species. Proc. Roy. Soc. B:Biol. Sci., 270(Suppl.1): S96-S99.
|
Hebert P D N, Stoeckle M Y, Zemlak T S, Francis C M. 2004b. Identification of birds through DNA barcodes. PLoS Biol., 2(10): e312.
DOI:10.1371/journal.pbio.0020312 |
Hewitt G. 2000. The genetic legacy of the Quaternary ice ages. Nature, 405(6789): 907-913.
DOI:10.1038/35016000 |
Hsu T H, Guillén Madrid A G, Burridge C P, Cheng H Y, Gwo J C. 2011. Resolution of the Acanthopagrus black seabream complex based on mitochondrial and amplified fragment-length polymorphism analyses. J. Fish Biol., 79(5): 1 182-1 192.
DOI:10.1111/jfb.2011.79.issue-5 |
Hubert N, Hanner R. 2015. DNA barcoding, species delineation and taxonomy:a historical perspective. DNA Barcodes, 3: 44-58.
|
Hubert N, Meyer C P, Bruggemann H J, Guérin F, Komeno R J L, Espiau B, Causse R, Williams J T, Planes S. 2012. Cryptic diversity in Indo-Pacific coral-reef fishes revealed by DNA-barcoding provides new support to the centre-ofoverlap hypothesis. PLoS One, 7(3): e28987.
DOI:10.1371/journal.pone.0028987 |
Hubert N, Paradis E, Bruggemann H, Planes S. 2011. Community assembly and diversification in Indo-Pacific coral reef fishes. Ecol. Evol., 1(3): 229-277.
DOI:10.1002/ece3.19 |
Iwatsuki Y, Akazaki M, Taniguchi N. 2007. Review of the species of the genus Dentex (Perciformes:Sparidae) in the Western Pacific defined as the D. hypselosomus complex with the description of a new species, Dentex abei and a redescription of Evynnis tumifrons. Bull. Natl. Mus. Nat.Sci. Ser. A, 1(Suppl.): 29-49.
|
Iwatsuki Y, Newman S J, Russell B C. 2015. Dentex carpenteri, a new species of deepwater seabream from Western Australia (Pisces:Sparidae). Zootaxa, 3957(1): 109-119.
DOI:10.11646/zootaxa.3957.1 |
Iwatsuki Y. 2013. Review of the Acanthopagrus latus complex(Perciformes:Sparidae) with descriptions of three new species from the Indo-West Pacific Ocean. J. Fish Biol., 83(1): 64-95.
DOI:10.1111/jfb.12151 |
Jaafar T N A M, Taylor M I, Nor S A M, de Bruyn M, Carvalho G R. 2012. DNA barcoding reveals cryptic diversity within commercially exploited Indo-Malay Carangidae(Teleosteii:Perciformes). PLoS One, 7(11): e49623.
DOI:10.1371/journal.pone.0049623 |
Khedkar G D, Jamdade R, Naik S, David L, Haymer D. 2014. DNA Barcodes for the fishes of the Narmada, one of India's longest rivers. PLoS One, 9(7): e101460.
DOI:10.1371/journal.pone.0101460 |
Knebelsberger T, Landi M, Neumann H, Kloppmann M, Sell A F, Campbell P D, Laakmann S, Raupach M J, Carvalho G R, Costa F O. 2014. A reliable DNA barcode reference library for the identification of the north European shelf fish fauna. Mol. Ecol. Resour., 14(5): 1 060-1 071.
|
Lakra W S, Goswami M, Gopalakrishnan A. 2009. Molecular identification and phylogenetic relationships of seven Indian Sciaenids (Pisces:Perciformes, Sciaenidae) based on 16S rRNA and cytochrome c oxidase subunit I mitochondrial genes. Mol. Biol. Rep., 36(5): 831-839.
DOI:10.1007/s11033-008-9252-1 |
Lavery S, Moritz C, Fielder D R. 1996. Indo-Pacific population structure and evolutionary history of the coconut crab Birgus latro. Mol. Ecol., 5(4): 557-570.
DOI:10.1111/j.1365-294X.1996.tb00347.x |
Lee M Y, Munroe T A, Shao K T. 2014. Description of a new cryptic, shallow-water tonguefish (Pleuronectiformes:Cynoglossidae:Symphurus) from the western North Pacific Ocean. J. Fish Biol., 85(3): 563-585.
DOI:10.1111/jfb.2014.85.issue-3 |
Liang R S, Zhuo X L, Yang G H, Luo D J, Zhong S, Zou J X. 2012. Molecular phylogenetic relationships of family Haemulidae (Perciformes:Percoidei) and the related species based on mitochondrial and nuclear genes. Mitochondrial DNA, 23(4): 264-277.
DOI:10.3109/19401736.2012.690746 |
Librado P, Rozas J. 2009. DnaSP v5:A software for comprehensive analysis of DNA polymorphism data. Bioinformatics, 25(11): 1 451-1 452.
|
Liu J X, Gao T X, Wu S F, Zhang Y P. 2007. Pleistocene isolation in the Northwestern Pacific marginal seas and limited dispersal in a marine fish, Chelon haematocheilus(Temminck & Schlegel, 1845). Mol. Ecol., 16(2): 275-288.
|
Liu J, Wu R X, Kang B, Ma L. 2016. Fishes of Beibu Gulf. Science Press, Beijing. p.218-226.
(in Chinese)
|
Ma H Y, Ma C Y, Li C H, Lu J X, Zou X, Gong Y Y, Wang W, Chen W, Ma L B, Xia L J. 2015. First mitochondrial genome for the red crab (Charybdis feriata) with implication of phylogenomics and population genetics. Sci. Rep., 5: 11524.
DOI:10.1038/srep11524 |
Ma H Y, Ma C Y, Li X C, Xu Z, Feng N N, Ma L B. 2013. The complete mitochondrial genome sequence and gene organization of the mud crab (Scylla paramamosain) with phylogenetic consideration. Gene, 519(1): 120-127.
DOI:10.1016/j.gene.2013.01.028 |
Meier R, Zhang G Y, Ali F. 2008. The use of mean instead of smallest interspecific distances exaggerates the size of the "barcoding gap" and leads to misidentification. Syst. Biol., 57(5): 809-813.
DOI:10.1080/10635150802406343 |
Meyer C P, Paulay G. 2005. DNA barcoding:error rates based on comprehensive sampling. PLoS Biol., 3(12): e422.
DOI:10.1371/journal.pbio.0030422 |
Moritz C, Cicero C. 2004. DNA barcoding:promise and pitfalls. PLoS Biol., 2(10): e354.
DOI:10.1371/journal.pbio.0020354 |
Nelson J S. 2006. Fishes of the World. 4th edn. John Wiley & Sons, Inc., New Jersey. p.371.
|
Orrell T M, Carpenter K E, Musick J A, Graves J E. 2002. Phylogenetic and biogeographic analysis of the Sparidae(Perciformes:Percoidei) from cytochrome b sequences. Copeia, (3): 618-631.
|
Orrell T M, Carpenter K E. 2004. A phylogeny of the fish family Sparidae (Porgies) inferred from mitochondrial sequence data. Mol. Phylogenet. Evol., 32(2): 425-434.
DOI:10.1016/j.ympev.2004.01.012 |
Palumbi S R. 1996. Nucleic acids Ⅱ: the polymerase chain reaction. In: Hillis DM, Moritz C, Mable BK eds. Molecular Systematics. Sinauer Associates, Massachusetts. p.205-247.
|
Paulin C D. 1990. Pagrus auratus, a new combination for the species known as "snapper" in Australasian waters(Pisces:Sparidae). New Zeal. J. Mar. Fresh. Res., 24(2): 259-265.
DOI:10.1080/00288330.1990.9516422 |
Puckridge M, Andreakis N, Appleyard S A, Ward R D. 2013. Cryptic diversity in flathead fishes (Scorpaeniformes:Platycephalidae) across the Indo-West Pacific uncovered by DNA barcoding. Mol. Ecol. Resour., 13(1): 32-42.
DOI:10.1111/1755-0998.12022 |
Ratnasingham S, Hebert P D N. 2007. BOLD:the barcode of life data system (http://www.barcodinglife.org). Mol. Ecol. Notes, 7(3): 355-364.
DOI:10.1111/j.1471-8286.2007.01678.x |
Sambrook J, Russell D W. 2001. Molecular Cloning:a Laboratory Manual. 3rd edn. Cold Spring Harbor Laboratory Press, New York. p.1-372.
|
Shao K T. 2017. The Fish Database of Taiwan. (WWW Web electronic publication). Available at: http://fishdb.sinica.edu.tw (last accessed 30 March 2017).
|
Shen Y J, Guan L H, Wang D Q, Gan X N. 2016. DNA barcoding and evaluation of genetic diversity in Cyprinidae fish in the midstream of the Yangtze River. Ecol. Evol., 6(9): 2 702-2 713.
DOI:10.1002/ece3.2016.6.issue-9 |
Sinniger F, Reimer J D, Pawlowski J. 2008. Potential of DNA sequences to identify zoanthids (Cnidaria:Zoantharia). Zool. Sci., 25(12): 1 253-1 260.
DOI:10.2108/zsj.25.1253 |
Springer V G, Williams J T. 1990. Widely distributed Pacific plate endemics and lowered sea-level. Bull. Mar. Sci., 47(3): 631-640.
|
Steinke D, Connell A D, Hebert P D N. 2016. Linking adults and immatures of South African marine fishes. Genome, 59(11): 959-967.
DOI:10.1139/gen-2015-0212 |
Sun S E, Li Q, Kong L F, Yu H, Zheng X D, Yu R H, Dai L N, Sun Y, Chen J, Liu J, Ni L H, Feng Y W, Yu Z Z, Zou S M, Lin J P. 2016. DNA barcoding reveal patterns of species diversity among northwestern pacific molluscs. Sci. Rep., 6: 33 367.
DOI:10.1038/srep33367 |
Tamura K, Stecher G, Peterson D, Filipski A, Kumar S. 2013. MEGA6:molecular evolutionary genetics analysis version 6.0. Mol. Biol. Evol., 30(12): 2 725-2 729.
DOI:10.1093/molbev/mst197 |
Turanov S V, Kartavtsev Y P, Lipinsky V V, Zemnukhov V V, Balanov A A, Lee Y H, Jeong D. 2016. DNA-barcoding of perch-like fishes (Actinopterygii:Perciformes) from fareastern seas of Russia with taxonomic remarks for some groups. Mitochondrial DNA Part A, 27(2): 1 188-1 209.
DOI:10.3109/19401736.2014.945525 |
Vences M, Thomas M, van der Meijden A, Chiari Y, Vieites D.R. 2005. Comparative performance of the 16S rRNA gene in DNA barcoding of amphibians. Front. Zool., 2: 5.
DOI:10.1186/1742-9994-2-5 |
Voris H K. 2000. Maps of Pleistocene sea levels in Southeast Asia:shorelines, river systems and time durations. J.Biogeogr., 27(5): 1 153-1 167.
DOI:10.1046/j.1365-2699.2000.00489.x |
Ward R D, Hanner R, Hebert P D N. 2009. The campaign to DNA barcode all fishes, FISH-BOL. J. Fish Biol., 74(2): 329-350.
DOI:10.1111/jfb.2009.74.issue-2 |
Ward R D, Holmes B H, Yearsley G K. 2008. DNA barcoding reveals a likely second species of Asian sea bass(barramundi) (Lates calcarifer). J. Fish Biol., 72(2): 458-463.
DOI:10.1111/jfb.2008.72.issue-2 |
Ward R D, Holmes B H. 2007. An analysis of nucleotide and amino acid variability in the barcode region of cytochrome c oxidase I (cox1) in fishes. Mol. Ecol. Notes, 7(6): 899-907.
DOI:10.1111/men.2007.7.issue-6 |
Ward R D, Zemlak T S, Innes B H, Last P R, Hebert P D N. 2005. DNA barcoding Australia's fish species. Phil.Trans. Roy. Soc. B:Biol. Sci., 360(1462): 1 847-1 857.
DOI:10.1098/rstb.2005.1716 |
Ward R D. 2009. DNA barcode divergence among species and genera of birds and fishes. Mol. Ecol. Resour., 9(4): 1 077-1 085.
DOI:10.1111/men.2009.9.issue-4 |
Williams S T, Benzie J A H. 1998. Evidence of a biogeographic break between populations of a high dispersal starfish:congruent regions within the Indo-West Pacific defined by color morphs, mtDNA, and allozyme data. Evolution, 52(1): 87-99.
|
Wu R X, Guo L J, Liu J. 2011. Genetic variation of Trichiurus lepturus and phylogenetic relationship among its closed species. Acta Zoot. Sin., 36(3): 648-655.
(in Chinese with English abstract) |
Wu R X, Liu J, Fan J R, Zhao Y J. 2012a. Taxonomic status of the black porgy, Acanthopagrus schlegelii (Perciformes:Sparidae) inferred from mitochondrial genes. Afr. J.Biotechnol., 11(25): 6 641-6 646.
|
Wu R X, Liu S F, Zhuang Z M, Su Y Q, Tang Q S. 2012b. Population genetic structure and demographic history of small yellow croaker, Larimichthys polyactis (Bleeker, 1877), from coastal waters of China. Afr. J. Biotechnol., 11(3): 3 493-3 496.
|
Xia J H. 2007. Identification standard of Sparid species based on cytochrome b sequences. South China Fish. Sci., 3(1): 37-43.
(in Chinese with English abstract) |
Xu T J, Wang R X, Wang J X. 2010. Cloning and sequence analysis of cyt b gene in four Sparidae fishes in Zhoushan sea area. South China Fish. Sci., 6(1): 30-36.
(in Chinese with English abstract) |
Yang H R, Jiang S G. 2006. Study on genetic relationships of Sparidae by RAPD. J. Fish. China, 30(4): 469-474.
(in Chinese with English abstract) |
Zemlak T S, Ward R D, Connell A D, Holmes B H, Hebert P D N. 2009. DNA barcoding reveals overlooked marine fishes. Mol. Ecol. Resour., 9(Suppl. 1): 237-242.
|
Zhang J B, Hanner R. 2011. DNA barcoding is a useful tool for the identification of marine fishes from Japan. Biochem.Syst. Ecol., 39(1): 31-42.
DOI:10.1016/j.bse.2010.12.017 |
Zheng L M, He J R, Lin Y S, Cao W Q, Zhang W J. 2014. 16S rRNA is a better choice than COI for DNA barcoding hydrozoans in the coastal waters of China. Acta Oceanol.Sin., 33(4): 55-76.
DOI:10.1007/s13131-014-0415-8 |