 2018, Vol. 36
Institute of Oceanology, Chinese Academy of Sciences
Article Information
- DING Jian(丁坚), SHAO Yuchen(邵雨辰), WU De'an(吴德安)
- Effect of tidal currents on the transport of saline water from the North Branch in the Changjiang River estuary
- Chinese Journal of Oceanology and Limnology, 36(6): 2085-2097
- http://dx.doi.org/10.1007/s00343-018-7357-5
Article History
- Received Dec. 17, 2017
- accepted in principle Mar. 18, 2018
- accepted for publication Apr. 4, 2018


2 Nanjing Water Planning and Design Institute Corp. Ltd., Nanjing 210022, China
The Changjiang (Yangtze) River is the largest river of the china, with 9.24×10¹¹ m3 freshwater discharged into the East China Sea each year (Wu et al., 2010). Runoff varies seasonally, with a maximum monthly mean of 49 500 m3/s in July and a minimum of 10 500 m3/s in January (Shen et al., 2003). The width of the river mouth is about 90 km, and the tidal limit reaches Anhui Datong station about 642 km from the river mouth. The Changjiang River estuary is a moderate tidal estuary with multi-level branching influenced by the interactions of runoff and tidal current. Chongming Island first divides the estuary into the North Branch and the South Branch. Then, the South Branch is bifurcated by Hengsha Island and Changxing Island into the North Channel and the South Channel. Finally, the South Channel is bifurcated into the North Passage and the South Passage by Jiuduansha. The runoff of the Changjiang River is ultimately discharged into the East China Sea through four outlets.
Saltwater intrusion presents a specific pattern in the Changjiang estuary; in the dry season when river discharge is small, the water/salt mass in the North Branch can spill over into the South Branch under strong tidal conditions (Wu and Zhu, 2007; Xue et al., 2009; Wu et al., 2010). Previous studies have focused on the interactions between saltwater and freshwater, such as the length of saltwater intrusion (e.g., Shen et al., 2003; Kong et al., 2004). In early studies of saltwater intrusion length, it was assumed that the transport of runoff and tidal currents to saline water was balanced (Knudsen, 1900; Hansen and Rattray, 1965), and based on this assumption, many researchers have proposed equilibrium equations of estuarine salinity transport. Festa and Hansen (1976) found that the length of salinity intrusion changes with water depth, the vertical diffusion coefficient, and runoff. Chatwin (1976) evaluated salinity intrusion length based on parameters including the depth of the estuary, runoff, the vertical diffusion coefficient and the salinity of the estuary (Chatwin, 1976). Based on in-situ data, investigation and analysis revealed that river discharge and tides were the main dynamic factors determining the features of saltwater intrusion in the Changjiang estuary during the dry season (Zhu et al., 2010; Li et al., 2012).
Many researchers have explored the relationships between saltwater intrusion and various factors such as runoff, tides, topography and wind using numerical models. Park and Kuo (1996) used a two-dimensional numerical model to study the saltwater intrusion process and its response to changes in the tide cycle, and the results showed that the response of the estuary saltwater intrusion to the changes in tidal current velocity requires four months of adjustment time (Park and Kuo, 1996). Taking into account the complexity of saltwater intrusion in the Changjiang River estuary, researchers have mainly focused on the influence of runoff, tides, wind, topography and estuarine engineering on saltwater intrusion (Mao and Shen, 1993; Xiao and Shen, 1998; Shen et al., 2000; Zhu and Wu, 2013). Based on a three-dimensional numerical model with a high-resolution grid, the response time of saltwater intrusion to river discharge during different tidal patterns in the Changjiang River estuary was studied (Hou and Zhu, 2013). Saltwater diffusion forced by the M2 constituent and the quasisteady flow were studied using a numerical mode (Zhu and Wu, 2013), and it was pointed out that the M2 constituent has great influence on the mixing and transport of salinity. The quantitative relationships between saltwater intrusion from the North Branch and both river runoff and tidal range were analyzed (Wu et al., 2006) using the ECOM-si numerical model, and the modified ECOM model was used to study the impact of wind stress and the Coriolis force on the formation of a freshwater zone in the Meimaosha area of the South Passage of the Changjiang River estuary (Zhu et al., 2008). It was found that a freshwater zone existed in the Meimaosha area during the dry season, and its dynamic mechanisms of formation were mainly Changjiang River runoff and tidal current oscillation. Based on a three-dimensional numerical model, the transport mechanism of saltwater spilling over from the North Branch in the Changjiang River estuary was analyzed quantitatively using the flux analysis method. The Lagrange residual as well as the tidal pump were found to be the main dynamic factors (Wu and Zhu, 2007).
In brief, these studies of saltwater intrusion in the Changjiang River estuary have mainly been based on the response of the Changjiang River estuary to runoff, tidal currents, circulation, tides, topography, hydraulic structure, and wind forcing (Gong and Shen, 2011; Fan et al., 2012; Wang et al., 2012; Shaha et al., 2013). A significant feature of saltwater intrusion in the Changjiang River estuary is the mixing of saltwater from the North Branch and saltwater from the South Branch (Mao and Shen, 1993). It is particularly difficult to visually identify and analyze saltwater transport and the distribution of brine salinity from the North Branch. Previous studies have used the relationships between maximum salinity, minimum salinity, and the tide level, the phase relationship between salinity and flow velocity, or the vertical distribution characteristics of salinity to qualitatively interpret the source of the saltwater. However, these studies lacked clear and accurate methods to reflect the processes of saltwater intrusion from the North Branch and the characteristics of its transport and diffusion in the South Branch. Therefore, in this study, the MIKE 21 model has been applied to the Changjiang River estuary and adjacent Hangzhou Bay to simulate tidal currents and salinity transport and distribution. The effects of various tidal current intensities corresponding to the given amplitude of the M2 constituent along the open boundary on salt intrusion were investigated. Model calibration and verification were conducted by comparing the tidal level, tidal current velocity, and salinity with the available field data. The model was then applied to investigate the transport and diffusion of the salt mass in the South Branch, which originates only from the North Branch, under a given river discharge amount and various tidal current intensity conditions. The data of underwater topographic, current, sediment concentration, salinity used in this paper were surveyed and provided by "General Administration of hydrology of Shanghai" and "Survey Bureau of Hydrology and Water Resources of the Yangtze River Estuary, Changjiang Water Resources Commission".
The two hydrology survey basically covers the entire Changjiang estuary.
2 METHOD 2.1 Governing equations for salinityThe module was used to calculate temperature and salinity diffusion in the MIKE 21 model. The threedimensional salinity transport equation in a Cartesian coordinate system:
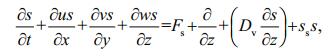 (1)
(1)was used, where s is the salinity, Dv is the vertical diffusion coefficient of salinity, and ss is the salinity discharge of point source. The variable Fs is the horizontal salinity diffusion term, which can be defined as:
 (2)
(2)where Dh is the horizontal diffusion coefficient of salinity, Dh=A/σT, and Dv=vt/σT, σT is the Prandtl constant. The horizontal eddy viscosity coefficient is calculated using the Smagorinsky formula, which is based on the velocity gradient.
 (3)
(3)where Cs is set to 0.28.
The σ coordinate transformation of the salinity transport equation is the same as the tidal flow equation. The expression after coordinate transformation is as follows:
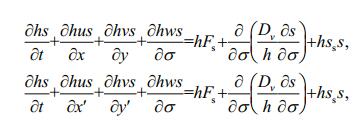 (4)
(4)The two-dimensional salinity transport equation in a Cartesian coordinate system is as follows:
 (5)
(5)where s is the vertically averaged salinity along the water column.
2.2 The range of model and mesh partitioningTo study saltwater intrusion from the North Branch, the range of the model was set to A and to B2, as shown in Figs. 1 and 2, respectively. The range of model A is the maximum range. The western/upstream open boundary is at Datong Station in Anhui Province, about 500 km from Xuliuting in the Changjiang River estuary. The downstream boundaries of the model are three open boundaries to the south, north and east; the northern open boundary is along the latitude of 32.5°N, the southern open boundary is along the latitude of 29.5°N, and the eastern open boundary is along the longitude of 124.5°E. The eastern and western open boundaries are about 700 km apart, the northern and southern open boundaries are about 350 km apart.

|
| Fig.1 Bathymetric map of water depth below 1985 elevation datum plane |

|
| Fig.2 Bathymetric map for schematic B2 |
In order to control the strength of the intrusion saltwater and study transport law of the saline water only from the North Branch, the model B2 was set up. For model B2, the upstream open boundary of the B2 model is along the section of Datong station. The start point of the downstream northern open boundary is set near Lianxinggang, and another open boundary of model B2 in the North Branch is located near the head of Chongming Island. The eastern open boundary is about 100 km from the estuary entrance, located near the 40 m isobath. The southern open boundary is from Luchaogang eastward.
2.3 Computational gridThe number of grid cells for model A is 115 780, the number nodes is 61 246, the largest offshore grid spacing is 8 000 m, and the minimum mesh inside the estuary mouth is 200 m. The mesh size decreases gradually from the open sea to the mouth. The number of grid cells for model B1 is 74 115, the number of nodes is 39 603, the maximum grid spacing is about 2 000 m, and the grid size is close to that of model A in the inner estuary. The number of grid cells for B2 is 32 311, the number of nodes is 60 368.
2.4 The open boundary conditionsThe upstream boundaries of models A and B2 at Datong station are driven by daily flow measurements from February 11, 2002 to March 13, 2002. The boundary of model A in the open sea is driven by hourly water level data from February 11 to March 13, 2002. The water level data were obtained from the calculated results of the East China Sea Model (Zhang, 2005). The flow of the Qiangtangjiang boundary was set to 0 m3/s because of its small runoff volume. For model B2, the open sea boundary and the Chongtou boundary in the North Branch are driven by the water level and flow processes from model A. For the initial conditions of models A and B2, a cold start was adopted, and the sea levels and flow rates for both models were set to 0 (Wu et al., 2015).
The upstream boundary salinity for the model A was set to 0, and the salinity at the southern boundary was obtained through linear interpolation between 15 to the west and 30 to the east. The salinity at the eastern boundary was obtained through linear interpolation between 30 to the south and 35 to the north. The salinity of the northern boundary was obtained through linear interpolation between 25 to the west and 35 to the east. The salinity at the boundary of model B2 in the North Branch was extracted from salinity calculation results of model A, and the salinity at the boundary in the southern branch was set to 0.
2.5 Model parameter setting(1) Time step: Δt=30 s.
(2) The roughness field has great influence on the flow velocity and tidal range. Based on the water depths of different areas, after careful verification and calibration, the roughness was taken as 0.01+0.01/H in the outer of the estuary area, and 0.015+0.015/H in inner area of the estuary, where H is the local water depth (relative to the average tidal level).
(3) The horizontal diffusion coefficient of salinity has some influence on the simulated salinity field in the Changjiang estuary. The greater the horizontal diffusion coefficient, the faster the rate of salinity diffusion and the larger the diffusion range. Based on careful verification and calibration, the salinity diffusion coefficient is given as 100 m2/s.
2.6 Model validationModel A was simulated for 120 days, repeatedly driven by the open boundary conditions from February 11, 2002 to March 12, 2002. Then, model B2 was simulated for 120 days. The initial salinity field of model B2 was provided by the simulation result of model A at the end of third interval of 30 days. The initial water level and velocity field values were 0; that is, using the initial dynamic conditions of the cold start for the model B2. The salinity values and water flux at the open boundary near the head of Chongming Island were obtained from the simulated results of model A. The water level along the rest of the open boundaries were given by model A, and the corresponding salinity values were set to 0 for investigating saltwater transport and diffusion in the South Branch, which represents intrusion of saltwater is from the North Branch. After 120 days of simulation of model B2, the last 15 days of the simulated results related to saltwater motion in the South Branch were used for verification and analysis. This 15-day period includes the typical tides types of full tide, spring tide and neap tide. Here, a percentage deviation model (Maréchal, 2004) was adopted to evaluate the simulation of models A and B2 for sea level and flow rate:
 (6)
(6)in the formula, D is the measured data, M is the model data, and the relationship between PB and the quality level of the simulation results is shown in Table 1.
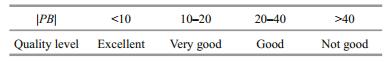
The percentage deviation model was used again to evaluate the simulation of salinity by models A and B2. The simulations of tide level, tide flow and salinity were good. The PB values (Maréchal, 2004) were generally less than 40. The tidal level, tidal current and salinity were well represented, and the PB values were less than 40. The model therefore meets the requirements (Shao, 2014).
3 RESULT AND ANALYSIS 3.1 Route settingIt is very difficult to obtain detailed data on saltwater intrusion in the North Branch, with limited field data available. To better understand the process of the saltwater intrusion from the North Branch, the downward movement of the saltwater and salinity changes in the waterways of the South Branch were studied to reveal the transport pattern of the saline pool in the waterways of the South Branch. Therefore, the movement routes of saline pool were set as shown in Fig. 3.

|
| Fig.3 The routes b1, b2, b3 (a); route b4 (b) |
The influences of different flow intensities on saltwater migration from the North Branch were also studied. At the upstream boundary of model A, the water flow rate is 13 000 m3/s, and the salinity is zero.
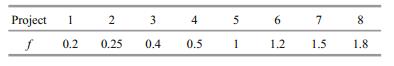
Tidal current character and tidal current elliptic factors in the Changjiang estuary were calculated and analyzed. The research shows that the tide characteristic coefficient values are less than 0.25 in the Deep Water Channel (Pan et al., 2016). The semidiurnal tidal current play major role (Jiang et al., 2013). M2 constituent is primary (Zhu et al., 1999) and the characters of tidal current are normal semidiurnal tidal rectilinear current in the sea area. Thus the hydrodynamic characteristics of the Changjiang estuary can be reflected in a better degree by using the M2 tide as the hydrodynamic opening boundary condition. The results of the East China Sea model provide the M2 tidal level from February 11, 2002 to March 12, 2002. The product of M2 tidal amplitude and the scale coefficient f can be used to represent the simulation of different flow intensities, as shown in Table 2.
As mentioned above, the numerical results obtained from model A for the boundary conditions of model B2 were obtained.
3.2 Response of tidal current to different proportions of M2 tideThe amplitude of the M2 tide on the open boundary is multiplied by a certain proportional coefficient, which indicates the input conditions of different tidal current intensities. To study the response of tidal current velocity to different proportional coefficients, the hourly flow data of 15 days were extracted at 1-km-interval grids along paths b1, b2, b3 and b4. The points of each path were classified as the inner and outer parts of the estuary. As is shown in Fig. 3, the area within 60 km of each path was defined as the inner area of the estuary, while the area outside the 60 km is defined as the outer area of the estuary. The calculation procedures are as follows:
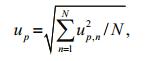 (7)
(7)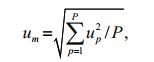 (8)
(8)where up, n represents the nth hourly-interval current velocity corresponding to point p along each path; N represents the number of up, n, N=24×15+1=361; up is the time root-mean-square (RMS) velocity at point p; um is the space RMS of up along each path, and P represents the number of points used in the RMS calculation.
As shown in Figs. 4–7, there is a nonlinear correlation between the RMS velocity and the proportionality coefficient, and the above nonlinear relationship is more accurate in parabolic form:
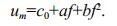 (9)
(9)

|
| Fig.4 Fitting relationships between the root mean square velocity um and the coefficient f Left: for the inner part of path b1; right: for the outer part of path b1. |

|
| Fig.5 Fitting relationships between the root mean square velocity um and the coefficient f Left: for the inner part of path b2; right: for the outer part of path b2. |

|
| Fig.6 Fitting relationships between the root mean square velocity um and the coefficient f Left: for the inner part of path b3; right: for the outer part of path b3. |

|
| Fig.7 Fitting relationships between the root mean square velocity um and the coefficient f Left: for the inner part of path b4; right: for the outer part of path b4. |
The coefficients a and b reflect the sensitivity of the tidal current velocity to the proportionality coefficient. Based on the values of a and b, the RMS velocity of the outer estuary is more sensitive than the RMS velocity of the inner estuary to the coefficient f. It is presumed that larger scale factors correspond to greater tidal current intensities.
3.3 The influence of tidal current on the transport of the salt waterTo facilitate analysis of the transport and diffusion of saltwater in the South Branch, the locations of maximum salinity along each path are defined as the saline core. The variation of the saline core corresponding to different tidal boundary conditions are shown in Figs. 8–11. Based on the variation of the saline core along each path under different flow conditions, during the spring tide period from third day to the sixth day, the saline core oscillates in the vicinity of the starting point. Greater tidal current velocities correspond to larger amplitudes of this oscillation. From the beginning of the sixth day, it is clear that the saline water pool is transported to the lower reaches. When the tidal current is weak, the salt water is transported to the lower reaches with little fluctuation. Under the advection transport of runoff and the tidal current, the core of the saline water pool is transported downstream at a constant velocity. With the enhancement of tidal current intensity, the core of saline group has clear fluctuations with the tidal cycle under the actions of flood and ebb currents.

|
| Fig.8 Positions of the saline core at hourly intervals along path b1 under different flow |

|
| Fig.9 Positions of the saline core at hourly intervals along path b2 under different flow |

|
| Fig.10 Positions of the saline core at hourly intervals on path b3 under different flow |

|
| Fig.11 Positions of the saline core at hourly intervals on path b4 under different flow |
The variation of the 24-hour-averaged salinity of the saline water core under different flow conditions are shown in Figs. 12–15. On the fifth day, the core salinity of the reached its maximum value, and in the process of downstream transport, the salinity of the salt water decreased. For model B2, under the same boundary control conditions, the saltwater intrusion of the North Branch was affected little by the different tidal currents in the south branch. Therefore, the maximum values of salt concentration corresponding to each scheme were similar. As shown by project 1, under conditions of low tidal current intensity, the lateral diffusion of brine is suppressed, and highconcentration saltwater was restricted to the Baimaosha waterway in the South Branch, The salinity values near the starting point of each path were relatively small. With the enhancement of the tidal current (as in project 5), the salinity increased with transverse diffusion. However, with the increase of the turbulent diffusion (e.g., projects 7 and 8), the salinity of the saline water core in the vicinity of the starting point of each path began to decline.

|
| Fig.12 The 24-hour-averaged salinity of the saline core along path b1 under different flow conditions |

|
| Fig.13 The 24-hour-averaged salinity of the saline core along path b2 under different flow conditions |

|
| Fig.14 The 24-hour-averaged salinity of the saline core along path b3 under different flow conditions |

|
| Fig.15 The 24-hour-averaged salinity of the saline core along path b4 under different flow conditions |
The relative salinity, that is, the ratio of the salinity of the saline core and its initial salinity, can reflect the diffusion rate of the saltwater. The relative salinity variation of the saline water core under different flow conditions are shown in Figs. 16–19. Under different flow conditions, the saltwater is transported downstream in each set path, and the change of the relative salinity of the tidal cycle in the brine mass is positively correlated with tidal current intensity. Stronger the tidal currents correspond to faster decrease of the salinity of the salt pool.

|
| Fig.16 Relative salinity of the saltwater core on path b1 under different flow |

|
| Fig.17 Relative salinity of the saltwater core on path b2 under different flow |

|
| Fig.18 Relative salinity of the saltwater core on path b3 under different flow |

|
| Fig.19 Relative salinity of the saltwater core on path b4 under different flow |
To further elucidate the attenuation of the relative salinity of the salt core, the attenuation of this relative salinity was calculated, as shown in Figs. 20 and 21. There is a strong linear relationship between the attenuation rate and the square of the RMS velocity u in the inner estuary; this expression is shown below:
 (10)
(10)The value of the coefficient c corresponding to each path is about 0.20–0.42; the coefficient d is more stable at around 0.021. The value of the coefficient c determines the decay of the salt core caused by flow velocity, whereas the value of the coefficient d is relatively constant, and its relationship with flow velocity is not explicit.
The decay rate rs is similar to that used in study of pollutant diffusion in the estuary. In the longitudinal mixing process of pollutants in the waterway, the longitudinal diffusion effect is mainly caused by dispersion induced by the inhomogeneous distribution of transverse or vertical flow velocity and turbulent diffusion. In fact, because the former is larger than the latter, and the two factors always work together. Therefore, turbulent diffusion is often neglected. This study is focused on longitudinal diffusion and the longitudinal diffusion coefficient (Fischer, 1967).
Because diffusion coefficients are affected by many factors, simplified theoretical analysis is often limited in practical application. Diffusion coefficients are calculated with semi-theoretical and semi-empirical formulae, which are calibrated based on field measurements or laboratory experimental data. These formulae include factors such as velocity, tidal period, water depth, and parameters reflecting river shape. It can be inferred that the coefficient c in Eq.8 should be related to the tidal cycle, channel depth and channel shape parameters. In the formula, the value of the coefficient d is relatively stable, which should be related to the dilution effect caused by runoff and turbulent diffusion.
4 CONCLUSIONUnder the conditions of upstream runoff of 13 000 m3/s, without wind force, and during the spring tide, the saline cores maintain an oscillating motion forced by the action of the flood and ebb currents along the Baimaosha waterway, with a range of oscillating motion below the head area of Chongming of about 0–14 km. Net transport of salt water to the lower reaches occurred in the transition period between spring tide and middle tide, the saline cores along each path were transported to downstream within 90 km below the tail of Baimaosha, and the fluctuation range of the saline core along each path in one tidal cycle was about 10–20 km. The average downward velocity of the saline core along each path in the inner estuary was about 8–10 km/d, whereas the average downward velocity in the outer estuary was about 2–4 km/d. Because of the influence of the double guide channel of the Changjiang estuary Deepwater Channel on water flow, the average downward velocity of the saline group core along path b2 in the outer estuary was about 10 km/d. The attenuation rate of the salinity of the salt core along each path was 0.08–0.1/d in the inner estuary and 0.24/d in the outer estuary, also because of the influence of the double guide channel of the Changjiang estuary Deepwater Channel on the water flow. The attenuation rate of salinity of the salt core along path b2 was about 0.1/d.
Saline water transport is the result of interactions of runoff and tidal currents. Under the actions of different flow intensities, the fluctuation range of the saline core in a tidal cycle increases with tidal current intensity. The attenuation of the average relative salinity of the saline core is linearly related to the square of the tidal current. This attenuation may be related to the tidal cycle, channel depth, and channel shape parameters, which may correspond to dilution and molecular diffusion caused by runoff.
In this study, under the condition of constant runoff, the response of the transport and diffusion of saline water from the North Branch to different tidal current intensities was studied. In practice, the influence of highly saline water from the South Branch on the transport of saline water from the North Branch is ignored, which means that this exploratory study of the transport of saltwater from the North Branch was carried out without considering the interactions between saline water from the North Branch and high-salinity water from the open sea passing through the South Branch. However, in the vicinity of the Changjiang estuary near the sea, tidally averaged circulation has the following feature: despite net seaward flow caused by the river through the crosssection, the deeper half of the water typically flows landward. This inflow gradually rises and joins the river flowing outward in the upper half of the estuary, which results in an overall pattern called exchange flow, and would affect the transport and diffusion of the saline water.
Only a two-dimensional numerical model was used in this study to simulate and analyze the movement of saline water from the North Branch. In fact, there is a strong stratification phenomenon in the vicinity of Chongming Island, which causes more complex brine movement. A follow-up study will employ a threedimensional numerical model to simulate the threedimensional movement of saltwater in the Changjiang estuary, considering only saltwater spilling over from the North Branch, only saltwater intrusion from the downstream though the South Branch, as well as the actual situation of brine movement in the Changjiang River estuary. Through comparative analysis, the interactions of these two different sources of brine and their contributions to the saltwater intrusion may be determined.
5 DATA AVAILABILITY STATEMENTSequence data used to calibrate the mode and support the findings of this study have been deposited in the Survey Bureau of Hydrology and Water Resources of the Changjiang River estuary. http://www.cjh.com.cn/pages/swcy_jj.html.
Chatwin P C. 1976. Some remarks on the maintenance of the salinity distribution in estuaries. Estuarine and Coastal Marine Science, 4(5): 555-566.
DOI:10.1016/0302-3524(76)90030-X |
Fan Z Y, Ge J Z, Ding P X, Pan L Z. 2012. Effect of the deep waterway project on the salinities in the North Passage of the Changjiang Estuary. Journal of East China Normal University (Nature Science), (4): 181-189.
(in Chinese with English abstract) |
Festa J F, Hansen D V. 1976. A two-dimensional numerical model of estuarine circulation:the effects of altering depth and river discharge. Estuarine and Coastal Marine Science, 4(3): 309-323.
DOI:10.1016/0302-3524(76)90063-3 |
Fischer H B. 1967. The mechanics of dispersion in natural streams. Journal of the Hydraulics Division, 93(6): 187-216.
|
Gong W P, Shen J. 2011. The response of salt intrusion to changes in river discharge and tidal mixing during the dry season in the Modaomen Estuary, China. Continental Shelf Research, 31(7-8): 769-788.
DOI:10.1016/j.csr.2011.01.011 |
Hansen D V, Rattray M. 1965. Gravitational circulation in straits and estuaries. Journal of Marine Research, 23(2): 104-122.
|
Hou C C, Zhu J R. 2013. The response time of saltwater intrusion in the Changjiang River Estuary to the change of river discharge in dry season. Acta Oceanologica Sinica, 35(4): 29-35.
(in Chinese with English abstract) |
Jiang C J, de Swart H E, Li J F, Liu G F. 2013. Mechanisms of along-channel sediment transport in the North Passage of the Yangtze Estuary and their response to large-scale interventions. Ocean Dynamics, 63(2-3): 283-305.
DOI:10.1007/s10236-013-0594-4 |
Knudsen M. 1900. Ein hydrographischer Lehrsatz. Annalen der Hydrographie und Maritimen Meteorologie, 28(7): 316-320.
|
Kong Y Z, He S L, Ding P X, Hu K L. 2004. Characteristics of temporal and spatial variation of salinity and their indicating significance in the Changjiang Estuary. Acta Oceanologica Sinica, 26(4): 9-18.
(in Chinese with English abstract) |
Li L, Zhu J R, Wu H. 2012. Impacts of wind stress on saltwater intrusion in the Yangtze Estuary. Science China Earth Sciences, 55(7): 1 178-1 192.
DOI:10.1007/s11430-011-4311-1 |
Mao Z C, Shen H T. 1993. Effects of freshwater discharge at the Datong station on saltwater intrusion in the south channel of the Changjiang Estuary. Marine Sciences, 17(2): 60-63.
(in Chinese with English abstract) |
Maréchal D. 2004. A Soil-Based Approach to Rainfall-Runoff Modelling in U-Ngauged Catchments for England and Wales. PhD thesis. Cranfield University.
|
Pan J X, Wu D A, Xie X X. 2016. The harmonic analysis of tidal currents in the radial sand ridge in the deep water channel of Yangtze Estuary. Science Technology and Engineering, 16(7): 80-85.
(in Chinese with English abstract) |
Park K, Kuo A Y. 1996. Effect of variation in vertical mixing on residual circulation in narrow, weakly nonlinear estuaries. In: Aubrey D G, Friedrichs C T eds. Buoyancy Effects on Coastal and Estuarine Dynamics. American Geophysical Union, Washington DC. p.301-317.
|
Shaha D C, Cho Y K, Kim T W. 2013. Effects of river discharge and tide driven sea level variation on saltwater intrusion in Sumjin River Estuary:an application of finite-volume coastal ocean model. Journal of Coastal Research, 29(2): 460-470.
|
Shao Y C. 2014. Study on Activities and Concentration of Salt water Group from the North Branch in Yangtze River Estuary. Hohai University, Nanjing, China. (in Chinese with English abstract)
|
Shen H T, Mao Z C, Zhu J R. 2003. Saltwater Intrusion in the Changjiang Estuary. China Ocean Press, Beijing, China.
(in Chinese)
|
Shen H T, Wang X C, Yang Q S. 2000. The spectrum analysis of discharge and salinity in the Changjiang Estuary. Acta Oceanologica Sinica, 22(4): 17-23.
(in Chinese with English abstract) |
Wang B, Zhu J R, Wu H, Yu F J, Song X J. 2012. Dynamics of saltwater intrusion in the Modaomen Waterway of the Pearl River Estuary. Science China Earth Sciences, 55(11): 1 901-1 918.
DOI:10.1007/s11430-012-4371-x |
Wu D A, Shao Y C, Pan J X. 2015. Study on activities and concentration of saline groupin the South Branch in Yangtze River Estuary. Procedia Engineering, 116: 1 085-1 094.
DOI:10.1016/j.proeng.2015.08.349 |
Wu H, Zhu J R, Chen B R, Chen Y Z. 2006. Quantitative relationship of runoff and tide to saltwater spilling over from the North Branch in the Changjiang Estuary:a numerical study. Estuarine, Coastal and Shelf Science, 69(1-2): 125-132.
DOI:10.1016/j.ecss.2006.04.009 |
Wu H, Zhu J R, Choi B H. 2010. Links between saltwater intrusion and subtidal circulation in the Changjiang Estuary:a model-guided study. Continental Shelf Research, 30(17): 1 891-1 905.
DOI:10.1016/j.csr.2010.09.001 |
Wu H, Zhu J R. 2007. Analysis of the transport mechanism of the saltwater spilling over from the North Branch in the Changjiang Estuary in China. Acta Oceanologica Sinica, 29(1): 17-25.
(in Chinese with English abstract) |
Xiao C Q, Shen H T. 1998. The analysis of factors affecting the saltwater intrusion in Changjiang Estuary. Journal of East China Normal University (Natural Science), (3): 74-80.
(in Chinese with English abstract) |
Xue P F, Chen C S, Ding P X, Beardsley R C, Lin H C, Ge J Z, Kong Y Z. 2009. Salt water intrusion into the Changjiang River:a model-guided mechanism study. Journal of Geophysical Research, 114(C2): C02006.
|
Zhang W S. 2005. Numerical Modeling of Tides Wave in Margin Seas Near China. Hohai University, Mianzhou, China. (in Chinese with English abstract)
|
Zhu J R, Fu L H, Wu H. 2008. Impact of wind stress and Coriolis force on the freshwater zone near Meimaosha in the Changjiang Estuary. Journal of East China Normal University (Natural Science), (6): 1-8, 39.
(in Chinese with English abstract) |
Zhu J R, Wu H, Li L, Wang B. 2010. Saltwater intrusion in the Changjiang Estuary in the extremely drought hydrological year 2006. Journal of East China Normal University(Natural Science), (4): 1-6.
(in Chinese with English abstract) |
Zhu J R, Wu H. 2013. Numerical simulation of the longest continuous days unsuitable for water intake in the Dongfengxisha reservoir of the Changjiang Estuary. Journal of East China Normal University (Natural Science), (5): 1-8, 26.
(in Chinese with English abstract) |
Zhu S X, Zhu J R, Sha W Y. 1999. A Numerical Study on the impact of M2 tide on the expansion of the Changjiang River diluted water in summer. Oceanologia et Limnologia Sinica, 30(6): 711-718.
(in Chinese with English abstract) |