 2019, Vol. 37
Institute of Oceanology, Chinese Academy of Sciences
Article Information
- GUO Yaru, RONG Zengrui, LI Bo, XU Zhao, LI Pixue, LI Xiaodan
- Physical processes causing the formation of hypoxia off the Changjiang estuary after Typhoon Chan-hom, 2015
- Journal of Oceanology and Limnology, 37(1): 1-17
- http://dx.doi.org/10.1007/s00343-019-7336-5
Article History
- Received Nov. 17, 2017
- accepted in principle Jan. 22, 2018
- accepted for publication Feb. 5, 2018


2 Qingdao National Laboratory for Marine Science and Technology, Qingdao 266237, China;
3 Marine Science and Technology College, Zhejiang Ocean University, Zhoushan 316022, China;
4 Shanghai Marine Environmental Monitoring and Forecasting Center, Shanghai 200062, China
Dissolved oxygen (DO) concentration is an important indicator of the environmental conditions reflecting estuarine and marine life (Engle et al., 1999). Hypoxia will come into being when DO is less than 2.0 mg/L or 62.5 μmol/L (Diaz, 2001; Wei et al., 2007). Severe hypoxia has been observed world widely, including the Chesapeake Bay, the Gulf of Mexico, the Black Sea, the Tokyo Bay, and the Changjiang estuary, and is becoming a global environmental issue (Winstanley, 1999; Diaz, 2001; Bianchi et al., 2010; Zhang et al., 2010). Once formed, the hypoxia will threaten the aquatic organisms and make them behave aberrantly, resulting in reduction of marine species diversity and even deterioration of ecosystem structure and function (Tyson and Pearson, 1991; Yin et al., 2004; Diaz and Rosenberg, 2008; Zheng et al., 2016).
Low DO (i.e., < 3.0 mg/L) off the Changjiang estuary can be traced back to 1959 (Gu, 1980) and the evidence of summer hypoxia was found in early 1980s (Wei et al., 2007). Chen et al. (2007) showed that the Changjiang estuary was one of the largest costal hypoxia areas over the world, and an enlarging trend was observed since later 1990s (Wang, 2009). The spatial and temporal variations of hypoxia off the Changjiang estuary have got more and more attention recently (Wei et al., 2011; Liu et al., 2012; Wang et al., 2012).
The hypoxia off the Changjiang estuary is formed by series of complicated physical and biogeochemical processes. It is generally agreed that the internal biochemical feedback (Kemp et al., 1997; Cloern, 2001; Jia and Peng, 2003; Dagg et al., 2007) and external physical feedback (Li et al., 2002, Goñi et al., 2006; Lin et al., 2008; Justić and Wang, 2014) are two of the main reasons. Liu et al. (2012) suggested that the formation of hypoxia was not primarily induced by oxygen consumption but from lacking of replenishment after consumption. Wei et al. (2007) showed that the water off the Changjiang estuary interacting with Taiwan Warm Current (TWC) water contributed to the occurrence of strong halocline, which maintained the hypoxia area. Zhu et al. (2015) also concluded that salinity induced density stratification contributing to the hypoxia formation. Based on the observations, Lin et al. (2014) further concluded that there was a strong correlation between thermocline intensity and DO vertical gradient. Thus, hypoxia can occur only if the stratification is persistent over a considerable duration without DO replenishment. Furthermore, Zheng et al. (2016) concluded that the stronger the stratification, the lower concentration of bottom dissolved oxygen. Various physical processes may influence stratification. The strong stratification and the resultant hypoxia off the Changjiang estuary are found to originate from the co-action of the surface Changjiang Diluted Water (CDW) and the bottom northward TWC (Li et al., 2002; Wang, 2009). Strong wind associated with typhoons, monsoons and cold airs may weaken or break the stratification and thus hypoxia (Wei et al., 2007; Wilson et al., 2008; Sotto et al., 2014).
Since stratification is significant to the formation and maintenances of hypoxia, the mixing processes associated with strong wind events would break down both stratification and hypoxia. Chen et al. (2015) pointed out that DO of bottom layer did not recover to its pre-typhoon level until about two weeks after Typhoon Meifus. Ni et al. (2016) showed that it took about 15–19 days for the second hypoxia event to come into being after the Typhoon Marokot. However, a cruise taking over the Changjiang estuary two days after Typhoon Chan-hom, 2015 showed that hypoxia was observed to the east of Chanjiang estuary, where the water depth is about 45–60 m (Figs. 1, 2). The DO was observed as low as 2 mg/L. The low oxygen occupied a large part of the water column, from about 25 m to the bottom, with a thickness of about 25 m. The hypoxia was accompanied with a well-mixed bottom boundary layer, with a strong temperature or salinity gradient above. The physics controlling the formation of hypoxia is still unclear. It's worth to investigate how it survived from the strong mixing induced by typhoon and whether it's locally formalized or horizontally advected?

|
| Fig.1 Observed profiles of temperature (red), salinity (green), oxygen (blue) at station (a) A05, (b) B04 and (c) C04 Their locations are shown in Fig. 2b. |

|
| Fig.2 ROMS model domain and mesh grids (every 3 lines) (a); bathymetry in the Changjiang River estuary and surrounding zone (b) Solid lines show the cruise survey transections in the Changjiang River mouth region in 2015. The dashed line shows the trajectory of typhoon Chan-hom. |
This paper is devoted to understanding the physical processes controlling the formation of hypoxia. We have investigated the temporal evolution of the stratification during and after typhoon Chan-hom. We find that the stratification is maintained in the deep canyon during Chan-hom and enhanced by the plume spreading and the surface heating after Chan-hom. Lacking of replenishment is considered to be one of the most important reasons for the maintenance of hypoxia. The rest of this paper is organized as follows. Cruise survey and wind data are described in Section 2. Numerical model description and verification are presented in Section 3. Modeling results and the mechanisms analysis are provided in Sections 4. Discussion is given in Section 5, followed by conclusions in Section 6.
2 TYPHOON CHAN-HOM, 2015 AND HYDROGRAPHIC SURVEYChan-hom is the No. 9 typhoon of 2015, and is the first typhoon affecting the East China Sea, 2015. Figure 3a shows the best estimate of the path of Chanhom, provided by the Joint Typhoon Warning Center (JTWC), with a sampling interval of 6 hours. Chanhom was formed on June 29, 2015 on the Western Pacific Ocean, and strengthened slowly as it moved northwestward. It moved into the East China Sea on July 10 as a Supper Typhoon of Category 6, and made its first landfall on the south of Hangzhou Bay near July 11, 06:00 UTC. It then turned northeast with weakened wind and made its second landfall on the Korean Peninsula on July 12, 18:00 UTC as a Tropical Depression. The peak of Chan-hom occurred sometime between 00:00 and 06:00 on July 10, with the maximum speed of about 55 m/s.

|
| Fig.3 The surface wind field on July 11, 12:00 UTC, 2015 (a); comparison between the observed (red) and the synthesized (blue) wind velocity at Tanhu Island (30.61°N 121.62°E) near the Changjiang estuary (b), and the wind direction (c) Arrows are wind vectors and colors are wind speed. The trajectory and the strength of Chan-hom are shown by the dot line. The typhoon maximum wind speed (green) is also superimposed in (b) for comparison. |
As shown in Fig. 3a, Chan-hom had weakened before its first landfall, and continued to lose strength as it passed by the Changjiang estuary. It kept affecting the East China and Yellow seas through July 10–12. Figure 3b and c show the wind speed and direction recorded at Tanhu Island (121.62°E, 30.61°N), located very near the Changjiang estuary. As shown in Fig. 3b, the observed wind increased from July 10, 00:00 UTC to July 11, 00:00 UTC, and then decreased down to about 6 m/s rapidly on July 12, 18:00 UTC after typhoon passing. The maximum wind recorded at Tanhu Island was about 30 m/s on July 10, 23:00 UTC.
A hydrographic cruise survey was conducted off the Changjiang estuary from July 14 to July 15, 2015, immediately after Chan-hom. A SBE 25 plus CTD with SBE-43 DO sensor was used to collect temperature, salinity and DO profiles at 13 stations. The SBE-43 DO sensor had been calibrated prior to the cruise and compared with DO measurement using titration method after the cruise. Figure 2b illustrates the cruises transects and the CTD sampling stations. The cruise survey was implemented under southeasterly wind and neap tide conditions. Hypoxia was found at three stations, i.e., A05, B04 and C04, as shown in Fig. 1. DO distribution showed that the thickness of the hypoxia water reached 20–30 m at A05, B04, and 10 m at C04. The hypoxia water column was accompanied with a well-mixed bottom boundary layer, with a strong temperature or salinity gradient above. It is worth to note that A05 and B04 are located inside the submarine river canyon, while C04 is located in the southwestern end of the canyon. Hypoxia was frequently found off the Changjiang estuary during summer (Li et al., 2002; Wang, 2009), but was rarely reported after typhoon. The underlying physics need further investigation.
3 MODEL DESCRIPTION AND VALIDATIONThe hydrodynamic model is an implementation of the Regional Ocean Modeling System (ROMS; Haidvogel et al., 2000; Shchepetkin and McWilliams, 2005) for the East China Seas (Li and Rong, 2012; Rong and Li, 2012). The model domain covers the Changjiang River estuary, the East China and Yellow seas, and a part of the continental shelf break opening up to the North Pacific Ocean. Figure 2a shows the model's horizontal grid system. An orthogonal curvilinear coordinate system has been designed to follow the orientation of coastline. The grid size is about 3 km over the inner shelf region but increases gradually to 10 km at the offshore boundary. The total number of grid points is 362×242. Twenty layers are set in the vertical direction with refined surface and bottom layers. The stretching parameters for the vertical grid are θS=5 and θB=0.4, as defined in the S-coordinate system (Song and Haidvogel, 1994). The vertical eddy viscosity and diffusivity are calculated using the k-kl turbulence closure scheme (Umlauf and Burchard, 2003; Warner et al., 2005a) with the background viscosity and diffusivity setting to 10-5 m2/s. The horizontal eddy viscosity and diffusivity are scaled to grid size, with the maximum setting to 50 m2/s. A quadratic stress is exerted at the bed, assuming that the bottom boundary layer is logarithmic with a bottom roughness height of 1 mm (Rong and Li, 2012).
The model is forced by freshwater inflows at riverheads, open ocean tides and currents at the lateral boundary, wind and heat exchange across the water surface. Tidal forcing at the open boundary is specified using Oregon State University (OSU) global inverse tidal model of TPXO 7.2 (Egbert et al., 1994; Egbert and Erofeeva, 2002). Four major tidal components, M2, S2, K1, O1, are considered at the open boundary, which account for 90% of the total tidal variability in the region. At the open boundary, we adopt the Chapman/Flather boundary condition for sea surface elevation and depth averaged flow (Flather, 1976; Chapman, 1985), and the Orlanski-type radiation condition for the baroclinic components (Orlanski, 1976). A nudging region is specified along the six outer cells of the model domain, where the ROMS model is nudged toward HYCOM daily data. The nudging time scale used is 1 day at the boundaries with a sinusoidal decay to the interior. The same nudging time scale is used for the incoming and outgoing information. The advantage of this nesting approach has been discussed in Barth et al. (2008).
Freshwater input from the Changjiang River is specified using daily river discharge measured at Datong station by the Ministry of Water Resources of the Yangtze River Water Resources Commission. At the riverine boundary of Changjiang River, daily discharge is prescribed as momentum boundary condition on the depth-averaged velocity that is equal to the river discharge divided by the upstream crosschannel area. The river channel has been extended eastward by 200 km to offer this simple but explicit boundary condition of unidirectional seaward transport with a salinity of zero (Li and Rong, 2012; Rong and Li, 2012). The temperature of the input freshwater is set to be the local air temperature.
Atmospheric forcing for the model includes 6-hourly surface wind speed, short wave radiation, air temperature, air pressure, relative humidity, cloud and precipitation from the National Centers for Environmental Prediction (NCEP) reanalysis Ⅱ data set. Long wave radiation is computed internally within ROMS. The NCEP winds are relatively coarse, so that typhoon winds are poorly resolved, if present at all. During Chan-hom, the winds are modified by introducing synthetic typhoon winds based on JTWC tropical cyclone vitals database. This database contains cyclone location, intensity, and structure information. An asymmetric empirical wind field is calculated based on this dataset following Bueti et al. (2014) and then merged to NCEP reanalyzed wind. The NCEP reanalyzed wind is replaced by asymmetric wind inside the radial region with distances less than seven times of the radius of maximum wind (RMW) and then gradually transmits to NCEP wind between seven to eight times of RMW. Comparison with the observed wind shows that the blended wind matches the observation reasonably well.
Wind vectors were recorded continuously during Chan-hom passage at three islands near the Changjiang River estuary, the Xiaoqushan Island (30.53°N, 121.27°E), the Dajishan island (30.81°N, 122.17°E) and the Tanhu Island (30.61°N, 121.62°E). Figure 3b shows the details of wind measurements at Tanhu Island, superimposed with the blended wind and maximal sustained wind speed from JTWC. Wind direction and speed are similar at the three stations. The observed peak winds of 30 m/s occurred sometime between 00:00 and 06:00, July 11 at Tanhu Island, and blew northeastward. At the mean time, the maximum wind at central Chan-hom was only of about 38 m/s. Thus Chan-hom had weakened to a Strong Tropical Storm when passing by the Chanjiang estuary. The correlation coefficients between the observed wind and the blended wind are estimated to be 0.8 and 0.7, for wind speed and wind direction, respectively (e.g., see Allen et al., 2007 for definitions). The blended wind resembles the observation reasonably well and is used to force the ROMS model during Chan-hom.
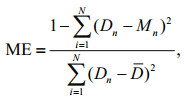
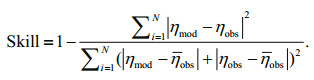
The present ROMS model is initially developed by Rong and Li (2012) to investigate the tidal effects on the Changjiang River plume. The model's capacity in reproducing the tidal system has been well validated by Rong and Li (2012) and Li and Rong (2012). Here we mainly assess the model capability in simulating a realistic temperature and salinity field. We have compared the model simulated temperature with the satellite observations firstly. The OSTIA (Operational SST and Sea Ice Analysis) SST at Met Office is used here. The OSTIA system produces a high resolution (1/20°) daily analysis of the current SST over the global ocean. OSTIA uses satellite data provided by the GHRSST project together with in situ observations to determine the SST (Stark et al., 2007). Figure 4 shows the comparison of model simulated SST and the satellite observation pre-, during, and post- Chanhom. The temperature off the Changjiang estuary is as high as 24℃ on July 8 before Chan-hom approaching the Changjiang estuary, and a cold tongue is observed along the Zhejiang coastline due to upwelling caused by the southerly monsoon wind. The temperature is about 2 degrees higher in the near field of the Changjiang estuary than in the mid-field. During Chan-hom on July 11, the SST is decreased due to wind mixing and entrainment, a cold trail is observed along the typhoon track. After Chan-hom passage on July 14, the SST has restored quickly, and the SST off the Changjiang estuary is even higher than pre- Chanhom. The simulated SST off the Changjiang estuary resembles the observations relatively well. The simulated cooling off the Changjiang estuary is slightly stronger than OSTIA SST and shows more details than OSTIA SST (Fig. 4e, f). This might be due to the temporal and spatial smoothing used in the OSTIA system, which filters out some details and weakens the signals (Stark et al., 2007, Donlon et al., 2012). Further comparison between the OSTIA SST and the in-situ cruise data shows that OSTIA SST is also slightly higher than observations, indicating OSTIA SST may be over-smoothed. The correlation between the observed and the simulated SST off the Changjiang estuary is larger than 0.82 after removing the seasonal signal, which is known to be well reproduced. The simulated temperature and salinity vertical profiles are also compared with the in-situ observations. Figure 5 shows the T-S profiles at the four offshore stations A04, A05, B04 and C04. As shown in Fig. 5, the low salinity plume water is observed in the upper layer of the four stations. Strong thermoclines exist in both the observation and the model simulation. Both the temperature and salinity have been well simulated. Data through the whole water column is used to assess the Nash Sutcliffe Model Efficiency (ME: Nash and Sutcliffe, 1970; Allen et al., 2007) and the model skill (Warner et al., 2005b):
 (1)
(1) (2)
(2)

|
| Fig.4 Comparison between OSTIA SST (a–c) and model simulated SST (d–f) on July 8 (a and d), 11 (b and e) and 14 (c and f) |

|
| Fig.5 Comparison between model simulated (solid line) and observed (dash line) temperature (red line) and salinity (blue line) profiles at station (a) A04, (b) A05, (c) B04, and (d) C04 |
The D in Eq.1 is the observation, M is the corresponding model estimate and the overbar indicates the mean of the data set for the chosen variable. N is the total number of the model data and n is the nth comparison. Performance levels are categorized as excellent for ME > 0.65, very good for ME between 0.5–0.65, good for ME between 0.2–0.5 and poor for ME < 0.2. The η in Eq.2 is the variable being compared. η is time mean of η, and the simulated and observational results are denoted by the subscripts mod and obs, respectively. Hence, perfect agreement between model results and observations will yield a skill of one and complete disagreement yields a skill of zero. The overall model efficiency and model skill for temperature and salinity are 0.68, 0.86, 0.68 and 0.87, respectively. The river plume regions are known to be baroclinicly instable and full of sub-mesoscale eddies (Isobe, 2004; Chen et al., 2008; Hetland, 2017). Given the small spatial and temporal scale energetic features, the present model reproduces the temperature and salinity reasonably well. We thus conclude that the present model is able to be used to investigate the physical processes during Chan-hom.
4 RESULTStratification plays a significant role in the formation and maintenance of hypoxia (Wei et al., 2007; Park et al., 2011; Zhu et al., 2015). The time evolution of the stratification off the Changjiang estuary and the underlying physics are investigated in this section.
4.1 General description of the oceanic responseWe first introduce the tracer and circulation patterns during and post-typhoon Chan-hom. Figure 6 shows the SST and SSS superimposed with the surface and bottom current, respectively. As shown in Fig. 6a, a surface cooling of about 3 degrees lower than the nearshore region is detected to the east of the Changjiang estuary. An asymmetric anti-clockwise cell is formed east of the Changjiang estuary, with the right side stronger than the left side. The surface cooling on the right side is also larger than the left side. The left to right asymmetry of the oceanic response results from the asymmetry in the wind field and the air-sea interaction, which have been well documented in previous studies (e.g. Price et al., 1994). In response to typhoon wind, the low salinity plume water is confined to the vicinity of estuary, forming a strong buoyancy coastal current flowing southward along the Zhejiang coast, with the surface current about 2 times larger than the bottom. Further offshore, a northward intrusion of the bottom water is detected (Fig. 6c).

|
| Fig.6 Model simulated SST (a, b) and SSS (c, d) on July 11 (a, c) and July 14 (b, d) The de-tided current at the surface and the bottom layer are superimposed on (a, b) and (c, d) respectively. |
The surface temperature and the circulation restored quickly after Chan-hom passage. The surface current is weakened and the SST has increased by about 3 degrees among the whole domain, especially in the cool trail region (Fig. 6b). The surface cooling during typhoon has now been rewarmed. The Changjiang River plume water flow east- and southeast-ward at the river mouth region and occupies a larger area than during Chan-hom. The bottom southward current at the offshore side intrudes further north and onshore than during Chan-hom (Fig. 6c, d), indicating a strengthened intrusion of TWC.
4.2 Time evolution of stratificationWe then examine the time evolution of temperature and salinity profiles at observational station A05, locating inside the submarine deep canyon. As shown in Fig. 3b, Chan-hom has being weakened before it passing through the Chanjiang estuary. The maximum wind speed documented at station A05 is only of about 30 m/s on July 11, 14:00 UTC (Fig. 7a). Meanwhile, it is neap tide with weakest tide mixing over the Changjiang estuary (Fig. 7b). The depth of the surface mixed layer is about 10 m prior- Chanhom and was mixed to about 25 m when Chan-hom passing (Fig. 7c, d). After Chan-hom passing, the upper surface layer re-warms quickly and is reoccupied by low salinity plum water, and the water column remains stratified. The strong tidal mixing accompanied with coming spring tide forms a deeper bottom boundary layer. A warming is also found for the bottom water temperature but no freshening for the bottom salinity, indicating it's not a pure vertical mixing processes.

|
| Fig.7 Time evolution of (a) the wind speed (blue), (b) the tidal elevation, (c) temperature and (d) salinity at station A05 The red line in (a) indicates the shifted wind by 7 days for additional model experiment. The thick dashed line represents the time of maximum typhoon wind and the red shadow marks the cruise time. |
The surface-bottom temperature and salinity differences are chosen as the indication of stratification to further examine the time evolution of the stratification. Figures 8 and 9 show the surfacebottom temperature and salinity difference, respectively. As shown in Fig. 8a and b, the temperature difference at the submarine canyon is of about 3–5 degrees before Chan-hom approaching. It begins to decrease from July 11, with the minimum temperature difference of about 2℃ occurring on July 12. Further analysis shows that the decrease of temperature difference is mainly due to the temperature decrease in the surface mixed layer (Fig. 7c). The stratification restores quickly after typhoon passing. The surface-bottom temperature difference has recovered to the pre-typhoon value on July 13. The surface layer keeps warming through July 14, and the surface layer is even warmer than pre- Chan-hom level, indicating an enhanced stratification after typhoon.

|
| Fig.8 The surface-bottom temperature difference from July 9 to July 14 The snapshots at 12:00 UTC of each day are shown. The dashed line represents typhoon track and the green circle marks the center of typhoon. |

|
| Fig.9 Same as Fig. 8, except for the surface-bottom salinity difference |
Figure 9 shows the surface-bottom salinity difference from July 9 to July 14. In contrast to the temperature (Fig. 8), large surface-bottom salinity difference locates at the plume bulge region and the buoyancy driven coastal current region. Before typhoon approaching, large salinity stratification of about 3–8 is observed in the submarine canyon area. It starts to decrease from July 10 and down to its minimum on July 11. The salinity stratification restored quickly on July 12 from the south end of the canyon. The strong salinity stratification has completely recovered by July 13. It is worth to note that the temperature and salinity difference reaches their minimum in different time. For example, when the surface-salinity difference reaches its minimum on July 11 (Fig. 9c), the temperature remains well stratified (Fig. 8c), suggesting it is not a purely vertical mixing process; otherwise both the temperature and the salinity would reach their minimum at the same time. Horizontal advection associated with typhoon might be responsible for these.
By diagnosing the temperature and salinity difference between the surface and bottom layers, we have shown that the stratification is not completely destroyed during typhoon Chan-hom. The deep canyon water may be horizontally shifted but is maintained during typhoon Chan-hom, 2015. After typhoon passing, both the temperature and salinity recover to its pre-typhoon level quickly, and the stratification is even enhanced, facilitating the property maintenance of the deep canyon water.
4.3 Heat budget diagnosesAs shown in Section 4.2, the stratification is maintained somehow during typhoon. It's worthwhile to investigate the underlying dynamics. We take the heat budget equation to analyze the temperature variation, as temperature has similar vertical profile with the dissolved oxygen (Fig. 1). The diagnostics equation of temperature used in ROMS model is formulated as following:
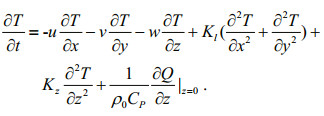 (3)
(3)Here, T is the temperature, t is time, u, v, and w are the cross-shelf, along-shelf and vertical components of velocity. Kl and Kz are the horizontal and vertical diffusivity coefficients, respectively. Q, ρ0, and CP represent the surface net heat flux, the reference density and the specific heat capacity of seawater, respectively. The left hand side of Eq.3 expresses the rate of temperature change. The first three terms on the rhs of Eq.3 express the oceanic advection of heat. The fourth, fifth and sixth terms in the rhs of Eq.3 express the heat flux due to horizontal diffusion, vertical mixing and air-sea heat exchange, respectively.
Figure 10 shows time series of temperature changing rate, and contributions due to oceanic advection and vertical mixing in the upper 65 m from July 5 to July 17 over the deep canyon. A 25-hour mean has been applied to filter out tidal effects. The individual horizontal and vertical advection terms are combined into a single term, as the horizontal heat flux divergence is largely compensated by the vertical heat flux convergence. The horizontal diffusion term is one order smaller and not shown here, and the effects of the surface heat flux are explored in next section. In response to typhoon, a cooling/warming tendency in the surface/sub-surface is observed from July 9 through July 12. The surface temperature reached its minimum at about 16:00, July 11 and then restored gradually. The vertical mixing term and the temperature change rate show similar time evolution and magnitude, indicating that the vertical mixing term is responsible for most of the surface cooling and sub-surface warming when typhoon passing. Its effect drops off quickly after typhoon passing. The effect of the advection term, on the other hand, varies coherently through the water column and plays a negative role in the surface cooling and positive role in the sub-surface warming pre- typhoon approaching. Its sign changes to negative shortly when typhoon center passing by the deep canyon and recovers to positive during the relaxation stage after typhoon leaving. The positive-negative-positive effect of the advection term is considered to be related to changes in oceanic circulation during typhoon. Typhoons are apt to generate an asymmetric anti-clockwise oceanic circulation along the track and oceanic upwelling near typhoon center and dowelling at the outer region (Greatbatch, 1983; Price et al., 1994; Liu et al., 2014; Zhang et al., 2016), which play different roles at different stage of typhoon.

|
| Fig.10 Time evolution the diagnostic terms of temperature over the deep canyon from July 5 to July 17 Contour lines in both (a) and (b) express the rate of temperature change, i.e. the left hand side of Eq.3. Colors express the contribution due to (a) total oceanic advection and (b) vertical mixing, respectively. The rate of temperature change has been amplified by 105 for plotting convenience. |
As shown in Fig. 10, the deepening of the surface mixed layer attributes mostly to the strong vertical mixing induced by wind during typhoon. However, its effect is confined to the surface 40 m. Changes to oceanic temperature are also confined to this depth. As the temperature and oxygen have similar profiles (Fig. 1), the replenishment to oxygen due to vertical mixing may also be confined to the surface 40 m.
4.4 Mechanisms of re-stratificationSince hypoxia can occur only if the stratification is sustained over a considerable duration without DO replenishment. A quick restore of stratification after typhoon is important for the formation of hypoxia. We have shown that both the temperature and salinity recover to its pre-typhoon level quickly after typhoon passing (Figs. 7–9). It is interesting to explore how the quick and strong re-stratification occurs. Changes of surface net heat flux during typhoon are considered to play important roles for SST re-warming and are analyzed firstly.
Figure 11 shows the time series of the mean SST over the deep canyon region. As shown in Fig. 11, the SST decreased by about 1.5℃ during Chan-hom and increased by about 2.5℃ in two days after typhoon, even higher than the pre-typhoon value. We have examined the different component to the heat flux to understand the repaid warming post-Chan-hom. As shown in Fig. 11, the solar radiation flux changed dramatically during typhoon. It dropped to about 100 W/m2 when Chan-hom passing, and increased to about 330 W/m2 after Chan-hom passage. The solar radiation flux maintained a high value for three days and then turned to its pre-typhoon value. In addition to the solar radiation flux, the latent flux (LH), the sensible flux (SH) and the long wave radiation flux (LW) also change substantially during typhoon. The sensible flux increased to about 60 W/m2 during Chanhom, indicating the air-sea-sensible heat fluxes were from the atmosphere into the ocean. The outgoing latent heat flux and the longwave radiation flux had also decreased during typhoon passing. That is to say, while the reduced short wave radiation and the vertical mixing are apt to cool the surface when typhoon passing, changes in the sensible heat flux, latent heat flux and long wave radiation flux are apt to counterbalance the surface cooling effects.

|
| Fig.11 Time series of the SST, the latent heat flux (LH), sensible heat flux (SH), short-wave radiation (SW), long-wave radiation (LW) over the deep canyon during Chan-hom Positive indicates the ocean receiving energy from the atmosphere and vice versa. The red shadow marks the cruise time. |
The anomalous high solar isolation post-typhoon is considered to be responsible for the rapid warming after typhoon passage. After the passage of Chanhom, the weather was generally fair, with strong solar insolation, up to 330 W/m2 and light winds, approximately 6.5 m/s, for a period of 6 days. This would lead to significant warming of the ocean surface layer. A study by Price et al. (2012) showed that the rapid warming after typhoon was achieved through a diurnal warming of the ocean surface layer, trapped within about 10 m of the surface layer, with a warm speed of about 1℃ amplitude some days. The near-surface warming was very strongly correlated with the cool anomaly of the relic surface mixed layer, showing that the cool trail either receives anomalous solar insolation, or loses less heat by the sum of the SST-dependent sensible and latent heat fluxes.
In addition to changes in surface heat flux, the current associated with the Changjiang River plume also plays a role. As shown in Fig. 6, the shallow near shore water warms greater and faster than the offshore deep water. The warmed nearshore water will then be transported offshore by the buoyancy current and facilitates the near-surface warming in the deep canyon region (Fig. 6), which is consistent with previous studies (Wang, 2009; Zhu et al., 2015). Meanwhile, the buoyancy current transports the low salinity plume water offshore, helps the salinity recover to the pre-typhoon level and forms a strong halocline, thus enhances the stratification and inhibits the vertical oxygen exchange.
5 DISCUSSIONNi et al. (2016) suggested that the DO consumption rate is 0.2 mg/L/day over the Changjiang estuary. Given an initial concentration of 4.7 mg/L in the Changjiang estuary (Zhu et al., 2013), two weeks are needed to form the observed hypoxia of about 2.0 mg/L. Thus the observed hypoxia at the deep canyon east of Changjiang estuary is unlikely newly formed. Our results show that the stratification over the deep canyon region is not fully destroyed during typhoon. Thus the observed low oxygen water may originate from the residual water. In addition, the TWC is known to be able to intrude into the deep canyon off the Changjiang estuary in summer (Guan, 1994). It's characterized with high-salinity and lowoxygen. The 34.0 isohaline are generally used to identify the TWC water (Su et al., 1994; Wei et al., 2007) and its oxygen concentration is found to be less than 4.0 mg/L (Wang, 2009). Thus the northward TWC water may be the source of the deep canyon water. This idea is supported by the observed salinity at A05 and B04, where the observed salinity is of about 34 (Fig. 1). We further test this idea by showing the simulated salinity and currents at a cross-shelf section (30.8°N) over the deep canyon. Figures 12 and 13 show the along-shelf current and the corresponding salinity, respectively. A northward subsurface current is detected in the deep canyon on July 9. It turns to southward shortly on July 11 when Chan-hom passing but restore to northward quickly on July 12 and afterwards. The northward subsurface water can also be tracked by the salinity of 34 isohaline, indicating the northward intrusion of TWC (Fig. 13). Thus the low oxygen TWC water may be source of the deep canyon water, which is maintained and further strengthened after Chan-hom.

|
| Fig.12 The along-shelf current at a cross-shelf section (30.8°N) on (a) July 9, (b) July 11, (c) July 12 and (d) July 14 The dashed line marks the location where hypoxia was observed. |

|
| Fig.13 The salinity distributions at a cross-shelf section (30.8°N) on (a) July 9, (b) July 11, (c)July 12 and (d) July 14 The dashed line marks the location where hypoxia was observed. |
This idea is further solidified by a particle tracking experiment. 863 passive particles have been released in the subsurface from 40 m to the bottom in the deep canyon on July 9 pre- Chan-hom approaching. Their trajectories are then tracked. Figure 14 shows the horizontal and vertical positions of the particles by July 15. The particles move southward firstly by the southward current during Chan-hom (Fig. 12b) and then northward by the recovered TWC post- Chanhom (Fig. 12c, d). There are about 65% of particles remains in the deep canyon region (the dashed box in Fig. 14a) and more than 70% remains near the bottom by the cruise time. The particle tracking experiment suggests that there is a great chance that the properties of the deep canyon water are maintained during Chan-hom.

|
| Fig.14 The horizontal (a) and vertical (b) distribution of passive particles on July 15 by the cruise time The passive particles were released near the bottom (40 m-bottom) over the deep canyon on July 9 before typhoon approaching (purple). The final positions of particles are described by black cycles. |
It is also interesting to note that Chan-hom passing through the Changjiang estuary Region during the neap tide period. The wind induced surface mixed layer is separated from the tide generated bottom boundary layer. What if the strong typhoon wind occurs simultaneously with the spring tide? An experiment is further conducted to investigate the effects of varied tidal mixing in the spring-neap cycle. This is achieved by shifting the typhoon trajectory one week later to make it synchronize with the spring tide (Fig. 7a). The modeling results show that the water column in the deep canyon is not completely mixed either (figures now shown). This might result from the changes in initial stratification, which is further enhanced by offshore river plumes as typhoon shifting forward, or due to the relatively weak typhoon wind of about 30 m/s, which has been weakened when passing by the Chanajiang estuary (Fig. 3b).
6 SUMMARYThe Changjiang estuary is the place where hypoxia is frequently observed in summer, when the Changjiang plume water forming a strong stratification at the river mouth region. The strong wind-mixing associated with typhoon is apt to destroy the stratification and thus replenish oxygen in the deep water. Hypoxia is rarely detected soon after typhoon passing. However, a hydrographic cruise survey conducted off the Changjiang estuary from July 14 to July 15, 2015, two days after Typhoon Chan-hom, observed severe hypoxia in the deep canyon east of the Chanjiang estuary. The oxygen concentration reached as low as 2.0 mg/L and occupied a water column of about 25 m. A ROMS model was configured to study the underlying physics. There was strong stratification prior to typhoon approaching, providing favorable conditions for the formation of hypoxia in the deep water. Typhoon Chan-hom passed the Changjiang estuary from July 10 to July 11, during which its strength has been weekend to 30 m/s somehow. In the meantime, the tide was turned to neap tide when typhoon passing, with the tidal mixing reaching the minimum. The wind mixing mixed the water column to some extent but the stratification was maintained. Heat budget analysis showed that effects of vertical mixing were confined to the upper 40 m. After typhoon departure, the weather turned to fair, with strong solar radiation and light wind. Thus the surface layer warmed rapidly after typhoon passage, and helped enhance the stratification. Besides, the low salinity plume water spreads further offshore after typhoon passage. The associated halocline further strengthened the stratification and inhibited the vertical oxygen exchange.
The deep TWC water is characterized with high salinity class and low oxygen level. Northward intrusion of the TWC water was found prior to the passage of typhoon. The low oxygen TWC water might be the source of the deep canyon water. Some of the deep canyon water shifted southward during Chan-hom but most of them remained in the deep canyon both horizontally and vertically. Besides, the deep TWC water turned to northward soon after Chan-hom, which was also favorable for the formation of hypoxia.
Allen J I, Holt J T, Blackford J, Proctor R. 2007. Error quantification of a high-resolution coupled hydrodynamicecosystem coastal-ocean model:part 2. chlorophyll-a, nutrients and SPM. Journal of Marine Systems, 68(3-4): 381-404.
DOI:10.1016/j.jmarsys.2007.01.005 |
Barth A, Alvera-Azcárate A, Weisberg R H. 2008. Benefit of nesting a regional model into a large-scale ocean model instead of climatology. Application to the West Florida shelf. Continental Shelf Research, 28(4-5): 561-573.
|
Bianchi T S, DiMarco S F, Cowan Jr J H, Hetland R D, Chapman P, Day J W, Allison M A. 2010. The science of hypoxia in the Northern Gulf of Mexico:a review. Science of the Total Environment, 408(7): 1471-1484.
DOI:10.1016/j.scitotenv.2009.11.047 |
Bueti M R, Ginis I, Rothstein L M, Griffies S M. 2014. Tropical cyclone-induced thermocline warming and its regional and global impacts. Journal of Climate, 27(18): 6978-6999.
DOI:10.1175/JCLI-D-14-00152.1 |
Chapman D C. 1985. Numerical treatment of cross-shelf open boundaries in a barotropic coastal ocean model. Journal of Physical Oceanography, 15(8): 1060-1075.
DOI:10.1175/1520-0485(1985)015<1060:NTOCSO>2.0.CO;2 |
Chen C C, Gong G C, Shiah F K. 2007. Hypoxia in the East China Sea:one of the largest coastal low-oxygen areas in the world. Marine Environmental Research, 64(4): 399-408.
DOI:10.1016/j.marenvres.2007.01.007 |
Chen C S, Xue P F, Ding P X, Beardsley R C, Xu Q C, Mao X M, Gao G P, Qi J H, Li C Y, Lin H C, Cowles G, Shi M C. 2008. Physical mechanisms for the offshore detachment of the Changjiang Diluted Water in the East China Sea. Journal of Geophysical Research:Oceans, 113(C2): C02002.
|
Chen J Y, Ni X B, Liu M L, Chen J F, Mao Z H, Jin H Y, Pan D L. 2015. Monitoring the occurrence of seasonal low-oxygen events off the Changjiang estuary through integration of remote sensing, buoy observations, and modeling. Journal of Geophysical Research:Oceans, 119(8): 5311-5322.
|
Cloern J E. 2010. Our evolving conceptual model of the coastal eutrophication problem. Marine Ecology Progress Series, 210: 223-253.
|
Dagg M J, Ammerman J W, Amon R M W, Gardner W S, Green R E, Lohrenz S E. 2007. A review of water column processes influencing hypoxia in the northern Gulf of Mexico. Estuaries and Coasts, 30(5): 735-752.
DOI:10.1007/BF02841331 |
Diaz R J, Rosenberg R. 2008. Spreading dead zones and consequences for marine ecosystems. Science, 321(5891): 926-929.
DOI:10.1126/science.1156401 |
Diaz R J. 2001. Overview of hypoxia around the world. Journal of Environmental Quality, 30(2): 275-281.
|
Donlon C J, Martin M, Stark J, Roberts-Jones J, Fiedler E, Wimmer W. 2012. The operational sea surface temperature and sea ice analysis (OSTIA) system. Remote Sensing of Environment, 116: 140-158.
DOI:10.1016/j.rse.2010.10.017 |
Egbert G D, Bennett A F, Foreman M G G. 1994. TOPEX/POSEIDON tides estimated using a global inverse model. Journal of Geophysical Research:Oceans, 99(C12): 24821-24852.
DOI:10.1029/94JC01894 |
Egbert G D, Erofeeva S Y. 2002. Efficient inverse modeling of barotropic ocean tides. Journal of Atmospheric and Oceanic Technology, 19(2): 183-204.
DOI:10.1175/1520-0426(2002)019<0183:EIMOBO>2.0.CO;2 |
Engle V D, Summers J K, Macauley J M. 1999. Dissolved oxygen conditions in northern Gulf of Mexico estuaries. Environmental Monitoring and Assessment, 57(1): 1-20.
|
Flather R A. 1976. A tidal model of northwest European continental shelf. Memoires Societe Royale des Sciences de Liege, 10(6): 141-164.
|
Goñi M A, Gordon E S, Monacci N M, Clinton R, Gisewhite R, Allison M A, Kineke G. 2006. The effect of Hurricane Lili on the distribution of organic matter along the inner Louisiana shelf (Gulf of Mexico, USA). Continental Shelf Research, 26(17-18): 2260-2280.
DOI:10.1016/j.csr.2006.07.017 |
Greatbatch R J. 1983. On the response of the ocean to a moving storm:the nonlinear dynamics. Journal of Physical Oceanography, 13(3): 357-367.
|
Gu H K. 1980. The maximum value of dissolved oxygen in its vertical distribution in Yellow Sea. Acta Oceanologica Sinica, 2(2): 70-79.
(in Chinese with English abstract) |
Guan B X. 1994. Patterns and structures of the currents in Bohai, Huanghai and East China Seas. In: Zhou D, Liang Y B, Zeng C K eds. Oceanology of China Seas. Springer, Dordrecht, p.17-26.
|
Haidvogel D B, Arango H G, Hedstrom K, Beckmann A, Malanotte-Rizzoli P, Shchepetkin A F. 2000. Model evaluation experiments in the North Atlantic Basin:simulations in nonlinear terrain-following coordinates. Dynamics of Atmospheres and Oceans, 32(3-4): 239-281.
DOI:10.1016/S0377-0265(00)00049-X |
Hetland R D. 2017. Suppression of baroclinic instabilities in buoyancy-driven flow over sloping bathymetry. Journal of Physical Oceanography, 47(1): 49-68.
|
Isobe A. 2004. Ballooning of river-plume bulge and its stabilization by tidal currents. Journal of Physical Oceanography, 35(12): 2337-2351.
|
Jia G D, Peng P A. 2003. Temporal and spatial variations in signatures of sedimented organic matter in Lingding Bay(Pearl estuary), southern China. Marine Chemistry, 82(1-2): 47-54.
DOI:10.1016/S0304-4203(03)00050-1 |
Justić D, Wang L X. 2014. Assessing temporal and spatial variability of hypoxia over the inner Louisiana-upper Texas shelf:application of an unstructured-grid threedimensional coupled hydrodynamic-water quality model. Continental Shelf Research, 72: 163-179.
DOI:10.1016/j.csr.2013.08.006 |
Kemp W M, Smith E M, Marvin-DiPasquale M, Boynton W R. 1997. Organic carbon balance and net ecosystem metabolism in Chesapeake Bay. Marine Ecology Progress Series, 150: 229-248.
DOI:10.3354/meps150229 |
Li D J, Zhang J, Huang D J, Wu Y, Liang J. 2002. Oxygen depletion off the Changjiang (Yangtze River) estuary. Science in China Series D:Earth Sciences, 45(12): 1137-1146.
DOI:10.1360/02yd9110 |
Li M, Rong Z R. 2012. Effects of tides on freshwater and volume transports in the Changjiang River plume. Journal of Geophysical Research:Oceans, 117(C6): C06027.
DOI:10.1029/2011JC007716 |
Lin J, Xu H Z, Cudaback C, Wang D X. 2008. Inter-annual variability of hypoxic conditions in a shallow estuary. Journal of Marine Systems, 73(1-2): 169-184.
DOI:10.1016/j.jmarsys.2007.10.011 |
Lin J, Yan Q, Zhu J R, Gong F X. 2014. Analysis of thermocline and hypoxia off the Changjiang estuary in late summer. Journal of Fisheries of China, 38(10): 1747-1757.
(in Chinese with English abstract) |
Liu H X, Li D J, Gao L, Wang W W, Chen W Q. 2012. Study on main influencing factors of formation and deterioration of summer hypoxia off the Yangtze River estuary. Advances in Marine Science, 30(2): 186-197.
(in Chinese with English abstract) |
Liu Z H, Xu J P, Sun C H, Wu X F. 2014. An upper ocean response to Typhoon Bolaven analyzed with Argo profiling floats. Acta Oceanologica Sinica, 33(11): 90-101.
DOI:10.1007/s13131-014-0558-7 |
Nash J E, Sutcliffe J V. 1970. River flow forecasting through conceptual models part Ⅰ-a discussion of principles. Journal of Hydrology, 10(3): 282-290.
DOI:10.1016/0022-1694(70)90255-6 |
Ni X B, Huang D J, Zeng D Y, Zhang T, Li H L, Chen J F. 2016. The impact of wind mixing on the variation of bottom dissolved oxygen off the Changjiang estuary during summer. Journal of Marine Systems, 154: 122-130.
DOI:10.1016/j.jmarsys.2014.11.010 |
Orlanski I. 1976. A simple boundary condition for unbounded hyperbolic flows. Journal of Computational Physics, 21(3): 251-269.
DOI:10.1016/0021-9991(76)90023-1 |
Park T, Jang C J, Jungclaus J H, Haak H, Park W, Oh I S. 2011. Effects of the Changjiang river discharge on sea surface warming in the Yellow and East China Seas in summer. Continental Shelf Research, 31(1): 15-22.
DOI:10.1016/j.csr.2010.10.012 |
Price J F, Sanford T B, Forristall G Z. 1994. Forced stage response to a moving hurricane. Journal of Physical Oceanography, 24(2): 233-260.
|
Price J, Jayne S R, Rainville L, Centurioni L R, Chang Y, Morzel J. 2012. Cooling and warming of SST in the wake of typhoon Fanapi (2010). In: American Geophysical Union, Fall Meeting 2012, abstract id. OS34B-04.
|
Rong Z R, Li M. 2012. Tidal effects on the bulge region of Changjiang River plume. Estuarine, Coastal and Shelf Science, 97: 149-160.
DOI:10.1016/j.ecss.2011.11.035 |
Shchepetkin A F, McWilliams J C. 2005. The regional oceanic modeling system (ROMS):a split-explicit, free-surface, topography-following-coordinate oceanic model. Ocean Modelling, 9(4): 347-404.
DOI:10.1016/j.ocemod.2004.08.002 |
Song Y H, Haidvogel D. 1994. A semi-implicit ocean circulation model using a generalized topographyfollowing coordinate system. Journal of Computational Physics, 115(1): 228-244.
DOI:10.1006/jcph.1994.1189 |
Sotto L P, Jacinto G S, Villanoy C L. 2014. Spatiotemporal variability of hypoxia and eutrophication in Manila Bay, Philippines during the northeast and southwest monsoons. Marine Pollution Bulletin, 85(2): 446-454.
DOI:10.1016/j.marpolbul.2014.02.028 |
Stark J D, Donlon C J, Martin M J, McCulloch M E. 2007.OSTIA: an operational, high resolution, real time, global sea surface temperature analysis system. In: Proceedings of Europe OCEANS 2007. IEEE, Aberdeen, UK, p.1-4.
|
Su J L, Pan Y Q, Liang X S. 1994. Kuroshio intrusion and Taiwan warm current. In: Di Z, Yuan-Bo L, Cheng-Kui Z eds. Oceanology of China Seas. Springer, Dordrecht, p.59-70.
|
Tyson R V, Pearson T H. 1991. Modern and Ancient Continental Shelf Anoxia. The Geological Society, London.
|
Umlauf L, Burchard H. 2003. A generic length-scale equation for geophysical turbulence models. Journal of Marine Research, 61(2): 235-265.
DOI:10.1357/002224003322005087 |
Wang B D, Wei Q S, Chen J F, Xie L P. 2012. Annual cycle of hypoxia off the Changjiang (Yangtze River) estuary. Marine Environmental Research, 77: 1-5.
DOI:10.1016/j.marenvres.2011.12.007 |
Wang B D. 2009. Hydromorphological mechanisms leading to hypoxia off the Changjiang estuary. Marine Environmental Research, 67(1): 53-58.
DOI:10.1016/j.marenvres.2008.11.001 |
Warner J C, Geyer W R, Lerczak J A. 2005b. Numerical modeling of an estuary:a comprehensive skill assessment. Journal of Geophysical Research:Oceans, 110(C5): C05001.
DOI:10.1029/2004JC002691 |
Warner J C, Sherwood C R, Arango H G, Signell R P. 2005a. Performance of four turbulence closure models implemented using a generic length scale method. Ocean Modelling, 8(1-2): 81-113.
DOI:10.1016/j.ocemod.2003.12.003 |
Wei H, He Y C, Li Q J, Liu Z Y, Wang H T. 2007. Summer hypoxia adjacent to the Changjiang estuary. Journal of Marine Systems, 67(3-4): 292-303.
DOI:10.1016/j.jmarsys.2006.04.014 |
Wei Q S, Yu Z G, Xia C S, Zang J Y, Ran X B, Zhang X L. 2011. A preliminary analysis on the dynamic characteristics of the hypoxic zone adjacent to the Changjiang estuary in summer. Acta Oceanologica Sinica, 33(6): 100-109.
(in Chinese with English abstract) |
Wilson R E, Swanson R L, Crowley H A. 2008. Perspectives on long-term variations in hypoxic conditions in western Long Island Sound. Journal of Geophysical Research:Atmospheres, 113(C12): C12011.
|
Winstanley D. 1999. Hypoxia in the Gulf of Mexico. Environmental Science and Policy, 2(1): 1-3.
DOI:10.1016/S1462-9011(99)00013-1 |
Yin K D, Lin Z F, Ke Z Y. 2004. Temporal and spatial distribution of dissolved oxygen in the Pearl River estuary and adjacent coastal waters. Continental Shelf Research, 24(16): 1935-1948.
DOI:10.1016/j.csr.2004.06.017 |
Zhang H, Chen D K, Zhou L, Liu X H, Ding T, Zhou B F. 2016. Upper ocean response to Typhoon Kalmaegi (2014). Journal of Geophysical Research:Oceans, 121(8): 6520-6535.
DOI:10.1002/2016JC012064 |
Zhang J, Gilbert D, Gooday A J, Levin L, Naqvi S W A, Middelburg J J, Scranton M, Ekau W, Peña A, Dewitte B, Oguz T, Monteiro P M S, Urban E, Rabalais N N, Ittekkot V, Kemp W M, Ulloa O, Elmgren R, Escobar-Briones E, van der Plas A. 2010. Natural and human-induced hypoxia and consequences for coastal areas:synthesis and future development. Biogeosciences, 7(5): 1443-1467.
DOI:10.5194/bg-7-1443-2010 |
Zheng J J, Gao S, Liu G M, Wang H, Zhu X M. 2016. Modeling the impact of river discharge and wind on the hypoxia off Yangtze estuary. Natural Hazards and Earth System Sciences, 16(12): 2559-2576.
DOI:10.5194/nhess-16-2559-2016 |
Zhu J R, Zhu Z Y, Lin J, Wu H, Zhang J. 2015. Distribution of hypoxia and pycnocline off the Changjiang estuary, China. Journal of Marine Systems, 154: 28-40.
DOI:10.1016/j.jmarsys.2015.05.002 |
Zhu Z Y, Zhang J, Wu Y, Zhang Y Y, Lin J, Ji Q. 2013. Early degradation rate particulate organic carbon and phytoplankton pigments under different dissolved oxygen level off the Changjiang (Yangtze) river estuary. Oceanologia et Limnologia Sinica, 44(1): 1-8.
(in Chinese with English abstract) |