 2019, Vol. 37
Institute of Oceanology, Chinese Academy of Sciences
Article Information
- ZHENG Minwei, LI Xiao-Ming, SHA Jin
- Comparison of sea surface wind field measured by HY-2A scatterometer and WindSat in global oceans
- Journal of Oceanology and Limnology, 37(1): 38-46
- http://dx.doi.org/10.1007/s00343-019-7347-2
Article History
- Received Nov. 23, 2017
- accepted in principle Jan. 9, 2018
- accepted for publication Mar. 13, 2018


2 Laboratory for Regional Oceanography and Numerical Modeling, Qingdao National Laboratory for Marine Science and Technology, Qingdao 266235, China;
3 University of Chinese Academy of Sciences, Beijing 100049, China;
4 Hainan Key Laboratory of Earth Observation, Sanya 572029, China
Sea surface wind is one of the major air-sea interface dynamic parameters, and for several decades, it has been measured from space on large scale. Spaceborne scatterometer, radiometer, radar altimeter, and synthetic aperture radar (SAR) are the major microwave sensors that obtain sea surface wind information over the global oceans.
After the first scatterometer aboard the SeaSat-A satellite, scatterometers have provided global sea surface wind information for the past several decades, such as the C-band Scatterometers aboard ERS-1, ERS-2, the Advanced Scatterometers (ASACT) on Metop, and the Ku-band Scatterometer of NSCAT and QuikSCAT. These scatterometers either have three fan-beam antennas or have a rotating pencil beam, which can provide multiple measurements of sea surface radar backscatter in principle to determine two parameters, i.e., sea surface wind speed and direction. A mature method of deriving ocean wind vectors from spaceborne scatterometers is based on the empirical Geophysical Model Function (GMF), which relates the Normalized Radar Cross Section (NRCS) with radar measurement geometry and wind vectors. The improvement of GMF for better sea surface wind retrieval has been a long-term effort. The C-band GMFs of CMOD4 (Stoffelen and Anderson, 1997), CMOD-Ifremer (Quilfen et al., 1998), CMOD5 (Hersbach et al., 2007) / CMOD5N (Hersbach, 2010), and CMOD7 (Stoffelen et al., 2017) have been developed for twenty years. For the Ku-band scatterometers, GMFs of Ku-2011 (Ricciardulli and Wentz, 2015) and NSCAT-4 (OSI SAF, 2014) were proposed for QuikSCAT and OSCAT. Recently, an improved Ku-band GMF called NSCAT-5 (Wang et al., 2017) was developed, which considers the effects of sea surface temperature (SST) on wind retrieval from the Ku-band Scatterometer of RapidScat.
Calibration/validation of scatterometer wind retrievals is a necessary step to build up reliable operational products. It has been conducted in many studies by comparing in situ buoy measurements and numerical weather predictions, e.g., presented in (Verspeek et al., 2010; Vogelzang et al., 2011; Verhoef et al., 2017) as well as comparing with other radar retrievals of sea surface wind, e.g., from spaceborne SAR (Monaldo et al., 2004; Yang et al., 2011).
The scatterometer aboard the HY-2A satellite (hereafter HY-2A SCAT) is the first Chinese scatterometer used for global sea surface wind measurements (Jiang et al., 2012). The operational requirements of HY-2A SCAT wind data for sea surface wind speed and direction are 2.0 m/s and 20° in terms of root mean square error (RMSE). Thus far, several studies evaluating of the sea surface wind measurements of HY-2A SCAT have been reported. Table 1 gives a summary of the validation experiments conducted on HY-2A SCAT wind data. The validations suggest that the HY-2A SCAT sea surface wind speed is slightly underestimated with a bias of less than 0.5 m/s and a root mean square error (RMSE) of less than 1.5 m/s. For sea surface wind direction, the bias is less than three degrees in all three validation experiments, while the RMSE varies. In the studies of Wang et al. (2013) and Wu and Chen (2015), the RMSE of sea surface wind direction is consistent, which is approximately 20° compared with in situ buoy measurements. However, Yang et al. (2014) indicates a larger RMSE of approximately 40° compared with both the European Centre for Medium-Range Weather Forecasts (ECWMF) reanalysis model results and buoy measurements.

Currently, multiple spaceborne scatterometers are operational and providing global sea surface wind measurements. Merging of multiple scatterometer sea surface wind measurements can greatly improve temporal sampling frequency, which is an advantage in the assimilation of weather predictions (Valkonen et al., 2017), global (Atlas et al., 2011) and regional (Hasager et al., 2015) wind climatology studies.
We originally intended to merge the HY-2A SCAT sea surface wind data with the ASCAT wind measurements and use the merged data for regional offshore wind energy statistics, particularly in the China Seas where the two scatterometers have quite different overpass times. Thus, cross-comparison of the HY-2A SCAT sea surface wind data with other satellite measurements is necessary to determine the differences in accuracy, as well as solve the difficulty of inconsistent bias. The ASCAT data were acquired from the Remote Sensing Systems (RSS), which have been "calibrated" with WindSat radiometer sea surface wind data (Ricciardulli, 2016). Moreover, we found that the cross-collocation of the HY-2A SCAT with WindSat yields a vast amount of data pairs, which can significantly reduce uncertainties in comparisons. On the other hand, because the HY-2A SCAT operates in the Ku-band, which tends to be more affected by rainfall, we can use the cloud liquid water content measured by WindSat to exclude the HY-2A SCAT data affected by rainfall. This can yield a better understanding of the HY-2A SCAT data quality. Therefore, in this study, the WindSat sea surface wind field data were chosen for comparison with the HY-2A SCAT data. It is no doubt that in situ measurements are the best validation dataset for the sea surface wind measurements acquired by remote sensors, while comparison of the HY-2A SCAT sea surface wind measurements with WindSat data is appropriate considering the global coverage and sensitivity factors of the Ku-band scatterometer on rainfall.
Therefore, we seek the HY-2A SCAT wind data quality in global oceans by comparison with the calibrated WindSat wind speed data. The HY-2A SCAT and WindSat data used in this study are briefly described in Section 2. Statistical comparisons of the HY-2A SCAT data with the WindSat wind data are presented in Section 3. In Section 4, discrepancies between the two sea surface wind datasets in the global oceans are presented and analyzed. In the final section, a summary and conclusions are provided.
2 DESCRIPTION OF DATASET 2.1 HY-2A SCAT sea surface wind dataHY-2A is the first ocean dynamic environment satellite from China, which was launched in August 2011. HY-2A carries a radar altimeter, scatterometer and two radiometers to obtain sea surface height, sea surface wind and sea surface temperature, etc. For wind vector retrieval, HY-2A SCAT used the maximum likelihood estimation with a circle median filter to remove wind direction ambiguity (Jiang et al., 2012), which is based on the Ku-band geophysical model function (NSCAT-2). Similar to QuikSCAT, HY-2A SCAT operates in the Ku-band (15.256 GHz) using a pencil beam. Previous studies have noted that the wind data are unreliable in the outer swath and nadir because of the pencil beam mechanism (Freilich and Dunbar, 1999; Bourassa et al., 2003; Yuan, 2004; Jiang and Song, 2010). Thus, the data from the outer swath (1-4 and 73-76 of the 76 wind vector cells) and nadir (37-38 cells) of HY-2A SCAT are excluded from the comparison. According to the user manual, the HY-2A SCAT wind data are valid in the range of 2-24 m/s. Therefore, only the HY-2-A SCAT data in this range were used for comparison with WindSat data.
The influence of rain on the Ku-band Scatterometer sea surface wind measurement is greater than in the C-band (Yang et al., 2014). Wentz (1990) proposed that the columnar cloud liquid water content greater than 0.18 mm may indicate rainfall. Some studies (Mears et al., 2001; Meissner and Wentz, 2005; Wang et al., 2013) then used this threshold to exclude scatterometer wind data that may be contaminated by rainfall. In this study, the columnar cloud liquid water content measured by WindSat is used as the rain flag to exclude the collocated HY-2A SCAT wind measurements during rainfall conditions.
2.2 WindSat Sea surface wind dataWindSat is the first spaceborne microwave full polarimetric radiometer, which was launched in January 2003 aboard the Coriolis satellite. WindSat operates in five frequency channels of 6.8, 10.7, 18.7, 23.8 and 37.0 GHz (Gaiser et al., 2004). The all- weather 10-meter sea surface wind speed and wind direction data used in this study were provided by the RSS with a sampling of 0.25 degrees. The all-weather 10-meter sea surface wind data are a smooth blend between the standard wind speed obtained during conditions of non-rain, and global wind speed during rain and even of tropical cyclones. Extensive validation of the WindSat data has been undertaken by comparison with buoy measurements, other satellites and the wind field from numerical models. Meissner et al. (2011) shows that compared with buoy measurements, the WindSat all-weather data have a bias of 0.04 m/s during no rain conditions. Wentz et al. (2005) notes that compared with buoys, the bias and standard deviation of difference for WindSat wind direction is 0.47° and 37.97°, respectively, which is after excluding outliers (> 90°) in the wind speed range of 3-5 m/s. However, in the range of 5-25 m/s, the standard deviation of difference decreases to 20.95°. They also show that the standard deviation of differences can meet requirement better than 20° accuracy when sea surface wind speeds is above 6 m/s. Therefore, in this study, we used a sea surface wind speed greater than 6 m/s as a threshold to further screen the WindSat direction data for comparison with HY-2A SCAT wind direction data.
2.3 Cross collocation of HY-2A SCAT and WindSat sea surface wind dataIn this study, the HY-2A SCAT sea surface wind data acquired from October 1, 2011 to September 30, 2015 were spatially and temporally collocated with the WindSat data. The wind measurements from both sensors have a spatial sampling of 25 km, which is half of the grid size, i.e., 12.5 km is used as a spatial window, and one hour is set as a temporal window for collocation. The HY-2A SCAT valid wind speed range is 2-24 m/s, and thus, the data we collocated is also in that range. Finally, 231, 694, 842 data pairs were obtained for wind speed comparisons. For comparison of wind directions, null values from the WindSat wind direction data were discarded. Additionally, because WindSat wind direction is more accuracy when the wind speed is above 6 m/s, an additional threshold of 6 m/s is used to further screen the WindSat wind direction data under low wind speeds. Finally, 155, 651, 614 data pairs of HY-2A SCAT and WindSat were obtained for comparisons of wind directions.
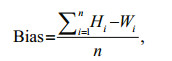
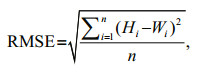
3 STATISTICAL COMPARISON OF HY-2A SCAT AND WINDSAT SEA SURFACE WINDThe following two statistical parameters in terms of bias (Eq.1) and RMSE (Eq.2) are used to evaluate the HY-2A SCAT wind measurements. In the formulas, Hi represents sea surface wind speed or wind direction data of HY-2A SCAT, Wi is the WindSat data, and n is the number of data pairs.
 (1)
(1) (2)
(2)The statistical comparison of sea surface wind speed is shown in Fig. 1. The overall bias is nearly 0 m/s (-0.01 m/s) and the RMSE is 1.13 m/s, which suggests that the HY-2A SCAT sea surface wind speeds agree well with the WindSat data. However, as seen in Fig. 1, the differences between the two datasets vary along with the sea surface wind speed, especially for sea surface wind speeds greater than 18 m/s. Therefore, a stepwise comparison with a bin size of 2 m/s was conducted, and the result is shown in Fig. 2. In the range of 2-10 m/s, HY-2A SCAT sea surface wind speed is consistent with the WindSat. For sea surface wind speed greater than 10 m/s but less than 18 m/s, the HY-2A SCAT measurements are higher than the WindSat winds. As the sea surface wind speed further increases, the increasing underestimation trend of the HY-2A SCAT along with wind speed becomes distinct, and the maximum absolute value of bias is approximately 2 m/s in the bin of 22-24 m/s.

|
| Fig.1 Comparison between the HY-2A SCAT and WindSat sea surface wind speed data acquired during a four- year period from October 2011 to September 2015 The color denotes the collocated data amount on logarithmic scale. The black line represents the mean sea surface wind speed of collocated WindSat data and HY-2A SCAT data within each 2 m/s step in the 2-24 m/s bin. |

|
| Fig.2 Stepwise comparison of the HY-2A SCAT sea surface wind speed with the WindSat data acquired during a four-year period from October 2011 to September 2015 The dots are the bias between the HY-2A SCAT and WindSat sea surface wind speed, and the solid lines are the error bars (±one standard deviation) in each 2 m/s step. |
For the comparison of sea surface wind direction, the diagram in Fig. 3 shows a bias of 1.51° and an RMSE of 33.60°. Considering the periodicity of wind direction, the calculated difference in wind direction between HY-2A SCAT and WindSat is in the range of -180°-180°, which is shown in Eq.3 where Hi represents sea surface wind direction data from HY- 2A SCAT, Wi is the WindSat data, and b is the difference in wind direction.
 (3)
(3)

|
| Fig.3 Comparison of the HY-2A SCAT sea surface wind direction with the WindSat in the four-year period from October 2011 to September 2015 The color denotes the collocated data amount on logarithmic scale. |

|
| Fig.4 Dependence of CWODs on WindSat sea surface wind speed The bars filled by dark blue show the ratio of the number of CWODs in a speed bin to the number of all CWODs data, and bars filled by yellow show the percentage of colocations data in each bin. |
A notable feature observed in the diagram is that there are some collocations with opposing directions (CWODs), where absolute values of wind direction differences between HY-2A SCAT and WindSat are larger than 120°, and this accounts for 2.80% of the total amount of data. There are 0.57% of these data that have a wind direction difference of approximately 180°, which indicates that inaccurate solutions were chosen in the retrieval. Discarding these data from the comparisons, and bias and RMSE reduce to 1.41° and 20.39°, respectively.
The distribution of CWODs is another issue investigated. In general, the percentage of CWODs does not depend on the wind speed distribution. Both have maximum values in the range of 8-10 m/s, which indicates that the inaccuracy of the HY-2A SCAT wind direction data is systematic.
Figure 5a and b show the dependence of wind direction residuals between the two datasets for the WindSat measurements of sea surface wind speed and wind direction, respectively. The bin size of the wind direction is chosen as 30° (that is, the residuals are calculated every 30° beginning at 0°). It seems that the residuals have slight dependence on the WindSat wind direction, liking a "sinusoidal" fluctuation along with wind direction. In contrast, residuals of HY-2A SCAT wind direction have no systematic dependence on the WindSat sea surface wind speed, which is nearly unchanged with the increasing of sea surface wind speed, but the standard deviation of residuals in the 6-8 m/s and 22-24 m/s are larger than in other bins.

|
| Fig.5 Dependence of the sea surface wind direction residuals HY-2A SCAT minus WindSat) on the WindSat sea surface wind direction after excluding CWODs (a) and dependence of the sea surface wind direction residuals (HY-2A SCAT minus WindSat) on sea surface wind speed after excluding CWODs (b) The dots represent the bias and the solid lines are the error bars (±one standard deviation) in each wind direction bin of 30° and wind speed of 2 m/s. |
The geographic distributions of bias in each 0.25° by 0.25° grid are shown in Fig. 6. As shown in Fig. 6, the bias of collocated HY-2A SCAT and WindSat wind speed before correction is in the range of -1.00-1.00 m/s. In general, positive values are found mainly between 40°-60°N and 40°-60°S belts, which are where high wind speed westerlies prevail. However, this cannot be derived from the overall comparison of sea surface wind speed shown in Fig. 2, which shows that the HY-2A SCAT wind speeds are smaller than those of WindSat for wind speeds above 18 m/s, as the collected high wind speed (> 18 m/s) data only requires a small portion (1%) of the whole dataset. Most of the collocated data are in the range of 2-18 m/s for wind speed. Therefore, the positive bias in the westerlies is not contradictory with the overall comparison shown in Fig. 2.

|
| Fig.6 Global distribution of sea surface wind speed bias between HY-2A SCAT and WindSat data |
There are also some specific regions, e.g., the west coast of the U.S., the west coast of Southern Africa and the west coast of central Latin America, where the HY-2A SCAT wind speeds are much higher than that with WindSat with a bias beyond 1 m/s.
After we examined the time series comparison between the HY-2A SCAT and WindSat wind speed data, shown in Fig. 7, there seems to be some plausible reasons for the distinct biased feature observed in the Fig. 6. Figure 7 suggests that the quality of the HY-2A SCAT data is quite unstable during certain periods between October 2011 and September 2015. Particularly during the first half of the year in 2013, the HY-2A SCAT wind speed is much higher than that of WindSat with a bias above 1.0 m/s. However, before and after the period until the beginning of 2015, the bias is rather stable, which is generally between -0.3-0 m/s. From the beginning of 2015, the bias shows a dramatic jump from approximately -0.5 m/s to 1.0 m/s, and then, it gradually decreases to zero in the following months. We also checked the comparisons of WindSat with other datasets, and they do not show bias fluctuations in the time series (Wentz, 2015). Therefore, the HY-2A SCAT data need to be further improved for consistent accuracy.

|
| Fig.7 Stability time series of collocated sea surface wind speed data |
Figure 8 shows the global distribution of biases after we excluded the HY-2A SCAT data acquired between January and June 2013 and in 2015. The two datasets are fairly consistent in terms of sea surface wind speed, particularly for the westerlies, which is where the original comparison (Fig. 6) suggests that HY-2A SCAT wind speed is much higher than that of the WindSat. However, the distinct overestimation of HY-2A SCAT wind speed on the west coast of the U.S., South Africa and central Latin America remain.

|
| Fig.8 Global distribution of sea surface wind speed biases between HY-2A SCAT and WindSat data after excluding January 2013-June 2013 and 2015 data |
As shown in Fig. 9, the RMSE range of global wind speed is from 0 m/s to 2 m/s. The values within 40°- 60°S and 40°-60°N are larger than those in other areas and reach greater than 1.75 m/s. Smaller values found in the east tropical Pacific and east tropical Atlantic are about approximately 0.75-1.00 m/s.

|
| Fig.9 Global distribution of sea surface wind speed RMSE between HY-2A SCAT and WindSat data |
Except for the global distribution of bias and RMSE, we also calculated the zonal averaged distribution to describe the differences between the HY-2A SCAT data and WindSat data. Each 1° latitude zonal bias or RMSE value is computed with the collocated data of that latitude, which is shown in Fig. 10. The bias of the HY-2A SCAT from 60°N to 60°S belt is in the range of -0.21-0.21 m/s (Fig. 10a), which shows a very distinct latitude fluctuation. The largest bias is found at 40°S, and the smallest one is found at the equator. With respect to the statistical parameter of RMSE, the RMSE varies from approximately 0.90 m/s to 1.40 m/s from high latitude to equator (Fig. 10b). Similar to the bias, the minimal RMSE value is found at the equator, and the largest is found at 60°N and 60°S.

|
| Fig.10 Zonal average of the HY-2A SCAT sea surface wind speed bias (a) and RMSE (b) |
HY-2A is the first Chinese satellite dedicated to measurements of ocean dynamic parameters, which has been in operation since 2011. In principle, these data are available for merging with other wind data from space sensors, as well as contributing to global sea wind observations. A consistent accuracy in observations is a prerequisite for merging the HY-2A SCAT wind data with other scatterometer observations.
We found that the ASCAT has quite different overpass times in the China Seas from those of the HY-2A SCAT. Therefore, we did not collocate the HY-2A SCAT data with the ASCAT data. Instead, these data were temporally and spatially collocated with WindSat data, which yields more than two hundred million data pairs for the period from October 1, 2011 to September 30, 2015. The large amount of collocations ensures that one can obtain stable statistical parameters, in terms of bias and RMSE in this study. The general comparison of sea surface wind speed between the HY-2A SCAT and WindSat yields a bias of almost 0 m/s and an RMSE of 1.13 m/s, which suggests that the HY-2A SCAT wind speed data are good quality. On the other hand, detailed comparisons suggest that there is space for further improvement of the HY-2A SCAT data.
The wind speed biases of the two datasets depend somewhat on the sea surface wind speed. In the range of 2-10 m/s, the HY-2A SCAT agrees well with the WindSat wind speed. Along with increasing wind speed, the HY-2A SCAT results are higher than that of WindSat, whereas the trend is reversed for wind speeds greater than 18 m/s, where the HY-2A SCAT is lower than WindSat. The comparison of wind direction bias is small at 1.51°, but the RMSE is large at 33.60°. When the HY-2A SCAT data with CWODs were excluded from the comparison, the bias decreased to 1.41°, and the RMSE reduces to 20.39°. The residuals of wind direction between the two datasets have no dependence on wind speed, while seem to slightly depend on wind direction.
We further conducted geographic comparisons between the two datasets. The global maps, as well as the zone average results for biases and RMSEs suggest that their discrepancies have clear dependence, i.e., the values of bias and RMSE have distinct fluctuation between the high latitude belts and the equator area. More importantly, the bias between HY- 2A SCAT and WindSat wind speed is not stable during the four-year period. Over the period from January to June 2013 and January to July 2015, the bias is positive, whereas it is negative during other periods. With these data excluded from the global bias map, the differences between the two datasets have rather consistent distributions in the global oceans, although distinct differences in a few areas remains (refer to Figs. 6, 8).
In summary, this study suggests that the accuracy of the HY-2A SCAT wind data can meet operational requirements, while the retrieval algorithm of the sea surface wind vectors from HY-2ASCATmeasurements can be further improved for better data quality, and the data can be used worldwide.
6 ACKNOWLEDGMENTWe would like to thank the NSOAS (National Satellite Ocean Application Service, China) for providing us with the HY-2A SCAT data. WindSat data are produced by Remote Sensing Systems and sponsored by the NASA Earth Science MEASURES DISCOVER Project and the NASA Earth Science Physical Oceanography Program. RSS WindSat data are available at www.remss.com.
Atlas R, Hoffman R N, Ardizzone J, Leidner S M, Jusem J C, Smith D K, Gombos D. 2011. A cross-calibrated, multiplatform ocean surface wind velocity product for meteorological and oceanographic applications. Bulletin of the American Meteorological Society, 92(2): 157-174.
DOI:10.1175/2010BAMS2946.1 |
Bourassa M A, Legler D M, O'Brien J J, Smith S R. 2003. SeaWinds validation with research vessels. Journal of Geophysical Research:Oceans, 108(C2): 3 019.
|
Freilich M H, Dunbar R S. 1999. The accuracy of the NSCAT 1 vector winds:comparisons with National Data Buoy Center buoys. Journal of Geophysical Research:Oceans, 104(C5): 11 231-11 246.
DOI:10.1029/1998JC900091 |
Gaiser P W, Germain K M S, Twarog E M, Poe G A, Purdy W, Richardson D, Grossman W, Jones W L, Spencer D, Golba G, Cleveland J, Choy L, Bevilacqua R M, Chang P S. 2004. The WindSat spaceborne polarimetric microwave radiometer:sensor description and early orbit performance. IEEE Transactions on Geoscience and Remote Sensing, 42(11): 2 347-2 361.
DOI:10.1109/TGRS.2004.836867 |
Hasager B, Mouche A, Badger M, Bingöi F, Karagali I, Driesenaar T, Stoffelen A, Peña A, Longépé N. 2015. Offshore wind climatology based on synergetic use of Envisat ASAR, ASCAT and QuikSCAT. Remote Sensing of Environment, 156: 247-263.
DOI:10.1016/j.rse.2014.09.030 |
Hersbach H, Stoffelen A, de Haan S. 2007. An improved C-band scatterometer ocean geophysical model function:CMOD5. Journal of Geophysical Research:Oceans, 112(C3): C03006.
|
Hersbach H. 2010. Comparison of C-band scatterometer CMOD5. N equivalent neutral winds with ECMWF.Journal of Atmospheric and Oceanic Technology, 27(4): 721-736.
|
Jiang X W, Lin M S, Liu J Q, Zhang Y G, Xie X T, Peng H L, Zhou W. 2012. The HY-2 satellite and its preliminary assessment. International Journal of Digital Earth, 5(3): 266-281.
DOI:10.1080/17538947.2012.658685 |
Jiang X W, Song Q T. 2010. A climatology of sea surface wind speed and wind stress fields constructed from scatterometer observations. Acta Oceanologica Sinica, 32(6): 83-90.
(in Chinese with English abstract) |
Mears A, Smith D K, Wentz F J. 2001. Comparison of special sensor microwave imager and buoy-measured wind speeds from 1987 to 1997. Journal of Geophysical Research:Oceans, 106(C6): 11 719-11 729.
DOI:10.1029/1999JC000097 |
Meissner T, Ricciardulli L, Wentz F. 2011. All-weather wind vector measurements from intercalibrated active and passive microwave satellite sensors. In: IEEE International Geoscience and Remote Sensing Symposium. IEEE, Vancouver, BC, Canada, p.1 509-1 511. https://ieeexplore.ieee.org/document/6049354/
|
Meissner T, Wentz F. 2005. Ocean retrievals for WindSat: radiative transfer model, algorithm, validation. In: Proceedings of 2005 IEEE International Geoscience and Remote Sensing Symposium. IEEE, Seoul, South Korea, p.4 761-4 764. https://ieeexplore.ieee.org/document/1639750
|
Monaldo F M, Thompson D R, Pichel W G, Clemente-Colón P. 2004. A systematic comparison of QuikSCAT and SAR ocean surface wind speeds. IEEE Transactions on Geoscience and Remote Sensing, 42(2): 283-291.
DOI:10.1109/TGRS.2003.817213 |
OSI SAF. 2014-10-02. NSCAT-4 geophysical model function.http://projects.knmi.nl/scatterometer/nscat_gmf/.
|
Quilfen Y, Chapron B, Elfouhaily T, Katsaros K, Tournadre J. 1998. Observation of tropical cyclones by high-resolution scatterometry. Journal of Geophysical Research:Oceans, 103(C4): 7 767-7 786.
DOI:10.1029/97JC01911 |
Ricciardulli L, Wentz F J. 2015. A scatterometer geophysical model function for climate-quality winds:quikSCAT Ku-2011. Journal of Atmospheric and Oceanic Technology, 32(10): 1 829-1 846.
DOI:10.1175/JTECH-D-15-0008.1 |
Ricciardulli L. 2016-04-04. ASCAT on MetOp-A data product update notes. 4 April 2016, http://images.remss.com/papers/rsstech/2016_040416_RSS_ASCAT_V2_update.pdf.
|
Stoffelen A, Anderson D. 1997. Scatterometer data interpretation:measurement space and inversion. Journal of Atmospheric and Oceanic Technology, 14(6): 1 298-1 313.
DOI:10.1175/1520-0426(1997)014<1298:SDIMSA>2.0.CO;2 |
Stoffelen A, Verspeek J A, Vogelzang J, Verhoef A. 2017. The CMOD7 geophysical model function for ASCAT and ERS wind retrievals. IEEE Journal of Selected Topics in Applied Earth Observations and Remote Sensing, 10(5): 2 123-2 134.
DOI:10.1109/JSTARS.2017.2681806 |
Valkonen T, Schyberg H, Figa-Saldaña J. 2017. Assimilating advanced scatterometer winds in a high-resolution limited area model over northern Europe. IEEE Journal of Selected Topics in Applied Earth Observations and Remote Sensing, 10(5): 2 394-2 405.
DOI:10.1109/JSTARS.2016.2602889 |
Verhoef A, Vogelzang J, Verspeek J, Stoffelen A. 2017. Longterm scatterometer wind climate data records. IEEE Journal of Selected Topics in Applied Earth Observations and Remote Sensing, 10(5): 2 186-2 194.
DOI:10.1109/JSTARS.2016.2615873 |
Verspeek J, Stoffelen A, Portabella M, Bonekamp H, Anderson C, Saldana J F. 2010. Validation and Calibration of ASCAT Using CMOD5.n. IEEE Transactions on Geoscience and Remote Sensing, 48(1): 386-395.
DOI:10.1109/TGRS.2009.2027896 |
Vogelzang J, Stoffelen A, Verhoef A, Figa-Saldaña J. 2011. On the quality of high-resolution scatterometer winds. Journal of Geophysical Research:Oceans, 116(C10): C10033.
DOI:10.1029/2010JC006640 |
Wang H, Zhu J H, Lin M S, Huang X Q, Zhao Y L, Chen C T, Zhang Y G, Peng H L. 2013. First six months quality assessment of HY-2A SCAT wind products using in situ measurements. Acta Oceanologica Sinica, 32(11): 27-33.
DOI:10.1007/s13131-013-0374-5 |
Wang Z X, Stoffelen A, Zhao C F, Vogelzang J, Verhoef A, Verspeek J, Lin M S, Chen G. 2017. An SST-dependent Ku-band geophysical model function for RapidScat. Journal of Geophysical Research:Oceans, 122(4): 3 461-3 480.
DOI:10.1002/2016JC012619 |
Wentz F J, Meissner T, Smith D. 2005. Evaluation of microwave scatterometers and radiometers as satellite anemometers. In: Proceedings of 2005 IEEE International Geoscience and Remote Sensing Symposium. IEEE, Seoul, South Korea, p.3 310-3 313. http://ieeexplore.ieee.org/xpl/abstractReferences.jsp?arnumber=1526549
|
Wentz F J. 1990. SBIR phase Ⅱ report: west coast storm forecasting with SSM/I. Tech. Rep. 033190, Santa Rosa, CA: Remote Sensing Systems.
|
Wentz F J. 2015. A 17-yr climate record of environmental parameters derived from the Tropical Rainfall Measuring Mission (TRMM) Microwave Imager. Journal of Climate, 28(17): 6 882-6 902.
DOI:10.1175/JCLI-D-15-0155.1 |
Wu Q, Chen G. 2015. Validation and intercomparison of HY-2A/MetOp-A/Oceansat-2 scatterometer wind products. Journal of Oceanology and Limnology, 33(5): 1 181-1 190.
DOI:10.1007/s00343-015-4160-4 |
Yang X F, Li X F, Pichel W G, Li Z W. 2011. Comparison of ocean surface winds from ENVISAT ASAR, Metop ASCAT scatterometer, buoy measurements, and NOGAPS model. IEEE Transactions on Geoscience and Remote Sensing, 49(12): 4 743-4 750.
DOI:10.1109/TGRS.2011.2159802 |
Yang X F, Liu G H, Li Z W, Yu Y. 2014. Preliminary validation of ocean surface vector winds estimated from China's HY-2A scatterometer. International Journal of Remote Sensing, 35(11-12): 4 532-4 543.
DOI:10.1080/01431161.2014.916049 |
Yuan X J. 2004. High-wind-speed evaluation in the Southern Ocean. Journal of Geophysical Research:Atmospheres, 109(D13): D13101.
|