 2019, Vol. 37
Institute of Oceanology, Chinese Academy of Sciences
Article Information
- BI Congcong, BAO Xianwen, DING Yang, ZHANG Cong, WA NGYu, SHEN Biao, WA NKai
- Observed characteristics of tidal currents and mean flow in the northern Yellow Sea
- Journal of Oceanology and Limnology, 37(2): 461-473
- http://dx.doi.org/10.1007/s00343-019-8026-z
Article History
- Received Feb. 2, 2018
- accepted in principle Mar. 7, 2018
- accepted for publication May. 2, 2019


2 Physical Oceanography Laboratory/CIMST, Ocean University of China and Qingdao National Laboratory for Marine Science and Technology, Qingdao 266100, China;
3 The First Institute of Oceanography, State Oceanic Administration, Qingdao 266061, China;
4 Laboratory for Regional Oceanography and Numerical Modeling, Qingdao National Laboratory for Marine Science and Technology, Qingdao 266000, China;
5 National Marine Environmental Monitoring Center, State Oceanic Administration, Dalian 116023, China;
6 Beihai Offshore Engineering Survey Institute, State Oceanic Administration, Qingdao 266061, China
The northern Yellow Sea (hereafter referred to as NYS), a semi-enclosed shelf sea, connects with the Bohai Sea on the west and the southern Yellow Sea on the southeast, acting as a unique passage for material and energy exchange between inland sea and open sea. This region features a parallelogram shape and an average water depth of 38 m, with isobaths approximately parallel to the shoreline. The Yellow Sea Trough (YST), which is relatively deep, extends northwestward in the central Yellow Sea (Fig. 1). As a representative of shallow marginal seas, many typical hydrological and ecological phenomena can be found in the NYS. Therefore, understanding the characteristics and variability of hydrodynamic environment in this area is of great importance.

|
| Fig.1 Maps of the northern Yellow Sea and locations of the moored ADCPs (red dots) for the 2006–2007 (M01–M04) and 2009 measurements (Cur01 and Cur03, with blue edge) Contours indicate isobaths in meters. Small dots denote hydrographic survey stations conducted in the summer seasons of 2006 (black) and 2009 (grey). The surrounding areas of site M01, M03 and M04 were enlarged in the small blue axes to exhibit the details. The suffix guided by "-" represents the specific cruise, taking the format of "SSS" or "yyyySSS". "yyyy" is the year, and "SSS" is the abbreviation of season name, that is, SPR for spring, SUM for summer, AUT for autumn and WIN for winter, respectively. The principle also applies to the other figures in this paper. ZZ: the Zhangzi Island; NHC: the North Huangcheng Island; NCS: the North Changshan Island; CSA: the Changshan Archipelago; CSC: the Chengshan Cape. |
Previous studies have revealed that the most significant water movement in the NYS is driven by tides. With the help of much work in the past, the basic properties of local tidal movement have been well understood. The predominant tidal system is counter-clockwise rotating, with a semi-diurnal tideamphidromic point off the Chengshan Cape and a diurnal one in the Bohai Strait (BS) (Fang, 1986; Fang et al., 2004). Tidal currents there also mainly varied in a counter-clockwise direction. The high speed occurs in the northern part of BS, coastal waters near the Chengshan Cape, and the eastern zone, while velocity to the north of Yantai-Weihai region is relatively weak (Xiu et al., 1989; Bao et al., 2001; Song et al., 2016). In comparison with tidal currents, mean flow of this region is very weak, and there have been only some general statements on the circulation pattern in the NYS until now. In winter, three coastal currents (one flowing eastward along the north shore of Shandong Peninsula, another moving southwestward along the south coast of Liaodong Peninsula, and the third southward off the west of Korea, respectively), together with the northwestward extension of the Yellow Sea Warm Current (YSWC), form a strong anticyclonic gyre in the east and a weak cyclonic one in the west, in the dominance of barotropic flow (Miao and Liu, 1988; Liu, 1996; Chen et al., 2003). During summer, the density flow induced by the Yellow Sea Cold Water Mass (YSCWM) appears as a significant component in circulation of the NYS (Guan, 1963; Hu et al., 1991; Miao et al., 1991; Su and Huang, 1995), and the vertical profile of current becomes more complex, affected by the stratification effect (Huang et al., 2002; Hu et al., 2004; Li et al., 2012). In addition, some studies explored the flow pattern and dynamic mechanism of the water exchange process through the BS (Lin et al., 2002; Zhang et al., 2018).
Although plenty of research has been done on the hydrodynamics of the NYS, only very few of them were based on direct current measurements (Yu et al., 2008; Bao et al., 2010; Zhuang et al., 2017). As a result, some issues about the local water movement still remain ambiguous up to now, such as its vertical structure and temporal variations. During four seasons of 2006–2007 and also the summer of 2009, continuous current measurements over a period longer than a month were made on several moorings in the NYS. It is the first systematic observation of seasonal circulation in the area, providing a more exact description of local dynamic conditions along with temperature data collected synchronously. Our study aims to discover the detail characteristics of flow in the NYS by analyzing this new dataset and then improve the understanding of regional dynamics.
The remaining part of this paper is organized as follows. In Section 2, we describe the dataset and methods used in this study. Then the observed features of tidal currents and mean flow in the NYS are presented in Section 3. A brief discussion and main conclusions are given in Sections 4 and 5, respectively.
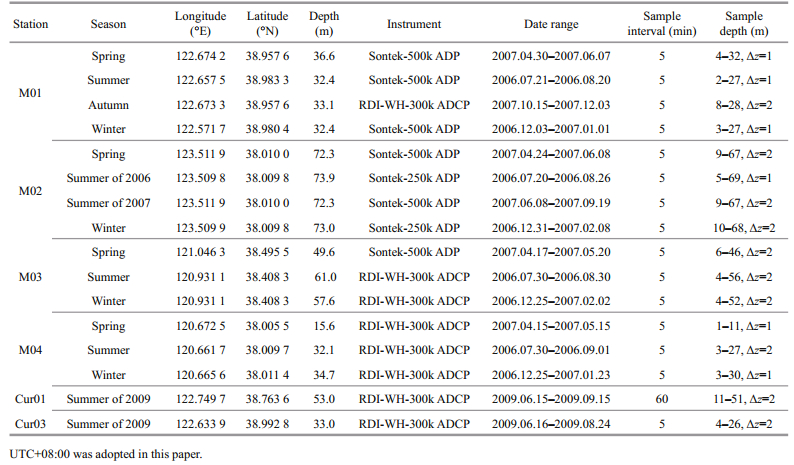
2 DATA AND METHOD 2.1 Field measurementA large-scale comprehensive survey program in the NYS west of 124°E was conducted by the Ocean University of China during 2006–2007, collecting CTD profile data with a high vertical resolution at ~120 stations and deploying four moored Acoustic Doppler Current Profilers (ADCPs) (named M01– M04) for each of the four seasons (Fig. 1). M01 was located in the northern coastal zone of NYS, to the southwest of Zhangzi Island. M02 lay in the border between the northern and southern part of the Yellow Sea, also the northern end of the YST. M03 and M04 were placed in the BS, around the center-north and the south, respectively. The former one was next to the northeast shore of the North Huangcheng Island in the summer and winter investigations, while deployed more north in spring. The latter was adjacent to the northwest of the North Changshan Island, with the shallows and some small islands on its south. All the four stations were equipped with bottom-mounted, upward-looking ADCPs as well as tide gauges, and most of them were recovered successfully with record lengths of about one month. It should be noted that the current records in autumn were missing at M02, M03 and M04 because of instrument failure or plan adjustment, and an additional longer observation at M02 was made for 103 days in the summer of 2007, immediately following the spring one. To make further explorations on the border fluctuation process of the YSCWM, another hydrographic cruise was performed in the nearshore area of NYS for the summer of 2009, with deployment of bottom-mounted ADCPs (Cur01 and Cur03) across the slope south of the Changshan Archipelago for three-month continuous measurements (from mid-June to mid-September) (Fig. 1). Site M01 and Cur03 were close to each other. Detailed information on the above-mentioned measurements is listed in Table 1. All instruments were calibrated prior to and after the deployments following the standard procedures. Data with obvious biases were removed in postprocessing.
|
A harmonic tidal analysis using T_TIDE (Pawlowicz et al., 2002) was performed on the water level and current records of these moored sites, and ~30 tidal constituents were distinguished in this process. Harmonic constants of sea level height and ellipse parameters of tidal currents at all observational depths for each measurement were obtained. After removing all the resolved tidal current components from the records, the rest part of current was averaged over time to get the mean flow. In particular, the term "mean flow" in this paper means a flow appeared constant during the observation period, rather than the one remains steady for a long time. The observed currents, then, were linearly decomposed into three components, that is, periodic tidal current, mean flow and residual current reflecting the temporal variation of nontidal flow, respectively. The ratio of the kinetic energy for each portion to the total were further calculated. To make more precise comparisons between different measurements, the following points should be clarified. Data during the same period in a year as the summertime measurement on M01 were extracted from the velocity records on Cur01 and Cur03 for analysis. Similar process was done for the observation in summer of 2007 at site M02. Because the amount of removed data was relatively large in spring and summer seasons at station M04, accounting for 22% and 24% of the total, the results of these two observations were mainly used for qualitative explanation. The discrepancy of locations for the same station in different seasons was also taken into consideration in the interpretation of results. In addition, rotary spectrum analysis (Gonella, 1972; Chen et al., 1996) was performed on the current time series to identify the prominent energy signals and frequencies. It should be noted that except the specific depth was given, the definition of vertical layers mentioned blow follows this principle: According to the depth of each station, the whole water column was divided equally into three sub-layers: the upper, middle and lower layers; The two ends of the measured depth of ADCP were referred to as the near-surface and near-bottom layers, respectively.
3 OBSERVED FEATURES OF CURRENTS IN THE NYS 3.1 Tidal currentsThe statistics on energy contribution of the three current components (Fig. 2) indicated that tidal currents were predominant at all moorings, accounting for ~75% of the total kinetic energy. Energy of mean flow was smaller, with a ratio of ~5%. This magnitude decreased with depth in most cases, showing a reverse trend to that of tidal currents, and was larger in shallow water (site M01 and M04) while close to 0% at M02 on average. The residual current had a proportion of ~20%.

|
| Fig.2 Percentage for kinetic energy of the three current components to the observed flow on all ADCP moorings Solid line: the mean flow; dashed line: the tidal current; and dot line: the residual current. The terms "u" and "v" denote east-west and north-south directions, respectively. |
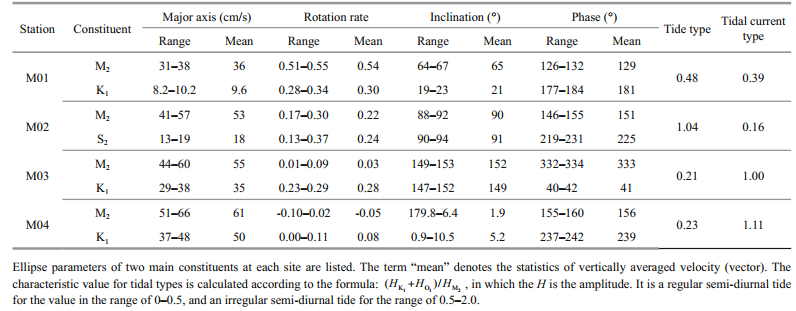
Analysis of water level records showed an irregular semidiurnal tide on M02 and a regular one at other sites (Table 2). Figure 3 presents a view on the tidal current ellipse parameters of the four main constituents (M2 and S2 for semidiurnal tides; O1 and K1 for diurnal tides), and Table 2 is the partial statistics in winter. The results clearly indicated that the M2 tidal currents were absolutely dominant for all observation areas, with maximum velocities of ~35 cm/s around the Changshan Archipelago and ~60 cm/s on other stations. Diurnal tidal currents in the BS, especially its southern part, were relatively strong, with amplitudes of ~40 cm/s for K1 and ~20 cm/s for O1, while at M02, the S2 component was secondary important. In addition, the maximum speeds of other constituents appeared fairly small, not beyond 20 cm/s. Consequently, tidal currents in the BS were of irregular semidiurnal type, different from the regular type at M01 and M02. The rotation rate and inclination of major axes for main constituents at each site jointly depicted the primary form and variation of local tidal flow. Specifically, counter-clockwise rotary current was found on the slope area near the Zhangzi Island (M01, Cur03 and Cur01). The principal axis exhibited northeast-southwest extension and its value was almost twice that of minor axis. At the south entrance of the NYS (M02), tidal currents were characterized by approximately rectilinear flow along the north-south direction, with a rotation rate of ~0.25. More normal rectilinear current occurred in the BS. Influenced by the coast of adjacent islands, tidal movements at M03 and M04 were strictly constrained in the northwest-southeast and east-west directions, respectively. There was no apparent difference between the orientations of major axes for semidiurnal and diurnal tides, which was distinct from the situation around the Changshan Archipelago. In summary, the maximum velocity of most constituents at these mooring sites was roughly parallel to the local isobaths or coastline. Counter-clockwise rotation seemed more common in the NYS, while currents of semidiurnal tides in the BS and diurnal tides at M01 often varied in the opposite direction.
|

|
| Fig.3 Parameters of tidal current ellipses for four main constituents at moored sites during 2006–2009 a. stations around the Changshan Archipelago (M01, Cur03 and Cur01); b. M02; c. M03; d. M04. The line style denotes different cruises, and line color was used for distinguishing between tidal constituents. The sign of the rotation rate indicates the direction of rotation: positive for counter-clockwise rotating. Inclination is measured counterclockwise from east. |
Visible vertical variations of tidal currents were observed on all stations. Ellipse amplitude had a general decreasing trend with depth, whose rate was higher in the lower layer and at shallow water sites. The velocity of M2 constituent, with larger value than other tidal components, also presented a comparatively notable vertical difference, reaching ~20 cm/s at M02–M04 and ~10 cm/s near M01. The condition was somewhat special on site M02 with deeper water, where the maximum speed occurred in the upper or middle layers (~30 m for spring, ~40 m for summer, and ~20 m for winter) instead of near the surface. Rotation rate usually increased with depth, while the change of ellipse inclination and phase appeared generally small and irregular. For M2 tidal currents, the variation ranges of these three parameters were ~0.1°, ~5°, ~10° in winter, and around or less than 0.3°, 20°, 30° during summer. Phase of this constituent tended to decrease vertically in the vast majority of our measurements. The larger vertical differences of ellipse parameters in summer than in winter had implied certain seasonal changes of tidal currents in the NYS. Further comparisons of the multiple observations on the same site indicated that there were no fundamental variations on the property of local tidal flow, but the details of its vertical distribution were diverse between seasons. The M2 constituent at site M02, for example, were approximately homogeneous in the upper 40 m layer and varied rapidly below during the summer of 2006, differing from the gradual vertical change observed in winter.
Rotary spectrum analysis (Fig. 4) showed two remarkable peaks at diurnal and semidiurnal periods, suggesting the significance of tidal movement in the NYS once again. The vertical and seasonal variations of peak energies were also consistent with the foregoing characteristics of tidal current ellipses. The spectral density distributions, moreover, indicated some other features. Energy density of diurnal tidal currents was on the whole larger than that of semidiurnal periods in the BS. The proportion of counterclockwise-rotating component to total energy increased with depth at all sites, particularly in summertime. Additionally, several periodic signals with small amplitudes could be detected sometimes, for example, apparent peaks at ~4, ~6 and ~8 hours frequency bands as well as a constituent with a period of ~19.2 hours (not so obvious). They were only outstanding at some sites in certain seasons. The former appeared to coincide with the shallow water constituents driven by nonlinear interaction between main tidal components under the shallows environment, and the latter, represented by clockwiserotating energy, reflected the inertial oscillation in the measurements.

|
| Fig.4 Rotary spectra of observed currents Limited by the length of this paper, take the results of several sites in certain seasons as examples. a. the spectral density distributions at depths of 2, 8, 14, 21, 27 m on M01 in summer; b. rotary spectra of vertically averaged currents on M01 in winter, M02 in spring and summer, M03 in summer, and M04 in winter. Black line: the total energy; red line: the clockwise energy; and blue line: the counter-clockwise energy. The spectra at different depths or different moorings were shifted by 106, 103, 100, 10-3, and 10-6, respectively. The common peaks were labeled by grey dashed lines. From left: constituents with diurnal, inertial, semi-diurnal, third-diurnal, quarter-diurnal, and sixth-diurnal periods. The 95% confidence intervals in (b) were omitted for clarity, and all the abovementioned peaks were statistically significant. |
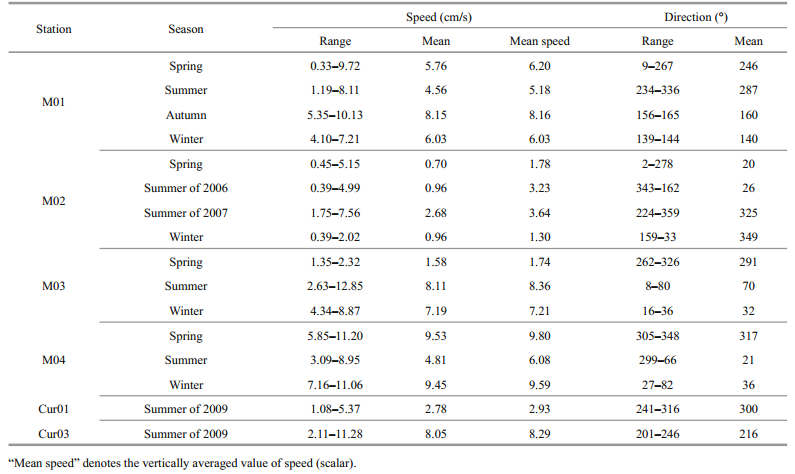
Figure 5 clearly shows the observed spatial distribution of mean flow. On the slope area south of the Changshan Archipelago (M01, Cur03 and Cur01), westward currents were predominant in spring and summer, with strong along-isobath components. Considerable spatial and interannual variations of mean flow were found there during summer. The vertically averaged velocity was 2.78 cm/s at Cur01, weaker than that at Cur03 of 8.05 cm/s. Current directions on site M01 were westward and southwestward respectively, over the same period in 2006 and 2009. For the autumn and winter seasons, southeastward cross-slope flow with similar vertical structures appeared in this region. The main reasons behind the significant seasonal transition and the visible summertime differences of local currents are worthy of attention. Contributions of different dynamic factors, such as the monsoon, the YSCWM and the coastal river plume, to the mean flow here in the four seasons still remain unclear.

|
| Fig.5 Vectors of mean flow at all ADCP moorings a. stations around the Changshan Archipelago; b. M02; c. M03; d. M04. Current component along the x axis indicates the zonal flow, while along the y axis denotes the meridional flow. A same scale has been applied to the zonal and meridional current components, as that shown in the x axis. |
Currents on the northern end of YST (M02), where is away from the coast, seemed relatively weak compared to the other sites. The speed was seldom more than 5 cm/s, with a mean value of ~1.5 cm/s except in summer. However, the vertical profile of mean flow there was complicated, presenting an obvious layered structure in all seasons. During spring, northeastward currents dominated in the upper 30 m, with a maximum velocity of 5.15 cm/s at the depth of 21 m. Flow in the rest of the water column was smaller than 1.25 cm/s and its direction rotated counterclockwise from west to southeast with depth, forming a spiral in the vertical. For summertime, currents reached the strongest of the four seasons. In 2006, a subsurface-intensified northwestward flow was on top of another bottom-intensified southeastward flow, and a strong shear of velocity vectors occurred around 39 m, characterized by a rapid change of ~4 cm/s in speed and ~160° in angle. Similar inflow to the NYS in the upper layer was observed once again for the summer of 2007, but currents beneath 35 m were quite different, moving westward at a speed of ~2 cm/s with insignificant vertical variations. Mean flow at M02 appeared to attain the minimum in winter, directed southward near the surface and roughly northward below 20 m. In this season, the station was traditionally considered under the influence of the YSWC, so the measured weak northward currents beneath the surface demonstrated not only the existence of the YSWC against the prevailing northerly wind, but also its low speed from the perspective of the seasonal mean (Lie et al., 2001; Lin et al., 2011). Northward flow into the NYS was prominent in the area for the whole year, usually with a higher speed in the upper 30 m. Visible countercurrents existed in the lower layer during the summer of 2006, the driving force of which is still unknown.
In the Bohai Strait (M03 and M04), inflows from the NYS to the Bohai Sea were captured in spring, with a larger velocity of ~9.5 cm/s in the south and a small one of ~1.6 cm/s in the north. When summer arrived, strong eastward currents formed at station M03, and a similar outflow from the Bohai Sea arose in the upper water column of M04, which, however, turned northwestward below 15 m. The outflows at both sites continued during winter, featuring high speed in space and northeast direction. Our observations are somewhat different to the widelyaccepted flow pattern through the BS, "inflow in the north and outflow in the south" (Guan, 1994; Huang et al., 1998; Li et al., 2005). The fact implies that further study is necessary to figure out the details of water exchange between the Bohai Sea and the NYS.
Table 3 summarized the statistics of mean flow for all measurements. Synthesis of the results indicated that mean flow in the NYS was relatively weak, not exceeding 15 cm/s in our observations. Apart from the seasonal variations emphatically described above, there were also some differences for current vectors vertically. The layered structure on M02 was exactly a good example, while for other sites, common situation was that the speed decreased and the flow direction presented a major trend to deflect to the left with depth. Specifically, in spring and summer, the velocity usually reached its maximum in the upper layer, and damped rapidly beneath in a near-linear way. Vertical variations of currents at the moment were relatively large, with the range of 6.9, 10.2, 5.86 cm/s in speed and 102°, 72°, 127° in angle during the summer of 2006, for station M01, M03 and M04, respectively. When winter came, mean flow changed gradually with increasing depth, showing a strong barotropic property and a better monotonicity. The vertical uniformity of direction, in particular, was fairly good, the difference of which was no more than 30°, except the 3 m layer of M04. The wintertime current velocity at M04 tended to increase from top to bottom, unlike the usual case.
Influenced by the time-varying solar radiation and monsoon, the spatial gradient of seawater density in the NYS is large during summer, while inconspicuous for winter (Fig. 6). The significant change of thermal structure in a year is very likely to have a great impact on local currents, which was evidenced by many phenomena in our measurements. In summertime, site M01 (Cur03) and Cur01 were located within the scope of the YSCWM (Fig. 6a). The measured westward flow there was mainly along the isotherms and intensified obviously in the frontal zone. This result provided support for some previous views: There is a buoyancy-driven, quasi-geostrophic cyclonic circulation around the cold water mass, with a higher velocity on the thermal fronts horizontally (Beardsley et al., 1992; Choi and Lie, 1992; Zhao, 1996; Pang et al., 2004; Zhou et al., 2015). As a result, the interannual difference of currents at M01 for the 2006 and 2009 summers might be attributed to the change of density field during the observations (Fig. 6a, c). The formation of vertical structures for tidal and mean flow were partly due to the bottom friction (Prandle, 1982; Fang and Ichiye, 1983). In addition, seasonal variations of the specific distribution also suggested the effect of density field (Zhao et al., 1990). The larger vertical differences of current characteristics in summer than that in winter, was a case in point. By comparing vertical profiles between mean flow velocity and temperature, we found that the maximum speed often occurred near the thermocline instead of in the near-surface layer for the spring and summer seasons (Fig. 6d, e), further demonstrating the important impact of water stratification. To better address the findings raised above from the perspective of dynamic mechanism, modeling study is necessary in subsequent work.

|
| Fig.6 Spatial distributions of observational temperature in the NYS and comparisons between vertical profiles of mean flow speed and temperature at some stations Top: contours of bottom temperature (℃) for the summer of 2006 (a), the winter of 2006-2007 (b) and the summer of 2009 (c). Black dots denote the moored sites deployed at the corresponding season. Middle and bottom: vertical profiles of mean flow speed (black line) and temperature (blue line) at several sites in spring (d), summer (e) and winter (f), respectively. The temperature data were from the adjacent hydrographic stations. |
Several bottom-mounted ADCP moorings were deployed in the NYS during the four seasons of 2006–2007 and the summer of 2009. A synthesis analysis on the time-continuous records was performed to examine the characteristics and variations of tidal currents and mean flow at these stations. The results showed that tidal currents were predominant at all sites, accounting for ~75% of the total kinetic energy. The contribution of M2 constituent was the largest, and there was also considerable diurnal tidal flow in the BS. Rotary current existed around the Changshan Archipelago, while approximate rectilinear flow dominated in other areas, with a direction parallel to local isobaths. Visible vertical variations of tidal currents appeared on all moorings, featured by the decrease of amplitude, increase of rotation rate as well as a decreasing trend of the phase for M2 component with depth. A notable exception occurred in the central area, where the maximum tidal currents was in the upper or middle layers instead of near the surface. The observed mean flow, by contrast, was relatively weak, smaller than 15 cm/s. On the slope near the Zhangzi Island, a big transition of current direction occurred between seasons, with a stable southeastward flow across the isobaths in autumn and winter. Mean flow on the northern end of YST was characterized by a low speed and an obvious layered vertical structure. Northward flow into the NYS was prominent there for the whole year, indicating the existence of the YSWC in winter. Currents in the BS appeared partly different from the traditionally-accepted pattern, implying the need for further study on the details of water exchange between the Bohai Sea and Yellow Sea in time and space. In most measurements, the speed decreased and the flow direction rotated counterclockwise with depth. Seawater thermal structure was believed to have a profound influence on local currents, shown not only in summertime cyclonic circulation around the YSCWM and its horizontal variation, but also in seasonal changes of vertical distribution for both tidal and mean flow. Affected by the water stratification, mean flow usually reached its maximum near the thermocline in spring and summer, while showing a nearly uniform vertical distribution during winter.
Although the number of our moorings are limited relative to the whole scope of NYS, they are good representatives of three pivotal regions in the area, that is, the northern slope zone (M01, Cur03 and Cur01), the central region (M02) and the BS (M03 and M04). Research on these direct current measurements obtained valuable information about the regional dynamic environment, and will provide very important reference for future investigations of circulation and ecosystem in the Bohai Sea and Yellow Sea. Further analysis of the data is required to explore the intra-seasonal variability of local currents.
6 DATA AVAILABILITY STATEMENTAccording to "Regulations on the Scope of State Secrets in Oceanic Work", data used in this study belong to the category of "the observed currents in important military zones or non-open waters", which is of high confidentiality and cannot be shared publicly over a long period of time. All analysis results mentioned above have been shown in the form of figures and tables in this paper. Collaborative research on these data and the relevant phenomena is warmly welcomed. If reasonable demand exists, please contact the corresponding author.
7 ACKNOWLEDGEMENTThe authors would like to thank many individuals in the Ocean University of China who participated at the survey program of the NYS, especially the deployment, maintenance and recovery of the moorings. Sincere thanks are also given to two reviewers whose suggestions helped improve this manuscript.
Bao X W, Gao G P, Yan J. 2001. Three dimensional simulation of tide and tidal current characteristics in the East China Sea. Oceanologica Acta, 24(2): 135-149.
DOI:10.1016/S0399-1784(00)01134-8 |
Bao X W, Song J, Yao Z G, Qiao L L, Bao M, Wan K. 2010. The vertical structure and seasonal variation of the tide current and residual current in the North Yellow Sea. Periodical of Ocean University of China, 40(11): 11-18.
(in Chinese with English abstract) |
Beardsley R C, Limeburner R, Kim K, Candela J. 1992. Lagrangian flow observations in the East China, Yellow and Japan seas. La Mer, 30(3): 297-314.
|
Chen C S, Reid R O, Nowlin W D. 1996. Near-inertial oscillations over the Texas-Louisiana shelf. Journal of Geophysical Research:Oceans, 101(C2): 3.
DOI:10.1029/95JC03395 |
Chen M, Hou Y J, Zhao B R. 2003. Numerical simulation of the meso-scale eddy in the East China Sea in winter. Marine Sciences, 27(1): 53-60.
(in Chinese with English abstract) |
Choi B H, Lie H J. 1992. Physical oceanography program of the East China Sea and the East Sea (Japan Sea) dynamics in Korea. In: Proceedings of the PORSEC-'92. PORSEC Secr., Shimizu, Japan. p.1-28.
|
Fang G H, Ichiye T. 1983. On the vertical structure of tidal currents in a homogeneous sea. Geophysical Journal International, 73(1): 65-82.
DOI:10.1111/j.1365-246X.1983.tb03807.x |
Fang G H, Wang Y G, Wei Z X, Choi B H, Wang X Y, Wang J. 2004. Empirical cotidal charts of the Bohai, Yellow, and East China Seas from 10 years of TOPEX/Poseidon altimetry. Journal of Geophysical Research:Oceans, 109(C11): C11006.
DOI:10.1029/2004JC002484 |
Fang G H. 1986. Tide and tidal current charts for the marginal seas adjacent to China. Chinese Journal of Oceanology and Limnology, 4(1): 1-16.
DOI:10.1007/BF02850393 |
Gonella J. 1972. A rotary-component method for analysing meteorological and oceanographic vector time series. Deep Sea Research and Oceanographic Abstracts, 19(12): 883-846.
|
Guan B X. 1963. A preliminary study of the temperature variations and the characteristics of the circulation of the cold water mass of the Yellow Sea. Oceanologia et Limnologia Sinica, 5(4): 255-284.
(in Chinese with English abstract) |
Guan B X. 1994. Patterns and structures of the currents in Bohai, Huanghai and East China Seas. In: Zhou D, Liang Y B, Zeng C K eds. Oceanology of China Seas. Springer, Dordrecht, The Netherlands. p.17-26.
|
Hu D X, Cui M C, Li Y X, Qu T D. 1991. On the Yellow Sea cold water mass-related circulation. Yellow Sea Research, 4: 79-88.
|
Hu H G, Yuan Y L, Wan Z W. 2004. Study on hydrodynamic environment of the Bohai Sea, the Huanghai Sea and the East China Sea with wave-current coupled numerical model. Acta Oceanologica Sinica, 26(4): 19-32.
(in Chinese with English abstract) |
Huang D J, Su J L, Zhang L R. 1998. Numerical study of the winter and summer circulation in the Bohai Sea. Acta Aerodynamica Sinica, 16(1): 115-121.
(in Chinese with English abstract) |
Huang L, Lou A G, Wang X C, Xi P G, Huang Z K. 2002. A numerical computation of wind-induced currents and computation of residual currents in the Bohai Sea and the northern part of the Yellow Sea. Journal of Ocean University of Qingdao, 32(5): 695-700.
(in Chinese with English abstract) |
Li G S, Wang H L, Li B L. 2005. A model study on seasonal spatial-temporal variability of the Lagrangian Residual Circulations in the Bohai Sea. Journal of Geographical Sciences, 15(3): 273-285.
DOI:10.1007/BF02837516 |
Li Y, He L, Yuan D L, Wang Z. 2012. The simulation of trajectory of the floatings in the North Yellow Sea during the oil spilling event in Dalian in summer of 2010. Marine Sciences, 36(11): 1-6.
(in Chinese with English abstract) |
Lie H J, Cho C H, Lee J H, Lee S, Tang Y X, Zou E M. 2001. Does the Yellow Sea warm current really exist as a persistent mean flow?. Journal of Geophysical Research:Oceans, 106(C10): 22199-22210.
DOI:10.1029/2000JC000629 |
Lin X P, Wu D X, Bao X W, Jiang W S. 2002. Study on seasonal temperature and flux variation of the Bohai Strait. Journal of Ocean University of Qingdao, 32(3): 355-360.
(in Chinese with English abstract) |
Lin X P, Yang J Y, Guo J S, Zhang Z X, Yin Y Q, Song X Z, Zhang X H. 2011. An asymmetric upwind flow, Yellow Sea warm current:1. new observations in the western Yellow Sea. Journal of Geophysical Research:Oceans, 116(C4): C04026.
DOI:10.1029/2010JC006513 |
Liu X Q. 1996. Numerical simulation of the Yellow Sea wintertime circulation. Oceanologia et Limnologia Sinica, 27(5): 546-555.
(in Chinese with English abstract) |
Miao J B, Liu X Q, Xue Y. 1991. Study on the formational mechanism of the Northern Yellow (Huanghai) Sea cold water mass (Ⅱ)-Discussion on the solution of the model. Science in China Series B-Chemistry, Life Sciences & Earth Sciences, 34(10): 1270-1280.
|
Miao J B, Liu X Q. 1988. A numerical study of the wintertime circulation in the northern Huanghai Sea and the Bohai Sea Part I:basic characteristics of the circulation. Chinese Journal of Oceanology and Limnology, 6(3): 216-226.
DOI:10.1007/BF02846499 |
Pang C G, Liang J X, Hu D X, Wang F, Chen Y L, Bai H, Bai X Z. 2004. Surface circulation patterns observed by drifters in the Yellow Sea in summer of 2001, 2002 and 2003. Chinese Journal of Oceanology and Limnology, 22(3): 209-216.
DOI:10.1007/BF02842550 |
Pawlowicz R, Beardsley B, Lentz S. 2002. Classical tidal harmonic analysis including error estimates in MATLAB using T_TIDE. Computers & Geosciences, 28(8): 929-937.
|
Prandle D. 1982. The vertical structure of tidal currents and other oscillatory flows. Continental Shelf Research, 1(2): 191-207.
DOI:10.1016/0278-4343(82)90004-8 |
Song J, Yao Z G, Guo J R, Li J, Gao J, Dong J X. 2016. Refining barotropic tide simulations for the Bohai and Yellow Seas using a hybrid data assimilation approach. Marine Science Bulletin, 35(5): 545-553.
(in Chinese with English abstract) |
Su J L, Huang D J. 1995. On the current field associated with the Yellow Sea Cold Water Mass. Oceanologia et Limnologia Sinica Supplement, 26(5): 1-7.
(in Chinese with English abstract) |
Xiu R C, Li F H, Kong X D. 1989. The basic characteristic of tidal flow field in Bohai Sea and North Huanghai Sea. Marine Sciences, 13(5): 1-7.
(in Chinese with English abstract) |
Yu H M, Bao X W, Zhu X M, Chen X E, Wu D X. 2008. Analysis of the high-resolution observed current data in the southern area of the North Huanghai Sea in summer. Acta Oceanologica Sinica, 30(4): 12-20.
(in Chinese with English abstract) |
Zhang Z X, Qiao F L, Guo J S, Guo B H. 2018. Seasonal changes and driving forces of inflow and outflow through the Bohai strait. Continental Shelf Research, 154: 1-8.
DOI:10.1016/j.csr.2017.12.012 |
Zhao B R. 1996. A study of the circulations of the Northern Yellow Sea Cold Water Mass (NYSCWM)-Effects of tidal mixing on them. Oceanologia et Limnologia Sinica, 27(4): 429-435, 459.
(in Chinese with English abstract) |
Zhao J S, Geng S J, Sun H L, Zhang Z L. 1990. The influence of internal tide on the vertical structure of tidal currents in the northern Yellow Sea. Acta Oceanologica Sinica, 12(6): 677-692.
(in Chinese) |
Zhou C Y, Dong P, Li G X. 2015. A numerical study on the density driven circulation in the Yellow Sea Cold Water Mass. Journal of Ocean University of China, 14(3): 457-463.
DOI:10.1007/s11802-015-2759-x |
Zhuang Y, Liu Z Z, Zhai F G. 2017. Analysis on continuous current observation in the northern Yellow Sea. Oceanologia et Limnologia Sinica, 48(4): 703-711.
(in Chinese with English abstract) |