 2019, Vol. 37
Institute of Oceanology, Chinese Academy of Sciences
Article Information
- ZHAO Xinyu, TANG Xuexi, HU Shunxin, ZHONG Yi, QU Tongfei, WANG Ying
- Photosynthetic response of floating Ulva prolifera to diurnal changes of in-situ environments on the sea surface
- Journal of Oceanology and Limnology, 37(2): 589-599
- http://dx.doi.org/10.1007/s00343-019-8081-5
Article History
- Received Apr. 16, 2018
- accepted in principle May. 4, 2018
- accepted for publication May. 14, 2018


2 Laboratory for Marine Ecology and Environmental Science, Qingdao National Laboratory for Marine Science and Technology, Qingdao 266071, China
Yellow Sea green tide (YSGT) has occurred in Qingdao for 11 consecutive years (2007–2017), and Ulva prolifera was the dominant species (Zhao et al., 2013). YSGT originated in Jiangsu Province and bloomed in Qingdao offshore (Wang et al., 2015). The distance of these 2 locations is more than 350 km. The long distance drift is the distinct characteristic of YSGT. The floating U. prolifera algae usually formed a thalli mat during its drift process. Photosynthesis contributed the most assimilatory power to the YSGT. Many investigations have shown that Ulva sp. can adapt to the changes of environment, such as desiccated conditions, light conditions, temperature and salinity (Gao et al., 2011; Wang et al., 2012; Zhang et al., 2013). Gao and Xu (2008) have studied the impacts of solar UV-A, UV-B and PAR on the diurnal photosynthetic performance and growth of Gracilaria lemaneiformis Bory. Diurnal photosynthetic performance of five kinds of seaweeds was measured under natural conditions (Ramus and Rosenberg, 1980). However, little attention has been given to the response of the photosynthetic system of floating U. prolifera mat to diurnal changes of in-situ environments.
Intertidal macroalgae have formed physiological mechanisms to cope with environmental fluctuations, e.g., antioxidant and photoacclimation (Pearson et al., 2000; Plouguerné et al., 2006; Gylle et al., 2009). The photosynthetic compounds in macroalgae has an acclimation to cope with complex environmental changes (Abdala-Díaz et al., 2006). Nonphotochemical quenching (NPQ) is one of its photoprotective responses to environmental changes. The protection mechanism of NPQ acts to dissipate excess energy in the light-harvesting complexes (LHCs) in form of heat (Li et al., 2009). It is assumed that the LHCs protect the plants from light stress (Horton and Ruban, 2005). In green algae, two important light protection genes LhcSR and PsbS, which are both members of the LHCs superfamily, can initiate the NPQ protection mechanism (Li et al., 2000; Peers et al., 2009; Zhang et al., 2013).
NPQ protecting mechanism is not the only protecting mechanism during the process of photosynthesis in the intertidal macroalgae (Gao et al., 2011; Zhang et al., 2013; Zhao et al., 2016). Photosynthetic electron flow can switch between linear electron flow (LEF) and cyclic electron flow (CEF) depending on the excitation balance of the two photosystems, and the excitation energy can be redistributed between the two important photosynthesis components, i.e. photosynthetic system I (PSI) and photosynthetic system Ⅱ (PSII) (Finazzi et al., 2002; Iwai et al., 2010). The rate of electron transport in PSI is higher than that in PSII due to CEF around PSI (Sukenik et al., 2009), and CEF is crucial for protecting plants' photosynthetic apparatus from photodamage (Shikanai, 2007). CEF is important for three kinds of land plants Cleistanthus sumatranus, Celtis philippensis and Pistacia weinmannifolia to protect themselves (Huang et al., 2013), and it has been confirmed that CEF plays an important role in the adaptation of macroalgae Porphyra yezoensis to intertidal environments (Gao and Wang, 2012). Previous study showed that CEF around PSI is important for intertidal macroalgae U. prolifera to adapt to the complex sea surface environment (Zhao et al., 2016), while photosynthetic response of U. prolifera to diurnal changes of environments on the sea surface hasn't been studied beforehand.
To further understand the response of floating U. prolifera thalli mat to diurnal changes of environments, the research based on a specially designed device was conducted, and a control experiment was designed in the laboratory which was processed under suitable conditions (20℃ for temperature, 72 μmol photons/ (m2·s) for light intensity and 30 for salinity). The parameters of chlorophyll fluorescence in U. prolifera were measured. Furthermore, the response of two important light-protection genes (LhcSR and PsbS) to the in-situ environment of sea surface were measured to further investigate the acclimation of U. prolifera on molecular level. A kind of inhibitor 3-(3', 4'-dichlorophenyl)-1, 1-dimethylurea (DCMU) was used to further study the PSI-driven CEF in the sample. In addition, the adaptive mechanisms of energy distribution between PSI and PSII in the thalli against the diurnal changes of in-situ environments on the sea surface was studied under the measurement of RLCs.
2 MATERIAL AND METHOD 2.1 Site descriptions and experimental designAs Fig. 1a shows us, our research can be divided into 2 parts: the one on the left is conducted in the laboratory which is the control of our study, and the other one is the in-situ study for studying the photosynthetic response of floating U. prolifera to diurnal changes in in-situ environments on the sea surface. The thalli samples are collected at the research field of Xiaomai island (36.049 2°N, 120.353 6°E) in Qingdao, China, and the thalli were firstly rinsed gently in sterile seawater and then cleaned with a brush under a magnifier to remove small grazers, attached sediment, and epiphytes. The thalli samples were evenly and randomly divided into 6 parts, and 6 specially designed devices [the sea surface environment simulator (SSES)] were used to conduct the research (Fig. 1b). As shown in Fig. 1b, the devices can float vertically in the sea surface because of the use of buoys and netsukes.

|
| Fig.1 The experimental design of our research a. the left panel is the sketch map of the control experiment in the laboratory, and the right is the sketch map of the experiment in-situ; b. sketch map of the specially designed device which was called sea surface environment simulator; c. location of the research field in Qingdao. |
The control groups were conducted in a thermostatic illumination room in the laboratory. A water tank was placed into the thermostatic room, which was filled with sterile sea water. Ambient temperature, lighting and salinity conditions in the thermostatic room were set to conditions optimum for survival of macroalgae, and the temperature, light intensity and salinity were set to 20℃, 72 μmol photons/(m2·s), 30, respectively (Wang et al., 2012, 2015). The in-situ study was conducted at the research field of Xiaomai Island (Fig. 1c). Our study was conducted in the following 3 days after the thalli samples were collected. We loaded the 6 of the previously separated samples into 6 specially designed devices, and 3 of the 6 devices were placed into the water tank as a control. The other 3 devices were located at the Xiaomai Island. Appropriate amounts of thalli were collected successively at 10:00, 11:00, 12:00, 14:00, 16:00 and 18:00 local time (LT) each day, and we could get 9 replicate samples in the 3 days. The thalli samples collected at each time point were divided into 2 parts: one part was directly used in the experiment to measure the parameters of chlorophyll fluorescence, another was kept in a freezer at -80℃ for molecular experiment.
The environmental factors of photosynthetically active radiation (PAR), sea surface temperature (SST) and salinity at the study field were synchronised measured at the 6 time points previously mentioned. Light intensity was measured using a Dual Radiation Meter (Zhuochuan, China) and the results were recorded as PAR (units: μmol photons/(m2·s)). Surface seawater temperature and air temperature were measured using a mercury thermometer (Fuyang Instrument, China). Salinity was measured using a salinity meter (Lichen, China).
2.2 Measurement of chlorophyll fluorescencePhotosynthetic performance was measured immediately after the thalli were collected using a Dual-PAM-100 fluorometer (Walz, Germany). The maximum quantum yield (Fv/Fm) was determined after the thalli were dark-adapted for 20 min. The low irradiance of the red measuring light (approx. 0.15 μmol photons/(m2·s)) reacted on the thalli was used to determine the initial fluorescence (Fo), and the maximal fluorescence (Fm) was determined after a saturating pulse of white light reacted on the thalli. The maximum quantum yield could be calculated using the equation: Fv/Fm=(Fm–Fo)/Fm, and the parameter of Fv/Fm could reflect the photosynthetic activity of the thalli (Schreiber, 2004).
Rapid light-response curves (RLCs) were measured with 10s illumination times and intensities increasing in 10 steps (PAR 0, 52, 59, 68, 99, 141, 172, 262, 385, 577, and 871 μmol photons/(m2·s)). The values of NPQ under each light intensity could be obtained and NPQ was determined based on the ratio NPQ=(F–Fm ′)/Fm′ (Bilger and Björkman, 1990; Schreiber et al., 1997). NPQ was the parameter of energy dissipation in PSII, and this parameter could reflect the potential ability of the photoprotection in the thalli (Schreiber et al., 1997). Effective efficiencies and relative electron transport rate (rETR) between PSI and PSII could be also measured under the measurement of RLCs.
2.3 Inhibitor treatmentThe inhibitor DCMU was used to treat the sample for the further study of the PSI-driven CEF in U. prolifera. DCMU can block electron transport after QA (the primary acceptor of PSII) and so the LEF is diminished or abolished (Joët et al., 2002). When the thalli were treated with DCMU, they were incubated at room temperature with 10 mmol/L DCMU for 5 min. The thalli were then measured using the Dual-PAM-100 (Walz, Germany).
2.4 Expression of PsbS and LhcSRReal-time quantitative PCRs were performed using the ABI Step One PlusTM Real-Time PCR System (ABI, USA) and SGExcel Fast SYBR Mixture (Sangon Biotech, China) according to the manufacturer's instructions. A 221-bp product of LhcSR was amplified with the primers LhcSR-F (GCATTTGTGAGGCATACCG) and LhcSR-R (TTACCAGTTCTTGTGCGACG), and a 121-bp product of PsbS was amplified with PsbS-F (AACAGGTTCATCCATCACGG) and PsbS-R (TTGCCTCAAACTCATCCTCTG). Tubulin was chosen as the reference gene, and the primers Tub-F (CAAGGATGTCAATGCTGCTGT) and Tub-R (GACCGTAGGTGGCTGGTAGTT) were used to amplify a 112-bp fragment (Zhao et al., 2016).
The thermal profile for the real-time PCR was 3 min followed by 40 cycles at 95℃ for 15 s and 60℃ for 40 s. To confirm that only one specific PCR product was amplified and detected at the end of each PCR, dissociation curve analysis of the amplification products was performed, and the real-time quantitative PCR experiment was conducted in triplicate on each sample. The data were analyzed using the comparative Ct (2-ΔΔCt) method (Livak and Schmittgen, 2001).
2.5 Statistical analysisThe mean values and standard deviation (mean±SD) were calculated according to the different replicates of each treatment (n=9). The results obtained were tested as one-way ANOVA by using the SPSSTM 22.0 statistical software (SPSS Inc., USA). The figures generated using the obtained data were produced using SigmaPlotTM 12.5 software (Systat Software Inc., USA).
3 RESULT 3.1 Records of environmental factorsThe measurements of temperature, salinity and PAR at 10:00, 11:00, 12:00, 14:00, 16:00 and 18:00 LT are shown in Fig. 2. An obvious tendency can be observed in the change in temperature in Fig. 2, i.e., it increases from 10:00 to 12:00 LT (from 27℃ to 35℃), following which it decreases steadily from 12:00 to 16:00 LT (from 35℃ to 24℃); a similar tendency can be seen in the trend of PAR. In the Fig. 2, we can also see that salinity increases from 10:00 (~31) to 16:00 LT (~36.5), in which the slope become gradual from 12:00 to 14:00 LT and it becomes steeper after 14:00 LT. And the values of salinity decline slightly from 16:00 LT (~36.5) to 18:00 (~36).

|
| Fig.2 In-situ environmental factors: temperature on the sea surface, light intensity (photosynthetically active radiation; PAR) and salinity of surface and lower layers |
Diurnal changes in the parameters Fv/Fm of control groups and in-situ groups are shown in the Fig. 3a, and no significant changes can be observed in the thalli of control groups during the daytime. Compared with the control groups, significant changes in the thalli insitu can be observed at 11:00, 12:00, 14:00, 16:00 and 18:00 LT (Fig. 3a), and large changes in Fv/Fm of the thalli in-situ can be observed from 10:00 (~0.62) to 18:00 LT (~0.5) (Fig. 3a). In this figure, Fv/Fm of the thalli in-situ decreases significantly from its highest level (about 0.65) at 10:00 LT to 0.2 at 16:00 LT. However, the value of Fv/Fm increases significantly to about 0.5 at 18:00 LT (P < 0.01; one-way ANOVA).

|
| Fig.3 Diurnal variation of (a) maximum quantum yield (Fv/Fm) and (b) NPQ of Ulva prolifera in the thalli of control groups and in-situ groups Data are the mean results of 9 independent experiments (±SD). Note: ** indicate significant difference between in-situ and control groups (P < 0.01, one-way ANOVA). |
Different tendency can be observed in the results of NPQ. Similar to Fig. 3a, no significant changes are shown in the results of NPQ in the thalli of control groups, and significant changes can be observed in the values NPQ which are obtained by determining the thalli in-situ. From 10:00 LT to 11:00 LT, NPQ in the thalli of in-situ groups increase significantly from 0.13 to 0.17, following which the values decrease drastically to ~0.05 at 16:00 LT (Fig. 3b) (P < 0.01; one-way ANOVA). The values of NPQ of in-situ groups increase significantly to about 0.13 at 18:00 LT (P < 0.01; one-way ANOVA). Significant differentiation is seen during the whole daytime process between the values of NPQ in the thalli of insitu groups and those of control groups (P < 0.01; oneway ANOVA).
3.3 Diurnal variation of rapid light-response curves (RLCs) (NPQ) of the thalliFigure 4 shows the diurnal variation of the mean parameters of NPQ response of the RLCs for the thalli in-situ and those of control groups. It can be seen that the NPQ response increases substantially as the light intensity increases, e.g., the changes of NPQ in the thalli in-situ at 11:00 LT are clearly higher than those at 10:00 LT. The shapes of the other four curves differ significantly from those of 10:00 and 11:00 LT. In the other four curves (the thalli of in-situ groups from 12:00 to 18:00 LT), the trend increases gradually declines in the order of 18:00 > 12:00 > 14:00 > 16:00 LT in comparison with the curves of 10:00 and 11:00 LT. As Fig. 4 shows, the data of NPQ in the thalli of control groups fall in the shadow area, and the shadow area falls into the region those of in-situ groups.

|
| Fig.4 Diurnal variation of mean NPQ of rapid light-response curves (RLCs) in the thalli in-situ and those of control groups Data are the mean results of 9 independent experiments (±SD). |
The responses of the relative gene expressions of LhcSR and PsbS to the diurnal variation of environments are shown in Fig. 5. The level of the two genes which are in the thalli of control groups (10:00 LT) is set to a value of 1, and the results in Fig. 5 show similar tendencies to Fig. 3b. Little change in the relative gene expression of LhcSR in the thalli of control groups can be observed in Fig. 5a, and transcriptional level of LhcSR in the thalli of in-situ increase from 10:00 to 11:00 LT (from 1 to 6), followed by a rapid decrease from 11:00 (~6) to 16:00 LT (~0.5). A sharp increase can be observed from 16:00 to 18:00 LT (from 0.4 to 3.1). Significant different value can be observed between transcriptional level of LhcSR in the thalli of in-situ and that of control groups at 11:00, 12:00 and 18:00 LT (P < 0.01; one-way ANOVA), and the value of transcriptional level of LhcSR in the in-situ thalli is significant lower at 16:00 LT (~0.5) than that of control groups (~1) (P < 0.05; one-way ANOVA). As we can see, the changes in the transcriptional level of PsbS in U. prolifera from 10:00 to 18:00 LT have similar tendencies to those of LhcSR, while the overall value of transcriptional level of LhcSR in the thalli of insitu is higher than that of PsbS in Fig. 5. Transcriptional level of PsbS in the thalli of in-situ groups at 11:00 LT (~3.5) is significant higher than that of control group (P < 0.01; one-way ANOVA), and significant difference in the transcriptional level of PsbS between the thalli of control and in-situ groups can be observed (P < 0.05; one-way ANOVA).

|
| Fig.5 Relative mRNA levels of (a) LhcSR and (b) PsbS in the Ulva prolifera Data are the mean results of 9 independent experiments (±SD). Note: * indicate significant difference between in-situ and control groups (P < 0.05, one-way ANOVA). ** indicate significant difference between in-situ and control groups (P < 0.01, one-way ANOVA). |
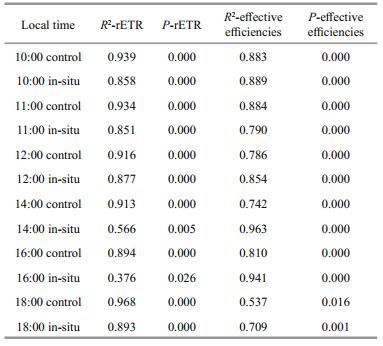
As Fig. 6a shows, the slope of 10:00 LT trendline is more gradual than those of 11:00 LT, 12:00 LT, 14:00 LT, 16:00 LT and 18:00 LT. And we can see that the results of 10:00 LT, 11:00 LT, 12:00 LT and 18:00 LT show better linear relationships than those of 14:00 LT and 16:00 LT (Table 1). As shown in Fig. 6a, all the results which reflect the rETR of control groups between PSI and PSII fall in the shadow area, and the results of rETR of control groups between PSI and PSII are closer to those of in-situ groups. At the same time, location of the dots can also indicate that PSI activity is much higher than that of PSII, and that the rate of electron transport in PSI is higher than PSII. Results of Fig. 6b can better indicate that more quantum yields happen in PSI than PSII as the slope changes of the six trendline. And similar result (the distribution of effective efficiencies between PSI and PSII in the thalli of control groups) to Fig. 6a can be observed in Fig. 6b.

|
| Fig.6 Diurnal variation of energy distribution between PSI and PSII a. relative rates of electron transport (rETR) of PSI and PSII of rapid light response curves (RLCs) of Ulva prolifera; b. effective efficiencies of PSI/PSII of rapid light response curves (RLCs) in the U. prolifera. |
|
Table 2 represent that diurnal variation of ETR(I) (no inhibitor), ETR(I) (DCMU) and ETR(I) (DCMU)/ ETR(I) (no inhibitor) in the thalli increased as time goes by. Little changes of the parameters in the thalli of control groups can be observed during the daytime. Values of ETR(I) (no inhibitor) of in-situ groups at 14:00 LT (27.3±3.1) and 16:00 LT (31.1±2.9) are significantly higher than those of 10:00 LT (13.6±2.4), 11:00 LT (15.3±2.1), 12:00 LT (19.2±1.9) and 18:00 (20.5±2.2). Results of ETR(I) (DCMU) of 14:00 LT (12.1±1.9) and 16:00 LT (14.5±3.5) 18:00 (20.5±2.2) are higher than that of 12:00 (7.1±1.3), which is significantly higher than those of 10:00 LT (3.1±0.7), 11:00 LT (4.3±1.1). Similar consequence can be seen in ETR(I) (DCMU)/ETR(I) (no inhibitor). Significant changes between in-situ groups and control groups can be seen at 12:00, 14:00, 16:00 and 18:00 LT (P < 0.01; one-way ANOVA).

|
YSGT has occurred for 12 consecutive years from 2007 to 2018 (Liu et al., 2010, 2013; Wang et al., 2012). When YSGT happened, a large-scale of U. prolifera floated on the sea surface (Ye et al., 2008; Lin et al., 2011). The sea surface environment changes diurnally and thalli of U. prolifera suffer the changes of typical environmental factors (Kawai and Wada, 2007), such as desiccated conditions, light conditions, temperature and salinity (Gao et al., 2011; Wang et al., 2012; Zhang et al., 2013). Thalli of U. prolifera can well adapt to the diurnal changes of sea surface environment. However, the adaptation strategy of U. prolifera to diurnal changes of sea surface environment hasn't been previously studied. In our present study, we want to know whether the floating U. prolifera can adapt to the diurnal changes of complex sea surface environment (changes of desiccated conditions, light conditions, temperature and salinity) (Fig. 2).
PAR, SST and salinity are all important environmental factors. Parameters of PAR (from 600 μmol photons/(m2·s) to 900 μmol photons/(m2·s)), SST (from 27℃ to 35℃) and salinity (from 31 to 35) from 10:00 to 12:00 LT increase rapidly, and during this time the results of Fv/Fm in the thalli of insitu groups decline gradually (Fig. 2, Fig. 3a). Result of F v/Fm of in-situ groups declines quickly after 12:00 LT (Fig. 3a). This means that the photosynthetic performance of in-situ algae declines slowly from 10:00 LT (~0.62) to 12:00 LT (~0.52), which then declines quickly after 14:00 LT. However, the value of in-situ F v/Fm increases rapidly from 16:00 (~0.2) to 18:00 LT (~0.5) (Fig. 3a). As the result of control groups, little change in photosynthetic performance is observed (Fig. 3a). From the above discussion, we can get the conclusion that the photosynthetic performance is stable, and significant changes in the photosynthetic performance occurs under diurnal changes of environmental conditions on the sea surface. At the same time, the photosynthetic performance of the thalli in-situ can well recover because of some mechanisms.
NPQ is an important photoprotective mechanism for the macroalgae to adapt to the complex sea surface environment (Li et al., 2009). Figures 3b and 4 can well reflect the changes of NPQ in the macroalgae. The mechanism of NPQ in the thalli of control groups does not fully work, because the living condition of control groups is suitable for the survival of the control groups. For the in-situ groups, the process of NPQ can well dissipate excess energy in the lightharvesting complexes (LHCs) as heat from 10:00 (~0.13) to 12:00 LT (~0.13), and this may be one of the reason for the macroalgae to adapt to the sea surface environment during this time (Li et al., 2009). The result of NPQ decreases rapidly after 12:00 LT, because the complex sea surface environment may continuously influence the algae and process of NPQ can not continue to protect the photosynthetic system in the thalli (Figs. 3b, 4). However, the activity of NPQ increases sharply after 16:00 LT (from 0.05 to 0.13), and this may indicate that the process of NPQ recovers.
Two photoprotective related genes LhcSR and PsbS has been used to further study the protection mechanism of NPQ in transcriptional level (Li et al., 2000; Peers et al., 2009; Zhang et al., 2013). The peak values of the transcript levels of the two genes in insitu groups can be seen in 11:00 LT (LhcSR: 6; PsbS: 3.5), and this is similar to the results of NPQ (Figs. 3b, 4, 5). LHCs can protect the plants from light stress, and LHCs superfamily members LhcSR and PsbS can initiate the NPQ protection mechanism (Li et al., 2000; Horton and Ruban, 2005; Peers et al., 2009; Zhang et al., 2013). But the process of NPQ cannot work well after 12:00 LT, while the photosynthetic activity of the macroalgae can still maintain a relatively high level (about 0.5) (Figs. 3, 4, 5). This is a question and we conjecture that there may be some other mechanisms for U. prolifera to adapt to the environment, and results in Fig. 6 may be the best answer for this question.
Allen et al. (1981) confirmed that excess excitation energy will be dissipated if the absorbed radiant energy in one photosystem is more than the other one. Study about marine diatom Phaeodactylum tricornutum (Bohlin) confirmed that light absorbed by the major antenna complex can be equally distributed between PSI than PSII, and green algae can also redistribute the absorbed light energy between the two photosystems (Owens, 1986; Wagner et al., 2006). CEF around PSI is the important factor which results in the increasing of the rate of electron transport in PSI than that in PSII (Sukenik et al., 2009). Huang et al. (2013) concluded that PSI was more sensitive than PSII when the 3 tree species Cleistanthus sumatranus, Celtis philippensis and Pistacia weinmannifolia were exposed to prolonged drought, and CEF is important for the 3 kinds of trees to adapt to the severe environment. Study in Ulva sp. confirmed that PS-I driven CEF might be one of the important factors that help the thalli of Ulva sp. to adapt to the daily cycles of desiccation at low tide and rehydration at high tide (Gao et al., 2011), and the thalli of U. prolifera has the process of CEF and redistribution of energy between PSI than PSII to adapt to environmental changes on the sea surface (Zhao et al., 2016). In our present study, the rates of electron transport of PSI/ PSII in the thalli of in-situ groups in 11:00, 12:00, 14:00, 16:00 and 18:00 LT are higher than that in 10:00 LT (Fig. 6a). And we could observe in Fig. 6b that the slope of the trendlines of in-situ groups from 14:00 to 16:00 LT is significantly higher than those before 12:00 LT. This indicates that more quantum yields happen in PSI than PSII after 14:00 LT (Fig. 6b). Results in Table 2 can confirm that CEF plays a crucial role in protecting the thalli of insitu after 12:00 LT. And ratios of CEF from 14:00 LT (~44.3%) to 16:00 LT (~46.6%) are significantly higher than that in 12:00 LT (~37.0%) (Table 1). This can confirm that CEF plays an important role in protecting thalli's photosynthetic apparatus from photodamage (Shikanai, 2007). And the value of CEF of in-situ groups decreases after 16:00 LT (from 46.6% to 40.0%) (Table 2). This may mean that the activity of CEF declines at this time. The mechanisms of CEF and energy redistribution between PSI and PSII in the control groups don't fully work, and this conclusion is similar to that of NPQ.
Further conclusion can be obtained from the results, and Fig. 7 can vividly introduce how the thalli of in-situ groups to adapt to environmental changes on the sea surface. The process of NPQ, CEF and energy redistribution between PSI and PSII are supplemented each other. Figures 3b, 4 and 7 show that NPQ is an important factor for the thalli to adapt to environmental changes from 10:00 LT to 12:00 LT, while the activity of NPQ decrease significantly after 12:00 LT. The mechanism of energy redistribution between PSI and PSII plays an important role in the photoprotection process after 14:00 LT (Figs. 6 and 7). And the activity of CEF improved significantly after 12:00 LT (Table 2; Fig. 7). These results confirm that the mechanisms CEF and energy redistribution between PSI and PSII are the main synergistic effects for the thalli to adapt to the in-situ environmental changes when the process of NPQ cannot work at all. The process of NPQ, CEF and energy redistribution between PSI and PSII can work together and the photosynthetic activity thalli can recover after 16:00 LT (Fig. 7). This conclusion can well confirm how the thalli of U. prolifera to adapt to diurnal changes of the environment on the sea surface. And the conclusion can further indicate how U. prolifera to adapt to living condition of long distance and long duration drift on the sea surface. The findings of this research also could provide a theoretical basis for explaining outbreaks of the green tide and instructing the management of the problem.

|
| Fig.7 A diagram of photosynthetic response of floating Ulva prolifera to diurnal changes of in-situ environments on the sea surface |
The photosynthetic activity of the thalli of U. prolifera decreases from 10:00 to 14:00 LT and decreases sharply from 14:00 to 16:00 LT, while it can recover after 16:00 LT, and this is because of the synergistic effect of the 3 processes of NPQ, CEF and energy redistribution between PSI and PSII: (1) NPQ is the most important photosynthetic responses to environmental changes before 12:00 LT; (2) the two processes CEF and energy redistribution between PSI and PSII are the main synergistic effects for the thalli to adapt to the in-situ environmental changes when the process NPQ stops working, and the photosynthetic activity decreases sharply because of the lack of NPQ; (3) the 3 processes work together after 16:00 LT so that the photosynthetic activity can recover and the thalli of U. prolifera can adapt to diurnal changes of the environment on the sea surface. The findings of this research also could provide a theoretical basis for explaining outbreaks of the green tide and instructing the management of the problem.
Abdala-Díaz R T, Cabello-Pasini A, Pérez-Rodríguez E, álvarez R M C, Figueroa F L. 2006. Daily and seasonal variations of optimum quantum yield and phenolic compounds in Cystoseira tamariscifolia (Phaeophyta). Marine Biology, 148(3): 459-465.
DOI:10.1007/s00227-005-0102-6 |
Allen J F, Bennett J, Steinback K E, Arntzen C J. 1981. Chloroplast protein phosphorylation couples plastoquinone redox state to distribution of excitation energy between photosystems. Nature, 291(5810): 25-29.
DOI:10.1038/291025a0 |
Bilger W, Björkman O. 1990. Role of the xanthophyll cycle in photoprotection elucidated by measurements of lightinduced absorbance changes, fluorescence and photosynthesis in leaves of Hedera canariensis. Photosynthesis Research, 25(3): 173-185.
DOI:10.1007/BF00033159 |
Finazzi G, Rappaport F, Furia A, Fleischmann M, Rochaix J D, Zito F, Forti G. 2002. Involvement of state transitions in the switch between linear and cyclic electron flow in Chlamydomonas reinhardtii. EMBO Reports, 3(3): 280-285.
DOI:10.1093/embo-reports/kvf047 |
Gao K S, Xu J T. 2008. Effects of solar UV radiation on diurnal photosynthetic performance and growth of Gracilaria lemaneiformis (Rhodophyta). European Journal of Phycology, 43(3): 297-307.
DOI:10.1080/09670260801986837 |
Gao S, Shen S D, Wang G C, Niu J F, Lin A P, Pan G H. 2011. PSI-driven cyclic electron flow allows intertidal macroalgae Ulva sp. (Chlorophyta) to survive in desiccated conditions. Plant and Cell Physiology, 52(5): 885-893.
DOI:10.1093/pcp/pcr038 |
Gao S, Wang G C. 2012. The enhancement of cyclic electron flow around photosystem Ⅰ improves the recovery of severely desiccated Porphyra yezoensis (Bangiales, Rhodophyta). Journal of Experimental Botany, 63(12): 4349-4358.
DOI:10.1093/jxb/ers082 |
Gylle A M, Isaksson D, Ekelund N G A. 2009. Research note: ecotype differentiation in qualitative content of water soluble organic compounds between marine and brackish Fucus vesiculosus L. (Phaeophyceae). Phycological Research, 57(2): 127-130.
DOI:10.1111/pre.2009.57.issue-2 |
Horton P, Ruban A. 2005. Molecular design of the photosystem Ⅱ light-harvesting antenna: photosynthesis and photoprotection. Journal of Experimental Botany, 56(411): 365-373.
|
Huang W, Fu P L, Jiang Y J, Zhang J L, Zhang S B, Hu H, Cao K F. 2013. Differences in the responses of photosystem Ⅰ and photosystem Ⅱ of three tree species Cleistanthus sumatranus, Celtis philippensis and Pistacia weinmannifolia exposed to a prolonged drought in a tropical limestone forest. Tree Physiology, 33(2): 211-220.
|
Iwai M, Takizawa K, Tokutsu R, Okamuro A, Takahashi Y, Minagawa J. 2010. Isolation of the elusive supercomplex that drives cyclic electron flow in photosynthesis. Nature, 464(7292): 1210-1213.
DOI:10.1038/nature08885 |
Joët T, Cournac L, Peltier G, Havaux M. 2002. Cyclic electron flow around photosystem Ⅰ in C3 plants. In vivo control by the redox state of chloroplasts and involvement of the NADH-dehydrogenase complex. Plant Physiology, 128(2): 760-769.
|
Kawai Y, Wada A. 2007. Diurnal sea surface temperature variation and its impact on the atmosphere and ocean: a review. Journal of Oceanography, 63(5): 721-744.
DOI:10.1007/s10872-007-0063-0 |
Li X P, Björkman O, Shih C, Grossman A R, Rosenquist M, Jansson S, Niyogi K K. 2000. A pigment-binding protein essential for regulation of photosynthetic light harvesting. Nature, 403(6768): 391-395.
DOI:10.1038/35000131 |
Li Z R, Wakao S, Fischer B B, Niyogi K K. 2009. Sensing and responding to excess light. Annual Review of Plant Biology, 60: 239-260.
DOI:10.1146/annurev.arplant.58.032806.103844 |
Lin A P, Shen S D, Wang G C, Yi Q Q, Qiao H J, Niu J F, Pan G H. 2011. Comparison of chlorophyll and photosynthesis parameters of floating and attached Ulva prolifera. Journal of Integrative Plant Biology, 53(1): 25-34.
DOI:10.1111/jipb.2011.53.issue-1 |
Liu D Y, Keesing J K, Dong Z J, Zhen Y, Di B P, Shi Y J, Fearns P, Shi P. 2010. Recurrence of the world's largest green-tide in 2009 in Yellow Sea, China: porphyra yezoensis aquaculture rafts confirmed as nursery for macroalgal blooms. Marine Pollution Bulletin, 60(9): 1423-1432.
DOI:10.1016/j.marpolbul.2010.05.015 |
Liu F, Pang S J, Chopin T, Gao S Q, Shan T F, Zhao X B, Li J. 2013. Understanding the recurrent large-scale green tide in the Yellow Sea: temporal and spatial correlations between multiple geographical, aquacultural and biological factors. Marine Environmental Research, 83: 38-47.
DOI:10.1016/j.marenvres.2012.10.007 |
Livak K J, Schmittgen T D. 2001. Analysis of relative gene expression data using real-time quantitative PCR and the 2-ΔΔCT method. Methods, 25(4): 402-408.
DOI:10.1006/meth.2001.1262 |
Owens T G. 1986. Light-harvesting function in the diatom Phaeodactylum tricornutum Ⅱ. Distribution of excitation energy between the photosystems. Plant Physiology, 80(3): 739-746.
|
Pearson G, Kautsky L, Serr?o E. 2000. Recent evolution in Baltic Fucus vesiculosus: reduced tolerance to emersion stresses compared to intertidal (North Sea) populations. Marine Ecology Progress Series, 202: 67-79.
DOI:10.3354/meps202067 |
Peers G, Truong T B, Ostendorf E, Busch A, Elrad D, Grossman A R, Hippler M, Niyogi K K. 2009. An ancient lightharvesting protein is critical for the regulation of algal photosynthesis. Nature, 462(7272): 518-521.
DOI:10.1038/nature08587 |
Plouguerné E, Le Lann K, Connan S, Jechoux G, Deslandes E, Stiger-Pouvreau V. 2006. Spatial and seasonal variation in density, reproductive status, length and phenolic content of the invasive brown macroalga Sargassum muticum (Yendo) Fensholt along the coast of Western Brittany (France). Aquatic Botany, 85(4): 337-344.
DOI:10.1016/j.aquabot.2006.06.011 |
Ramus J, Rosenberg G. 1980. Diurnal photosynthetic performance of seaweeds measured under natural conditions. Marine Biology, 56(1): 21-28.
DOI:10.1007/BF00390590 |
Schreiber U, Gademann R, Ralph P, Larkum A W D. 1997. Assessment of photosynthetic performance of Prochloron in Lissoclinum patella in hospite by chlorophyll fluorescence measurements. Plant and Cell Physiology, 38(8): 945-951.
DOI:10.1093/oxfordjournals.pcp.a029256 |
Schreiber U. 2004. Pulse-amplitude-modulation (PAM) fluorometry and saturation pulse method: an overview. In: Papageorgiou G C, Govindjee eds. Chlorophyll a Fluorescence. Springer, Dordrecht. p.279-319.
|
Shikanai T. 2007. Cyclic electron transport around photosystem Ⅰ: genetic approaches. Annual Review of Plant Biology, 58: 199-217.
DOI:10.1146/annurev.arplant.58.091406.110525 |
Sukenik A, Beardall J, Kromkamp J C, Kopecky J, Masojídek J, van Bergeijk S, Gabai S, Shaham E, Yamshon A. 2009. Photosynthetic performance of outdoor Nannochloropsis mass cultures under a wide range of environmental conditions. Aquatic Microbial Ecology, 56(2-3): 297-308.
|
Wagner H, Jakob T, Wilhelm C. 2006. Balancing the energy flow from captured light to biomass under fluctuating light conditions. New Phytologist, 169(1): 95-108.
DOI:10.1111/nph.2006.169.issue-1 |
Wang Y, Wang Y, Zhu L, Zhou B, Tang X X. 2012. Comparative studies on the ecophysiological differences of two green tide macroalgae under controlled laboratory conditions. PLoS One, 7(8): e38245.
DOI:10.1371/journal.pone.0038245 |
Wang Z L, Xiao J, Fan S L, Li Y, Liu X Q, Liu D Y. 2015. Who made the world's largest green tide in China?—an integrated study on the initiation and early development of the green tide in Yellow Sea. Limnology and Oceanography, 60(4): 1105-1117.
DOI:10.1002/lno.10083 |
Ye N H, Zhuang Z M, Jin X S, Wang Q Y, Zhang X W, Li D M, Wang H X, Mao Y Z, Jiang Z J, Li B, Xue Z X. 2008. China is on the track tackling Enteromorpha spp. forming green tide. In: Nature Precedings. Nature Publishing Group. 2008.
|
Zhang X W, Ye N H, Mou S L, Xu D, Fan X. 2013. Occurrence of the PsbS and LhcSR products in the green alga Ulva linza and their correlation with excitation pressure. Plant Physiology and Biochemistry, 70: 336-341.
DOI:10.1016/j.plaphy.2013.05.024 |
Zhao J, Jiang P, Liu Z Y, Wei W, Lin H Z, Li F C, Wang J F, Song Q. 2013. The yellow sea green tides were dominated by one species, Ulva (Enteromorpha) prolifera, from 2007 to 2011. Chinese Science Bulletin, 58(19): 2298-2302.
DOI:10.1007/s11434-012-5441-3 |
Zhao X Y, Tang X X, Zhang H X, Qu T F, Wang Y. 2016. Photosynthetic adaptation strategy of Ulva prolifera floating on the sea surface to environmental changes. Plant Physiology and Biochemistry, 107: 116-125.
DOI:10.1016/j.plaphy.2016.05.036 |