 2019, Vol. 37
Institute of Oceanology, Chinese Academy of Sciences
Article Information
- YAO Jianting, SHUAI Li, LI Shengyao, XU Caolu, WANG Xiuliang
- Genetic analysis of selected Sargassum fusiforme (Harvey) Setchell (Sargassaceae, Phaeophyta) strains with RAPD and ISSR markers
- Journal of Oceanology and Limnology, 37(3): 783-789
- http://dx.doi.org/10.1007/s00343-019-8140-y
Article History
- Received May. 5, 2018
- accepted in principle Aug. 2, 2018
- accepted for publication Nov. 15, 2018


2 Laboratory for Marine Biology and Biotechnology, Qingdao National Laboratory for Marine Science and Technology, Qingdao 266071, China;
3 Center for Ocean Mega-Science, Chinese Academy of Sciences, Qingdao 266071, China;
4 School of Environmental Science and Engineering, Qingdao University, Qingdao 266071, China;
5 Dongtou Yangqicai Research Institute, Wenzhou 325700, China
Sargassum fusiforme is discontinuously distributed in the lower intertidal zones along the coast of China. Historically, it was regarded as a healthy food in Japan and China (Zhang et al., 2002). Due to the existence of many functional oligo/polysaccharides, and was regarded as healthful seaweed food, and functioned in antioxidant, regulation immunology etc. (Karawita et al., 2004; Ji et al., 2004; Choi et al., 2009; 2010; Zhu et al., 2010). Nevertheless, the present S. fusiforme wild biomass cannot meet the fast need for human consumption and economic requirements, it is urgent to conduct its selection and cultivation with the good varieties.
Since the 1980s, the application and cultivation of S. fusiforme became one of commercial seaweeds industry in Zhejiang and Fujian in south China, and the present output reached up to 8 700 tons/a in Dongtou, Zhejiang, its exhibit northward expansion tendency in China. Nevertheless, a number of wildtype of S. fusiforme were used for propagations in different areas in China, and this caused serious influence to the Sargassum wild resources (Zhang et al., 2002; Haraguchi and Sekida, 2008), and even led to high heterogeneities to S. fusiforme populations. Previously, Wang (2003) investigated the natural distributions of S. fusiforme in Zhejiang and indicated that its natural resources tend to be declined. We suspected that this was mainly due to the collection of natural S. fusiforme for artificial breeding, except for climate warming and coastal environmental side effects.
During the past 15 years' for the S. fusiforme selection in Dongtou, Zhejiang and northern areas in Shandong, it proved that the selective characteristics were stable and the production was high (Li et al., 2010). Nevertheless, it will be confused if judged merely by the morphological features during the selection, it, therefore, needs to conduct the genetic and fingerprint analysis to these cultivars.
Previously, Zhao et al.(2007, 2008) studied the population genetic of S. thunbergii and S. muticum with RAPD and the inter-simple sequence repeat (ISSR) markers, while to S. fusiforme, Park et al. (1998) applied RAPD markers to identify wild isolates from the six sites in Korea. Shan et al. (2009) used AFLP markers to assess the genetic diversities of one S. fusiforme strain. Yu et al. (2012) used ISSR and sequence-related amplified polymorphism (SRAP) markers to study the genetic structure of nine wild S. fusiformis populations in China. Hu et al. (2013) applied mtDNA Cox1 sequences to illustrate the genetic structure and geographic distribution patterns to S. fusiforme. Xu et al. (2014) and Nan et al. (2015) used ISSR markers to investigate genetic diversity, genetic variation to S. fusiforme between the wild and breeding strains.
Based on the selection and cultivations, we adopted the populations of S. fusiforme that cultivated in Dongtou and Zhejiang to analyze their genetic structures with RAPD and ISSR markers. We aim to construct the fingerprint and obtain the screened sequence characterized amplified region (SCAR) markers, in a molecular assistant to S. fusiforme selection and breeding, and for the extraction of brown seaweeds bioactive substance in the future.
2 MATERIAL AND METHOD 2.1 Selection and breeding of S. fusiformeFrom 1993, the selection of the S. fusiforme was initiated during the cultivation. Each year, the selected parental cultivars were applied for the next year's nursery and cultivation, and the objective characters of selected S. fusiforme with high yield was obtained until 2000. After that, the selection and breeding were continuously conducted from 2001, and the successive 9 generations of selected S. fusiforme cultivar were proved to be stable in the practice.
2.2 Strains morphological backgroundThe three selected cultivars of S. fusiforme were collected from the cultivated populations in Dongtou, Zhejiang. The phenotype of strain 3 and 4 namely "Lufeng No.1" was illustrated in our previous study (Li et al., 2010), and was now applied in S. fusiforme production in Zhejiang and Fujian of China, all the Sargassum morphological features were illustrated in Table 1.

To each Sargassum population, usually, 24 individuals were adopted for DNA extraction and further analysis. Plant Genomic DNA Extraction Kit (Tiangen Biotech, Beijing) was applied for DNA extraction, the extracted algal DNA were then electrophoresis on 0.8% agarose gels. Totally, 300 RAPD primers were synthesized from Sangon (Shanghai), after selection and tests, 12 RAPD primers were selected (Table 2).

RAPD reactions were carried out in a 20-μL reaction volume, which contained 1 μL of template DNA solution, 0.25 μmol/L primers, 200 μmol/L each of dATP, dGTP, dCTP, dTTP (Promega, Shanghai), 2.0 mmol/L Mg2+, 1× polymerase buffer (Promega, Shanghai) and 1.0 unit of Taq polymerase (Promega, Shanghai). PCR amplification reaction was performed by Master Thermal Cycler (Effendorf, German) in the procedure of initial denaturation for 5 min at 94°; 45 cycles of 1 min at 94℃, 1 min at 37℃ and 2 min at 72℃; and the final extension of 10 min at 72℃.
To ISSR amplification systems, 90 primers were synthesized by Sangon (Shanghai), finally, 10 primers were adopted (Table 2). The PCR reactions were performed in a 20-μL reaction volume containing 1 μL template DNA solution, 5 pmol primers, 0.1 mmol each of dATP, dGTP, dCTP, and dTTP (Promega, Madison, WI, USA), 1.5 mmol Mg2+, 1× polymerase buffer (Promega, USA), and 1.0 U Taq DNA polymerase (Promega, USA). PCR amplification reaction was conducted using a Master Thermal Cycler (Effendorf, Germany). The cycling parameters were 94℃ for 5 min and 40 cycles of denaturation at 94℃ for 30 s, annealing at the 52℃ for 45 s, and extension at 72℃ for 2 min.
All the RAPD and ISSR reaction products were analyzed on 1.5% agarose gels in the 1× TAE buffer then stained with ethidium bromide, and photographed under UV light for the record by a digital imager (Bio-rad, USA).
2.4 Statistical analysisThose clear and stable repeated amplified bands were scored as present (1), or absent (0) according to the observation. Software POPGENE version 1.31 (Yeh et al., 1997) was used for evaluating genetic variability from the percentage of polymorphic loci (P) at the 99% criterion, the average expected heterozygosis (H) assuming a Hardy-Weinberg equilibrium, and Shannon's information index of genetic diversity (I). Software TFPGA 1.3 (Miller, 1997) was utilized to calculate the Nei's unbiased genetic distance (D) (Nei, 1978) and to construct a dendrogram by means of UPGMA (unweighted pair group method with arithmetic averages) grouping method. The S. horneri was used as the out-group. By bootstrapping 1 000 permutations were performed to assess the robustness of the groupings.
2.5 Sequence characterized amplified region (SCAR) generationTo the amplification of S1027 band, the exhibition of loci (700 bp) which specifically to strain 3 (Lufeng No.1) was selected and sequenced (Fig. 1), and the objective loci were recovered with DNA Recovery Kit (Fastagen, Shanghai). The selected DNA fragments were ligated and transformed with the pGEM-T Easy Vector System I (Promega, USA). After the transformation, white colonies were selected and verified through PCR tests.

|
| Fig.1 Collected S. fusiforme "Lufeng No. 1" (upper) and wild-type (lower) |
SCAR-PCR amplifications were performed in the Master Thermal Cycler (Effendorf, Germany) with a 20-μL reaction volume. Each PCR reaction contained 1 μL template DNA solution, 1× polymerase buffer (Promega, USA), 2.0 mmol Mg2+, 0.1 mmol each of dATP, dGTP, dCTP, and dTTP (Promega, USA), 10 pmol each specific SCAR primer and 1.0 U Taq DNA polymerase (Promega, USA). The thermal profile for PCR was an initial denaturation at 94℃ for 5 min and 40 cycles of denaturation at 94℃ for 30 s, annealing at the 52℃ for 45 s, and extension at 72℃ for 1 min. The PCR products were distanced on 1.5% agarose gels in the 1× TAE buffer, stained with ethidium bromide, and were photographed under UV light and recorded with a digital imager (Bio-rad, USA).
3 RESULT 3.1 Field tests and morphological comparisons of the selected S. fusiformeThe objective characters of S. fusiforme "Lufeng No.1" was started from 2001, and was successive artificially inbred for over 9 generations till 2009, which was cultivated for 2 532 m2 and finally more than 400 tons were yielded, with an average of 6 300 kg/hm2. Compared with the wild-type of S. fusiforme, the selected Sargassum strains, it is obvious in air vesicles, main branch, lateral branch, and growth rate (Figs. 1, 2).

|
| Fig.2 Observation of S. fusiforme "Lufeng No. 1" in cultivation |
Generally, 135 loci ranging from 300 to 2 000 bp were scored, which yielded 11.3 loci per primer averagely. The Nei's (1978) genetic distances (D) between pairs of S. fusiforme populations with RAPD analyze were from 0.111 6 to 0.459 0 (Table 3). The lowest value was between the population's strains 3 and 4, and the highest between the populations 3 and the out-group. The UPGMA dendrograms (Fig. 3) based on pairwise D with RAPD data indicated that populations 3 and 4 clustered together first, and then with populations 2; meanwhile population 1 and 5 clustered together, finally with the out-group.

|

|
| Fig.3 UPGMA dendrograms constructed with Nei's (1978) unbiased genetic distance of S. fusiforme populations with RAPD analysis Population 1: S. fusiforme strain 1; population 2: S. fusiforme strain 2; population 3: S. fusiforme stain 3 (Lufeng No.1); population 4: S. fusiforme strain 4 (Lufeng No.1); population 5: S. fusiforme wild population; population 6: Sargassum horneri. |
The yielded 92 loci ranging from 300 to 2 000 bp were scored, with 9.2 loci per primer averagely. The Nei's (1978) genetic distances (D) between pairs of S. fusiforme populations with ISSR analysis were from 0.086 3 to 0.650 3 (Table 4). The lowest value was between populations 3 and 4, and the highest between populations 3 and the out-group. The UPGMA dendrograms (Fig. 4) based on pairwise D with RAPD data indicated that populations 3 and 4 clustered together first, and the populations 1 and 2 clustered together then with populations 5, finally with the outgroup.

|

|
| Fig.4 UPGMA dendrograms constructed with Nei's (1978) unbiased genetic distance of S. fusiforme populations with ISSR analysis Population 1: S. fusiforme strain 1; population 2: S. fusiforme strain 2; population 3: S. fusiforme stain 3 (Lufeng No.1); population 4: S. fusiforme strain 4 (Lufeng No.1); population 5: S. fusiforme wild population; population 6: Sargassum horneri. |
Base on the RAPD analysis, four loci yielded from the selected two primers were chosen for the DNA fingerprints construction (Table 5), and each of the three S. fusiforme strains exhibited the unique loci pattern and could be distinguished from each other.
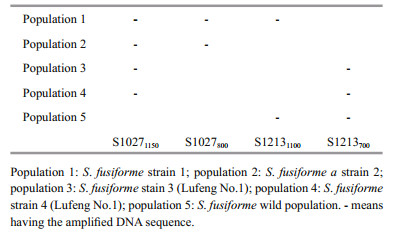
After the sequences analysis, the selected SCAR primers for strain "Lufeng No.1" verification were ACGAGCATGGTGATGCGTTGAAG (forward) and ACGAGCATGGGCATATTGAACGT (reverse), it was proved that the SCAR markers for S. fusiforme strain "Lufeng No.1" was valid (Fig. 5).

|
| Fig.5 SCAR marker verification for the S. fusiforme strains M: DL2000, 1, 2, 3, 4: population 1; 5, 6, 7, 8: population 2; 9, 10: population 3; 11, 12: population 4; 13, 14, 15, 16: population 5; 17: population 6. Population 1: S. fusiforme strain 1; population 2: S. fusiforme strain 2; population 3: S. fusiforme stain 3 (Lufeng No.1); population 4: S. fusiforme strain 4 (Lufeng No.1); population 5: S. fusiforme wild population; population 6: Sargassum horneri. |
To the application of RAPD and ISSR markers systems, it was used mainly for the genetic relations analysis of the five S. fusiforme populations (Figs. 3, 4); and it is shown that there were slight differences in the dendrograms with the two marker systems. Usually, ISSRs markers were more discriminative in cultivar identification than RAPDs system, due to its smaller genetic distances difference. Even with minor genetic diverge, all the strains belong to S. fusiforme clad judged, within the same clade, strains 3 and 4 which collected continuously for the followed two years could be clustered into one group (Figs. 3, 4).
Compared with the wild population, the genetic variation of stain 3 ("Lufeng No.1") could be easily distinguished with RAPD and ISSR fingerprint analysis (Figs. 3, 4). The genetic distances among the wild population and strain 3 and strain 4 ("Lufeng No.1") are 0.187 7 and 0.184 8 respectively, this indicated genetic divergences already occurred during the selection during in the past 15 years (Tables 3, 4).
The phenotypes of selected S. fusiforme strains were stable, however, highly polymorphic loci (83.8%) existed in the selected S. fusiforme populations if detected with AFLP markers (Shan et al. 2009), here in our study, the RAPD and ISSR analysis results either showed that it exhibited highly heterogeneities. We suspected that frequent transplantation and breeding could enhance the gene flows exchange between the alien S. fusiforme and local populations, and this enriched the gene pool to local S. fusiforme population; another reason is that Sargassum phyla have high genetic diversities (Zhao et al., 2007, 2008). Finally, we believed that some loci will be lost if the selection sustained for more time.
It is reported that the SCAR markers are more reproducible and reliable than the RAPD systems (Paran and Michelmore, 1993). Considering the stabilities and reproductions, we generated the SCAR marker for verifying S. fusiforme strain 3 and 4 ("Lufeng No.1"), and proved that it is stable and reproducible in distinguishing the selected S. fusiforme cultivars, further work is needed to conduct verification of the S. fusiforme cultivars to those from the successive selection, this will be positive to S. fusiforme natural and wild populations.
5 CONCLUSIONRAPD and ISSR marker were proved to be valid for analyzing the five strains of S. fusiforme. The constructed fingerprints and SCAR marker to S. fusiforme strain (Lufeng No.1) were applicable to the Sargassum selection, it could be useful in molecular markers assistance in S. fusiforme selection and cultivars identification.
6 DATA AVAILABILITY STATEMENTThe data used to support the findings of this study are available from the corresponding author upon request.
Choi E Y, Hwang H J, Kim I H, Nam T J. 2009. Protective effects of a polysaccharide from Hizikia fusiformis against ethanol toxicity in rats. Food and Chemical Toxicology, 47(1): 134-139.
DOI:10.1016/j.fct.2008.10.026 |
Choi E Y, Hwang H J, Nam T J. 2010. Protective effect of a polysaccharide from Hizikia fusiformis against ethanolinduced cytotoxicity in IEC-6 cells. Toxicology in Vitro, 24(1): 79-84.
DOI:10.1016/j.tiv.2009.08.031 |
Haraguchi H, Sekida S. 2008. Recent changes in the distribution of Sargassum species in Kochi, Japan. Kuroshio Science, 2: 41-46.
|
Hu Z M, Zhang J, Lopez-Bautista J, Duan D L. 2013. Asymmetric genetic exchange in the brown seaweed Sargassum fusiforme (Phaeophyceae) driven by oceanic currents. Marine Biology, 160(6): 1407-1414.
DOI:10.1007/s00227-013-2192-x |
Ji Y B, Gao S Y, Zhang X J. 2004. Studies on anti-tumor activities of Hizikia fusiformis polysaccharide (SFPS) and its mechanism. Chinese Journal of Marine Drugs, 4: 7-10.
(in Chinese with English abstract) |
Karawita R, Siriwardhana N, Lee K W, Heo M S, Yeo I K, Lee Y D, Jeon Y J. 2004. Reactive oxygen species scavenging, metal chelation, reducing power and lipid peroxidation inhibition properties of different solvent fractions from Hizikia fusiformis. European Food Research and Technology, 220(3-4): 363-371.
DOI:10.1007/s00217-004-1044-9 |
Li S Y, Xu C L, Li J P, Yao J T, Liu J D, Duan D L. 2010. Selection, artificial breeding and cultivation of Hizikia "Lufeng No.1". Progress in Fishery Sciences, 31(2): 88-94.
(in Chinese with English abstract) |
Miller M P. 1997. Tools for population genetic analyses(TFPGA) 1.3: a Windows program for the analysis of allozyme and molecular population genetic data.Computer software distributed by author.
|
Nan C R, Zhang P, Lin S Z, Wu C Y, Zhang L N. 2015. ISSR analysis of genetic variation to Sargassum fusiformis wild and breeding strains in Wenzhou. Acta Agriculturae Zhejiangensis, 27(2): 234-239.
(in Chinese with English abstract) |
Nei M. 1978. Estimation of average heterozygosity and genetic distance from a small number of individuals. Genetics, 89: 583-590.
|
Paran I, Michelmore R W. 1993. Development of reliable PCR-based markers linked to downy mildew resistance genes in lettuce. Theoretical and Applied Genetics, 85(8): 985-993.
DOI:10.1007/BF00215038 |
Park J W, Cho Y C, Nam B H, Jin H J, Sohn C H, Hong Y K. 1998. RAPD identification of genetic variation in seaweed Hizikia fusiformis (Fucales, Phaeophyta). Journal of Marine Biotechnology, 6(1): 62-64.
|
Shan T F, Li S Y, Sun J Z, Pang S J. 2009. Morphological comparison of different cultivated strains and AFLP analyses of a typical cultivated population of Hizikia fusiformis at Dongtou, Zhejiang. Journal of Fishery Sciences of China, 16(1): 61-68.
(in Chinese with English abstract) |
Wang W D. 2003. Investigation and study on Sargassum and Hizikia in Zhejiang Province. Journal of Shanghai Fisheries University, 12(3): 227-232.
(in Chinese with English abstract) |
Xu J L, Luo Q J, Yan X J. 2014. Analysis of cultivated characteristics and ISSR of different strains of Sargassum fusiforme (Harv.) Setch. in Dongtou, Zhejang. Journal of Marine Sciences, 32(2): 74-79.
(in Chinese with English abstract) |
Yeh F C, Yang R C, Boyle T, Ye Z H, Mao J X. 1997. Popgene, the user friendly shareware for population genetic analysis. Edmonton, Canada: University of Alberta.
|
Yu S H, Deng Y Y, Yao J T, Li S Y, Xin X, Duan D L. 2012. Population genetics of wild Hizikia fusiformis(Sargassaceae, Phaeophyta) along China's coast. Journal of Applied Phycology, 24(5): 1287-1294.
DOI:10.1007/s10811-011-9778-9 |
Zhang Z, Liu J G, Liu J D. 2002. Study review of Hizikia fusiformis. Marine Fisheries Research, 23(3): 67-74.
(in Chinese with English abstract) |
Zhao F J, Liu F L, Liu J D, Ang P O Jr, Duan D L. 2008. Genetic structure analysis of natural Sargassum muticum(Fucales, Phaeophyta) populations using RAPD and ISSR markers. Journal of Applied Phycology, 20(2): 191-198.
DOI:10.1007/s10811-007-9207-2 |
Zhao F J, Wang X L, Liu J D, Duan D L. 2007. Population genetic structure of Sargassum thunbergii (Fucales, Phaeophyta) detected by RAPD and ISSR markers. Journal of Applied Phycology, 19(5): 409-416.
DOI:10.1007/s10811-006-9147-2 |
Zhu T, Heo H J, Row K H. 2010. Optimization of crude polysaccharides extraction from Hizikia fusiformis using response surface methodology. Carbohydrate Polymers, 82(1): 106-110.
DOI:10.1016/j.carbpol.2010.04.029 |