 2019, Vol. 37
Institute of Oceanology, Chinese Academy of Sciences
Article Information
- NOMAN Md.Abu, MAMUNUR Rashid, M SHAHANUL Islam, HOSSAIN M.Belal
- Spatial and seasonal distribution of intertidal macrobenthos with their biomass and functional feeding guilds in the Naf River estuary, Bangladesh
- Journal of Oceanology and Limnology, 37(3): 1010-1023
- http://dx.doi.org/10.1007/s00343-019-8063-7
Article History
- Received Apr. 13, 2018
- accepted in principle Jun. 1, 2018
- accepted for publication Jul. 3, 2018


2 Department of Fisheries and Marine Science, Noakhali Science and Technology University, Bangladesh;
3 Faculty of Food Engineering and Biotechnology, Tianjin University of Science and Technology, Tianjin 300457, China
Benthos are known as the indicators of past and present environmental conditions of an ecosystem more effectively than physical and chemical indices of water and sediment, and are regarded as the best indicators of pollution as they are sedentary sessile, long-lived and easily collectible (McLusky and Elliot, 2006). The operations of benthic macrofauna in aquatic ecosystem make dynamic sediment mosaic, effectively transports solutes into burrows, increment oxygenation of sediment, stimulate microflora and increase disintegration rates (Jones et al., 1994). This decides that these invertebrate species act as ecosystem engineers (Gogina and Zettler, 2010). They have important roles in food chain and recycling of organic matters, detoxifying pollutants, dispersion, burial and secondary production (Bellan, 2008). So, the study of benthic communities is important because they are bio-indicators of specific environment and habitat conditions. The intertidal zone comprises the majority of the known macrobenthic species and gives important feeding ground to substantial shellfish, coastal birds and fish (Herman et al., 1999). Different physical and chemical composition of the water body, for example, profundity, the ebb, and flow of the water, the natural substance of the sediments, defilements of bed residue condition, the lethality of silt impact the plenitude and dispersion of macrobenthos (Pearson, 1970).
Bangladesh is located at the apex of the world largest bay, the Bay of Bengal, which is at the Sothern part of Bangladesh. It is blessed with an extensive coastline of about 710 km with rich biodiversity (Pramanik, 1988). The southeastern and southwestern bank of this nation is generally secured by a complex estuarine biological system with strong interactions of biotic and abiotic factors. The primary estuarine frameworks of the nation are Karnaphuly, Brahmaputra-Meghna (Gangetic delta), Bakkhali, Matamuhuri, and Naf rivers (Sarker et al., 2016).
The Naf River is a river marking the border between Bangladesh and Myanmar situated in the southeast of Cox's Bazar district. It rises in the Arakan hills on the Southern borders of the district and flows into the Bay of Bengal. This territory includes fisheries, mangroves, seagrass, salt swamps, salt beds, birds, deltas, coral reefs, sand ridges, and minerals. The Naf River estuarine condition, which fills in as sustaining, spawning and nursery ground for an assortment of creatures, differs as per the volume of discharge of the river and tidal range (Sarker et al., 2016).
The estuarine environment plays many economically significant roles in many ways. Though the estuarine area of Bangladesh has high faunal diversity, it has given least importance due to lack of sufficient research. Realizing the importance, a number of works pertaining to macrobenthos of coastal and estuarine waters of Bangladesh has been carried out e.g., Alam (1993); Belaluzzaman (1995); Khan et al. (2007); Hossain et al. (2009); Abu Hena et al. (2013); Asadujjaman et al. (2012); Islam et al. (2013). However, information on macrobenthos of the Naf River estuary is scant despite it provides many ecological and economic services to the people of Bangladesh. Therefore, the aims of our study were 1) to assess the spatial and seasonal distribution of intertidal macrobenthos, 2) To characterize the biomass and the feeding guild composition along the different estuarine regions and seasons in the Naf River estuary. The result of this investigation could serve as background information for this area.
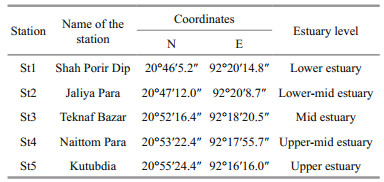
2 MATERIAL AND METHOD 2.1 Study area and study timelineThe Naf River is situated in the southeastern region of Bangladesh. It enters into Bangladesh from Myanmar through the Teknaf (21°03′29″N, 92°15′46″E) and then meets with the Bay of Bengal (20°43′6.5″N, 92°22′14.7″E) (Fig. 1). The study was conducted in two seasons; pre-monsoon (March 2016) and monsoon (September 2016).

|
| Fig.1 Locations of the sampling stations in the Naf River estuary |
Five stations were selected from the mouth to head region of the Naf River estuary. All the stations were selected from different estuary elevation. The station which was near to the mouth of the estuary was named as lower estuary (St1) and the station near to the head region of the river was named as upper estuary (St5). Similarly, the mid-region of the estuary was named as mid-estuary (St3) while the other two stations were named as lower-mid estuary (St2) and upper-mid estuary (St4) (Table 1).
Sediment samples were collected using a hand corer having a mouth opening of 0.01 m2. Samples were collected from the intertidal zone during the low tide period of the river. From each station, five replicate samples were collected. After collecting the sediment samples were mixed gently in the water and sieved through a 500-μm mesh size screen to retain the sediment residues. Collected residues were immediately preserved in 10% formalin solution in the plastic container and were carried to the laboratory for further analysis. To increase the visibility of benthic macro-fauna, a small amount of "Rose Bengal" was added to the sediment sample of the plastic container in the laboratory. Benthic fauna was sorted out from the sediment. Then the sorted organisms were preserved in 70% ethanol solution in small vials. Identification of benthos to lowest possible taxon was done by using an optical microscope following Al-Yamani et al. (2012). The organisms were counted and calculated after observing the total amount of inds./m2.
2.3 Feeding guilds assignments and weighing of the macrofaunalAccording to Fauchald and Jumars (1979), a feeding guild is an arrangement of organisms that absorb sustenance assets through a similar intake mechanism from a similar type of source, independently of their phylogenetic connections. In this study, the feeding guilds were classified as carnivores (C), surface deposit feeders (SD), deposit feeders (D), scavengers (SC), herbivores (H), filter feeders (F) and omnivores (O) following Hutchings (1997) and Hossain (2011). Macrobenthos were weighted using electronic precision balance (EK 600i, Model: AND, capacity: 600 g, Div: 0.01 g).
2.4 Data processing and analysisThe mean abundance and standard deviation (SD) of each group in each station were calculated from the estimates of total abundance in each replicate. Seasonal and spatial variability of benthic abundance was analyzed by two-way ANOVA using PAST. The diversity of the benthic fauna was determined using the Shannon-Wiener index (H′), Pielou's evenness index (J′) and Margalef's richness index (D). Seasonal and spatial variations in these benthic indices were analyzed through two-way ANOVA. The diversity indices were calculated using PAST (version 2.17). Similarity percentages analysis (SIMPER) was carried out to know the major taxa, which characterize the groups and those most responsible for the discrimination among the stations and seasons. Twoway ANOSIM permutation test was carried out to explore the difference in Biomass of feeding guilds among the stations and seasons. A cluster analysis based on the abundance of taxa identified at each station (with all replicate samples) was analyzed through Primer software (Version 6). Before conducting both ANOSIM and Cluster analysis, Bray-Curtis similarity matrices were constructed based on the square root transformation of the abundance data. The mean abundance with the standard deviation of each group was used to compare the assemblages of macroinvertebrates in study station.
3 RESULT 3.1 General characterization of macrobenthosIn total, 47 macrobenthic taxa were identified comprising 25 taxa of Polychaeta, eight taxa of Gastropoda, five taxa of Amphipoda, three taxa of Isopoda and only one taxon from each group of Tanaidacea, Mysida, Decapoda, Echinodermata, and others. Polychaeta was the most dominant group bearing 60% of the total abundance followed by Mysida 17.4%, Isopoda 11.17%, Gastropoda 7.4%, Amphipoda 1.23%, Bivalvia 1.06%, Decapoda 0.8%, Tanaidacea 0.18%, Echinodermata 0.09%, and others 0.7% (Fig. 2). Total macrobenthic abundance ranged from 880 to 5 320 inds./m2 (average: 2 272± 1 539.50 inds./m2) (Table 2). The highest number of macrofauna was recorded on the mid-lower estuary region (St2) and lowest was found at the upper estuary region (St5) in the pre-monsoon. Macrobenthic abundance was dominated by Polychaeta, Gastropoda, Amphipoda or Isopoda depending on the area considered. Lumbrineridae, Nereididae, and Mysidae were the most abundant family in this region (Table 2).

|
| Fig.2 Percentage composition of major macrobenthic groups at different estuary region |
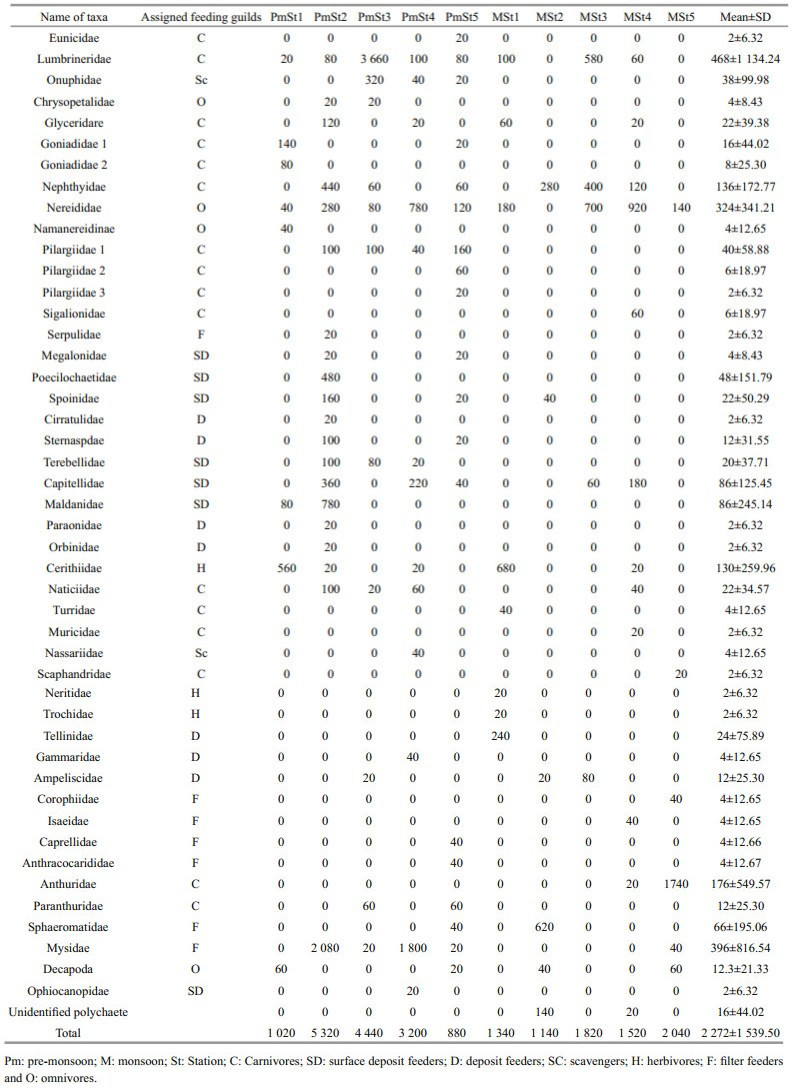
The distribution of macrofauna varied with the estuarine region. The maximum abundance of macrobenthic fauna was found at three mid-estuarine stations bearing 3 230±3 380 inds./m2 at lower-mid estuary region (St2), 3 130±1 782 inds./m2 at midestuary region (St3) and 2 360±1 838 inds./m2 at midupper estuary region (St4) (Fig. 3). On the other hand, the abundance of macrofauna was lower at the upper estuary; St5 (1 460±1 838 inds./m2) and the lowest number of fauna found at the lower estuary region; St1 (1 180±792 inds./m2) (Fig. 3). Polychaeta dominate the mid-estuary (St3), mid-lower estuary (St2) and mid-upper estuary (St4) bearing respectively 97%, 53% and 55% of the total macrobenthos of respective station whereas other two stations bear 31% and 27% of Polychaeta respectively at lower estuary (St1) and Upper estuary (St5). The lower estuary region (St1) was dominated by Gastropoda bearing 56% and the Upper estuary region (St5) dominated by Isopoda bearing 65% of the total macrofauna.

|
| Fig.3 Seasonal and spatial distributions of macrobenthos during this study |
Mysida was abundant in the mid-lower estuary (32%) and mid-upper estuary (38%) and 2 nd in the rank after Polychaeta. Isopoda comprises 10% of total macrofauna at mid-lower estuary whereas other four stations bearing a very small number of Isopoda. In the lower estuary. Bivalvia comprises 10% of total macrobenthos at St1, but Bivalvia was not found in the other four stations (Fig. 2).
3.3 Seasonal distribution of macrobenthosIn the present investigation, 14 860 individuals were found at the pre-monsoon period and 7 860 individuals were found in the monsoon period (Table 3). The average density of macrobenthos at each station was 2 972±1 994 inds./m2 in the premonsoon 1 572±361 inds./m2 in the monsoon season. The Polychaetes were the most abundant in both seasons. In the pre-monsoon period, 65% of Polychaetes were found while 50% of Polychaetes were found during monsoon (Table 3).
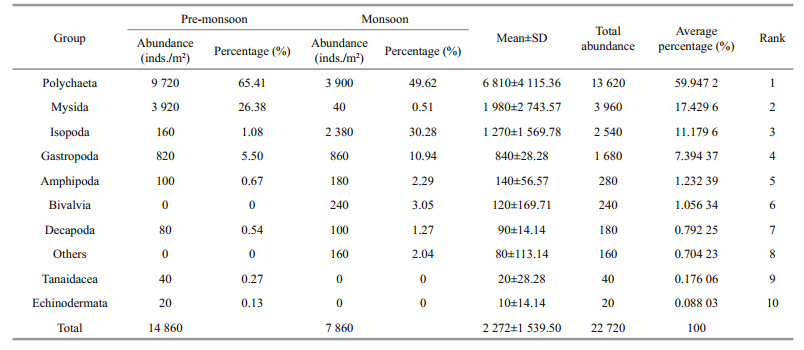
Polychaeta was found at all the stations from the lower estuary to the upper estuary in both seasons. Mysida (26%) and Gastropoda (6%) got the 2nd and 3rd rank in the pre-monsoon period whereas in the monsoon they were replaced by Isopoda (30%) and Gastropoda (11%) (Table 2). The number of taxa also varies with the season (Fig. 4). Thirty-six taxa were identified in the pre-monsoon while only 23 taxa were found in monsoon period, which shows a clear seasonal variation.

|
| Fig.4 Seasonal variation of the number of identified taxa at different estuary region |
From the two-way ANOVA, the abundance of macrobenthos was significantly different among stations (F=3.37, P=0.01) and seasons (F=9.40, P=0.003). The number of taxa was significantly different in stations (F=6.74, P=0.000 3) and seasons (F=12.74, P=0.000 9).
3.4 Functional feeding guild compositionSeven feeding guilds have found from the study area: carnivore (C), surface deposit feeder (SD), scavenger (Sc), omnivore (O), herbivore (H), filter feeder (F), deposit feeder (D). Among these, carnivores and filter feeders were dominant, surface deposit feeders and omnivores were less abundant (Fig. 5). In addition, scavengers, herbivores, and deposit feeders were less in number (Fig. 6).

|
| Fig.5 Percentage of different feeding guilds at different estuary regions |

|
| Fig.6 Mean of various feeding guilds composition at different seasons |
In terms of occurrence and abundance, the carnivorous species (C) and omnivorous species were higher in both seasons. Filter feeders (F) and surface deposit feeders (SD) were higher in the pre-monsoon but decreased in the monsoon period. In the premonsoon, scavengers (Sc) had the lowest abundance whereas in monsoon the lowest was the deposit feeders (D) (Fig. 6).
3.4.2 Guild variation in spaceFrom Fig. 5, carnivores were dominant in upper (St5; 77%) and mid (St3; 77%) estuary, filter feeders were dominant in upper-mid (St4; 39%) and lower mid-estuary (St2; 43%) and herbivores in lower estuary (St1; 51%).
3.5 Biomass composition of feeding guildsThis study observed that the total biomass of omnivorous species is higher (149.17 g/m2) than any other feeding guilds. The lowest one is scavengers (6.64 g/m2) because, in monsoon, it was null (Fig. 7).

|
| Fig.7 Biomass composition (g/m2) of various feeding guilds at different seasons |
In monsoon, the biomass of omnivores was higher (135.8 g/m2) and deposit feeders (1 g/m2) had lower biomass. However, in pre-monsoon, herbivores had higher biomass (51.47 g/m2) and filter feeders had lower biomass (4.52 g/m2) (Fig. 7).
3.5.2 Biomass variation in spacesThe average biomass of carnivores was higher in St3 (77%) and St5 (77.40%) whereas herbivores (Fig. 7) was dominant in St1 (51.35%) and filter feeders were dominant (Fig. 8) in St2 (43.17%) and St4 (39.15%).

|
| Fig.8 Percentage of biomass composition at different estuary region |
Analysis of Similarity (ANOSIM) indicated that the biomass of feeding guilds was not showing a significant difference among the seasons (R=0.112, P=0.23) and regions (R=0.12, P=0.32). The pairwise test also showed that there is no significant difference among the group of different regions.
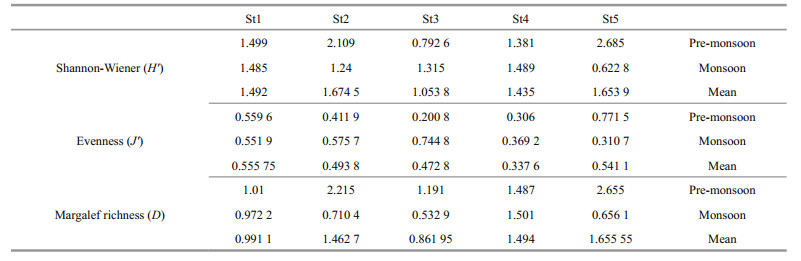
3.6 Macrobenthic diversity indicesThe Shannon-Wiener (S-W) diversity index (H′) of the benthic macroinvertebrates was significantly different among stations (F=3.91, P=0.009) but not among the seasons (F=2.42, P=0.12). ShannonWiener index value was higher in the pre-monsoon (1.69) than in the monsoon (1.23) season. The value of the Shannon-Wiener index (H′) was 1.49 at St1, 1.67 at St2, 1.05 at St3, 1.44 at St4 and 1.65 at St5 (Table 4). It is visible from the Table 4 that any station did not show very sharp differences in the mean values of diversity index amongst each other. Pielou's evenness index (J′) was similar to H′ and was not significantly different among seasons (F=2.23, P=0.14) but among stations (F=2.88, P=0.03). The value of J′ was 0.45 at pre-monsoon and 0.52 in the monsoon season. Pielou's evenness index showed that the value was relatively higher in upper and lower estuary than the three mid estuarine station (Table 4). Margalef's richness index (D) was significantly different among stations (F=6.5, P=0.000 4) and season (F=12.42, P=0.001). The D value showed the difference between season (pre-monsoon=1.71, monsoon=0.87). The Margalef's richness values of five stations were 0.99 at St1, 1.46 at St2, 0.86 at St3, 1.49 at St4 and 1.66 at St5 (Table 4). It showed that the species richness of this area was higher in the premonsoon period and spatially higher richness was found at the lower-mid, upper-mid and upper estuary regions.
Similarity percentage (SIMPER) was done to find out the species characterizing each station and seasons. The dissimilarity was much higher among the seasons (84.88%) and stations (81.61%). The highest dissimilarity among the station revealed at lower estuary region with the mid-estuary region; upper estuary with mid-estuary (86.06%). Dominant taxa (contribution ≥ 10%) of each spatial and seasonal group were identified using Simper analysis. The gastropods of the family Cerithidae, bivalves of the family Tellinidae, polychaetes of the families Nereididae and Goniadidae dominated at lower estuary; St1 (21.22%, 15.78%, 12.94% and 10.4% of the contribution, respectively). The lower-mid estuary (St2) was dominated by Mysids of the family Mysidae, polychaetes of the family Maldanidae and isopods of the family Sphaeromatidae (28.13%, 15.12% and 10.1% respectively); the polychaetes of the families Lumbrineridae and Nereididae were higher in Mid-estuary; St3 (58.97% and 14.83% respectively); Mysidae and Nereididae in upper-mid estuary; St4 (35.52% and 25.78% respectively) and only the isopods of the family Anthuridae was dominant in the upper estuary (St5) bearing 61.93%. In the pre-monsoon season Lumbrineridae and Mysidae were identified as dominant species (24.51% and 18.76%, respectively) and in the monsoon season Anthuridae, Nereididae, and Cerithidae were dominant bearing 23.03%, 19.98%, and 11.87%, respectively.
3.8 Cluster analysisCluster analysis of all the replicate samples, based on the abundance of major groups of taxa at each station demonstrated eight major clusters at 40% level of similarity. Except for the second cluster, all the clusters showed the grouping of the seasonality of the samples. Five samples of the monsoon mixed up with the four samples of the pre-monsoon and made the second cluster. Most of the cluster also showed the similarity of samples among the stations. The horizontal line indicates 40% similarity of identified taxa at every station among both seasons (Fig. 9).

|
| Fig.9 Bray-Curtis similarity dendrogram showing a grouping of replicates sampled during both seasons Data were transformed into square root. St: station; S: replicate samples. |
In the present study the abundance of benthic organisms were in the sequence of Polychaeta > Mysida > Isopoda > Gastropoda > Amphipoda > Bivalvia > Decapoda > Tanaidacea > Echinodermata (Table 3). Alam (1993) identified 8 major taxa namely Polychaeta, Decapoda, Bivalvia, Gastropoda, Amphipoda, Mysidacea, Pisces and Diptera from the intertidal zone of the Halishar coast, Chittagong. In the present investigation, nine groups were identified including those and adding some other groups (Isopoda, Tanaidacea, and Echinodermata). In the Naf River estuary, the Polychaeta were the dominant species and constituted 60% (Fig. 2). Polychaeta was found in all stations of the study area. Asadujjaman et al. (2012) studied the occurrence and abundance of macrobenthos of Hatiya and Nijhum Dweep Islands. They reported that Polychaeta was dominant by contributing 45.03% of total macrobenthos. Findings of Khan et al. (2007) and Pravinkumar et al. (2013) support the results of the present investigation. Khan et al. (2007) studied the diversity, distribution, and abundance of Mouri River, Khulna. They identified 20 different species and Polychaeta dominated all over the river. Pravinkumar et al. (2013) studied the benthic biodiversity of Pichavaram mangroves, southeast coast of India. They identified 22 species from the three stations of that area, of which 16 species were from Polychaeta. Hossain et al. (2009) found that Oligochaeta (53.75%) were higher than Polychaeta (33.31%) in Meghna River estuarine bed which shows a difference with the findings of the present investigation.
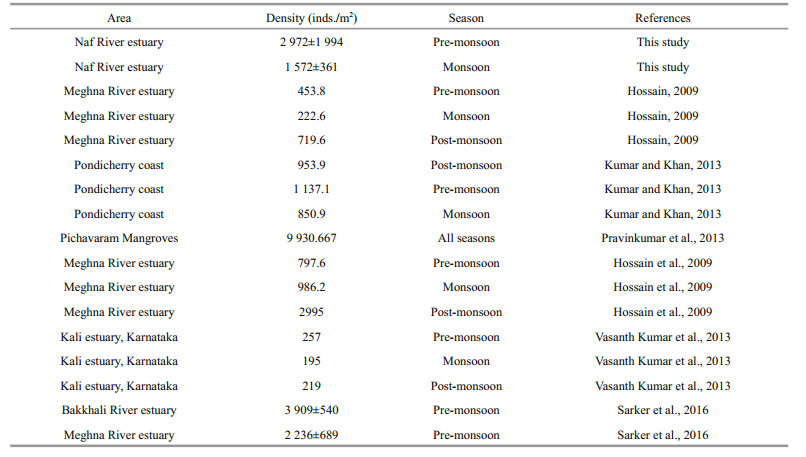
4.2 Comparison of macrobenthic species abundanceMacrobenthic organisms were abundant in premonsoon but lower during the monsoon period (Fig. 3) bearing the mean abundance of 2 972±1 994 inds./m2 and 1 572±361 inds./m2, respectively. Hossain (2009) studied polychaete diversity in estuarine bed of Meghna River and found that, the species density is higher in the pre-monsoon and postmonsoon period and lower in monsoon period, which is similar to present study (Fig. 3), and Hossain (2009) observed the highest value (719.6 inds./m2) during postmonsoon and the lowest (222.6 inds./m2) in monsoon (Table 5). Kumar and Khan (2013) explored the seasonal variation in the distribution of macrobenthos along the Pondicherry coast of India and reported that faunal community had shown greater density during the post and pre-monsoon seasons (953.9 and 1 137.1 inds./m2) but it was lower during the southwest monsoon season (850.9 inds./m2) (Table 5). Pravinkumar et al. (2013) studied the benthic biodiversity in the Pichavaram mangroves, Southeast Coast of India. They also reported a higher abundance of macroinvertebrate in summer and lower during monsoon (Table 5). However, most of the researchers reported that the abundance of infauna decreased during the monsoon period due to rainfall (Hossain et al., 2009) (Table 5). Two months before monsoon sampling period; July and August, the average rainfall was 647 mm and 500 mm, respectively, and was the highest of that year, which may have led to the lower abundance during the monsoon period. Ansari et al. (1986), Nandan and Azis (1996), and almost all investigators showed that the abundance and diversity were higher towards the mouth of the estuary and lower to the upstream. But Hossain et al. (2009) reported the reverse situation in Meghna estuary (Table 5). The present study found a higher abundance in mid-estuary (Fig. 3). The abundance was almost similar in both seasons at St1, St3, and St4. At the St2 the abundance was higher in pre-monsoon and lower in the monsoon period, but at the St5 the situation was quite opposite. Because the St2 was beside the local anglers' community, fishing activities increase in that region in the monsoon season. The St2 is also near to the terminal of a tourism passenger ship. Therefore, human activities increase in this area in the premonsoon season for tourism purpose. It is clearly visible from this study that the human intervention might be responsible for the discrimination of abundance of macrobenthos in this are.
Shannon-Wiener index of diversity in the present study had shown a variation range from 1.05 to 1.67 (Fig. 10). Khan et al. (2007) found that the ShannonWiener (H′) Index value ranging from 1.20±0.23 to 1.49±0.753. Hossain et al. (2013) observed that the value ranged from 1.22 to 1.49. The Shannon-Wiener (S-W) index of diversity (H′) of this study is significantly different among stations (F=3.91, P=0.009) but not among the seasons (F=2.42, P=0.12). Xu et al. (2016) found that the result of the ShannonWeiner index (H′) was not significantly different among seasons but among regions, which supports the findings of this study. On the other hand, Shou et al. (2009) encountered the Shannon-Weiner index of macrobenthos has no significant differences among sections but between seasons. Sharif et al. (2017) investigated that benthos diversity (H′) did not show much variation among the seasons (0.92±0.52 and 0.85±0.40 for the monsoon and post-monsoon seasons respectively). In the current study, we also found that the diversity (H′) of macrobenthos showed less variation between pre-monsoon (1.69) and monsoon (1.23). In the study of Sharif et al. (2017), spatially the highest diversity (H′) was recorded at Bhola (1.53) during monsoon and the lowest was at Chandpur (0.29) during monsoon, which supports the findings of current research (Fig. 10). Pielou's evenness index (J′) was not significantly different among seasons (F=2.23, P=0.14) but among stations (F=2.88, P=0.03). This result shows a difference between the findings of Xu et al. (2016) and Shou et al. (2009). They found that Pielou's evenness index (J′) was not significantly different among either seasons or regions. Sarker et al. (2016) analyzed that the Margalef's species richness in Bakkhali and Meghna estuary were 2.21±0.43 and 1.36±0.11 respectively. In the present study, Margalef's species richness ranged from 0.86 to 1.66 (Fig. 10). Margalef's richness index (D) was significantly different among station (F=6.5, P=0.000 4) and season (F=12.42, P=0.001) which is similar to the findings of Xu et al. (2016).

|
| Fig.10 Seasonal and spatial distribution of macrobenthic organism's richness (D), diversity (H′), evenness (J′) |
Hossain (2011) found carnivores (C) as a numerically dominant group in the Meghna river estuarine bed. Muniz and Pires (1999) studied the trophic structure of Polychaeta and found carnivores (C) as the dominant group, which agrees with the present study. Gaudêncio and Cabral (2007) found 7 distinct trophic group and surface deposit (SD) feeders were dominant in that estuary comprising about 52% of the benthic community. In the present study, the highest incidence of carnivores occurred in the upper estuary (St5) and mid-estuary (St3) during pre-monsoon. Mandal and Harkantra (2013) recorded that most of the benthic fauna were deposit-feeders (D). Chardy and Clevier (1988) found that the surface deposit feeders (SD) represented two third of the total biomass and carnivores (C) together made up 9.5% of the macro-zoo-benthic ash-free dry weight. Gaston and Nasci (1988) found that macrobenthic assemblages of the Calcasieu estuary were numerically dominated by deposit-feeding species (D). These findings disagree with the results of the present study.
Baird and Ulanowicz (1993) and Gaston and Nasci (1988) reported that surface-deposit feeders were the most populated macrobenthos of the upper estuary but in the lower estuary subsurface-deposit feeders had the majority, and a trophically very well mixed composition possessed in the mid-estuary. Muniz and Pires (1999) found subsurface deposit-feeding species were slightly higher in the northern region of the Sao Sebastiao Channel while filter feeders (F) were dominant in the central region of the channel. These also support the findings of the present study.
Ysebaert et al. (1993) also found omnivores (O) as dominant in the brackish water of Schelde estuary, which supports the result of this study. We found that carnivores (C) were one of the dominant groups in terms of biomass in both seasons. Elliott and Tylor (1989) also observed that biomass of carnivores (C) dominated in the Forth estuary, Scotland that supports the result of this study. Chardy and Clavier (1988) reported that according to the biomass, the suspensionfeeders are dominant by weight among the trophic groups, which represent 67% of the aggregate zoobenthic ash-free dry weight. Harriague et al. (2006) found deposit feeders as the dominant contributor to the total biomass at the Ligurian Sea. Results of these studies disagree with the findings of the current study. The difference in ecological characteristics such as- water parameters, sediment characteristics, grain size, organic content, habitat condition and anthropogenic factors might be the cause of such variation.
4.5 SIMPER's comparisonsMolla et al. (2015) found that average disparity was most elevated among the groups of pre-monsoon and winter (61.34%) whereas the least esteem was for the group of post-monsoon and monsoon (39.30%) when studying the spatiotemporal variations of the macrobenthic annelid community of the Karnafuli River estuary, Chittagong, Bangladesh. Khan et al. (2017) studied the changes in macrobenthic community structure from estuary to continental slope in the southeast coast of India and found that the similarity levels among the macrobenthos from each region were low and the dissimilarity among the regions was much higher side. In the present investigation, we found that the dissimilarity is higher among the stations (81.61%) and seasons (84.88%), which support the above findings.
4.6 Other analytical comparisonsCluster analysis was utilized in this investigation to calculate the level of similarity among the different estuarine regions and seasons of Naf river estuary. At 40% similarity level, distinct seasonal clustering of macrobenthic assemblages was noticed in the present research (Fig. 9). Molla et al. (2015) reported similar seasonal changes in community structure coupled with seasonal groups in several macrobenthic faunal surveys. The second cluster shows the mix up of replicate samples from both seasons. This is because of all the samples of that cluster are from the lower estuary region (St1); the abundance and species composition of lower estuary region were almost similar in both seasons. However, it showed the distinct grouping of that region from the other clusters. Pravinkumar et al. (2013), Khan et al. (2017) found that the stations of respective zones formed groups separately demonstrating the variation in species composition and abundance, and the findings of the present investigation are also supported by their results.
5 CONCLUSIONIn this study, forty-seven taxa were identified under nine major groups. The maximum abundance of macroinvertebrate was recorded at a mid-estuarine level during pre-monsoon. Macrobenthos were significantly different among stations and seasons. Diversity indices (H′ and J′) were significantly different between seasons but not among stations. The cluster analysis plot showed the difference in the distribution of macrobenthos in both seasons and regions. It can be concluded that the different estuarine region and seasonality might influence the distribution of macrobenthos. Amount of biomasses had no significant difference among the seasons and regions, but the type of feeding guilds showed numerically different composition among the regions. However, further research should be conducted to know the comprehensive scenario including the physical and chemical parameters, and to study the functioning of this ecosystem.
Abu Hena M K, Japar Sidik B, Aysha A, Ahasan H, Short F T. 2013. Estuarine macrophytes at Bakkhali, Cox's Bazar, Bangladesh with reference to mangrove diversity. Chiang Mai. J. Sci., 40(4): 556-563.
|
Alam M S. 1993. Macrobenthos of Intertidal zone of Halishahar Coast, Chittagong. University of Chittagong, Chittagong, Bangladesh. 243p.
|
Al-Yamani, F Y, Skryabin V, Boltachova N, Revkov N K, Makarov M, Grintsov V, Kolesnikova E. 2012. Illustrated Atlas on the Zoobenthos of Kuwait. Kuwait Institute for Scientific Research, Safat, Kuwait.
|
Ansari Z A, Ingole B S, Banarjee G, Parulekar A H. 1986. Spatial and temporal changes in benthic macrofauna from Mandovi and Zuari estuaries of Goa, west coast of India. Indian J. Mar. Sci., 15(4): 223-227.
|
Asadujjaman M, Hossain M B, Shamsuddin M, Amin M A, Azam A K M. 2012. Occurrence and abundance of macrobenthos of Hatiya and Nijhum Dweep Islands, Bangladesh. Middle-East J. Sci. Res., 11(2): 184-188.
|
Baird D, Ulanowicz R E. 1993. Comparative study on the trophic structure, cycling and ecosystem properties of four tidal estuaries. Mar. Ecol. Prog. Ser., 99: 221-237.
DOI:10.3354/meps099221 |
Belaluzzaman A M. 1995. Ecology of the Intertidal Macrobenthic Fauna in Cox's Bazar Coastal Area, Bangladesh. University of Chittagong, Bangladesh. 199p.
|
Bellan G. 2008. Pollution indices. In: Jorgensen S E, Fath B eds. Encyclopedia of Ecology. Elsevier, Amsterdam.p.2 861-2 868, https://doi.org/10.1016/B978-008045405-4.00127-0.
|
Chardy P, Clavier J. 1988. Biomass and trophic structure of the macrobenthos in the south-west lagoon of New Caledonia. Mar. Biol., 99(2): 195-202.
DOI:10.1007/BF00391981 |
Elliott M, Taylor C J L. 1989. The production ecology of the subtidal benthos of the Forth Estuary, Scotland. Scient.Mar., 53(2-3): 531-541.
|
Fauchald K, Jumars P A. 1979. The diet of worms:a study of polychaete feeding guilds. Oceanogr. Mar. Biol. Ann.Rev., 17: 193-284.
|
Gaston G R, Nasci J C. 1988. Trophic structure of macrobenthic communities in the Calcasieu estuary, Louisiana. Estuary, 11(3): 201-211.
DOI:10.2307/1351973 |
Gaudêncio M J, Cabral H N. 2007. Trophic structure of macrobenthos in the Tagus estuary and adjacent coastal shelf. Hydrobiologia, 587(1): 241-251.
DOI:10.1007/s10750-007-0686-6 |
Gogina M, Zettler M L. 2010. Diversity and distribution of benthic macrofauna in the Baltic Sea:data inventory and its use for species distribution modelling and prediction. J. Sea Res., 64(3): 313-321.
DOI:10.1016/j.seares.2010.04.005 |
Harriague A C, Bianchi C N, Albertelli G. 2006. Soft-bottom macrobenthic community composition and biomass in a Posidonia oceanica meadow in the Ligurian Sea (NW Mediterranean). Estuar. Coastal Shelf Sci., 70(1-2): 251-258.
DOI:10.1016/j.ecss.2005.10.017 |
Herman P M J, Middelburg J J, van de Koppel J, Heip C H R. 1999. Ecology of estuarine macrobenthos. Adv. Ecol.Res., 29: 195-240.
DOI:10.1016/S0065-2504(08)60194-4 |
Hossain M B, Amin S M N, Asadujjaman M, Rahman S. 2013. Analyses of macrobenthos of Hatiya and Nijhum Dweep Islands at higher taxonomic resolution. J. Fish. Aquat.Sci., 8(4): 526-534.
DOI:10.3923/jfas.2013.526.534 |
Hossain M B, Das N G, Sharmeen R. 2009. Seasonal and spatial distribution of macrozoobenthos of the Meghna River estuarine bed. Int. J. Sustain. Agric. Tech., 5(3): 11-16.
|
Hossain M B. 2009. Polychaete faunal diversity of the Meghna River estuarine bed. Bangladesh J. Prog. Sci. Tech., 7(2): 275-278.
|
Hossain M B. 2011. Macrobenthos Community Structure of a Tropical Estuary. LAP Publishing Company, Germany. 84p.
|
Hutchings P A. 1997. The Terebellidae (Polychaeta) of Northern Australia with a key to all the described species of the region. In: Hanley J R, Caswell G, Megirian D, Larson H K eds. Proceedings of the Sixth International Biological Workshop. The Marine Flora and Fauna of Darwin Harbour, Northern Territory, Australia. Museums and Art Galleries of the Northern Territory and the Australian Marine Sciences Association, Darwin. p.133-161.
|
Islam M S, Sikde M N A, Al-Imran M, Hossain M B, Mallick D, Morshed M M. 2013. Intertidal macrobenthic fauna of the Karnafuli estuary:relations with environmental variables. World Appl. Sci. J., 21(9): 1.
|
Jones C G, Lawton J H, Shachak M. 1994. Organisms as ecosystem engineers. Oikos, 69(3): 373-386.
DOI:10.2307/3545850 |
Khan A N, Kamal D, Mahmud M M, Rahman M A, Hossain M A. 2007. Diversity, distribution and abundance of benthos in Mouri River, Khulna, Bangladesh. Int. J. Sustain. Crop Prod., 2(5): 19-23.
|
Khan A, Manokaran S, Lyla S. 2017. Changes in macrobenthic community structure from estuary to continental slope in the south-east coast of India. J. Mar. Biol. Assoc. UK, 97(1): 161-180.
DOI:10.1017/S0025315416000229 |
Kumar P S, Khan A B. 2013. The distribution and diversity of benthic macroinvertebrate fauna in Pondicherry mangroves, India. Aquat. Biosyst., 9: 15.
DOI:10.1186/2046-9063-9-15 |
Mandal S, Harkantra S N. 2013. Changes in the soft-bottom macrobenthic diversity and community structure from the ports of Mumbai, India. Environ. Monit. Assess., 185(1): 653-672.
DOI:10.1007/s10661-012-2582-4 |
McLusky D S, Elliot D. 2006. The Estuarine Ecosystem: Ecology, Threats and Management. 3rd edn. Oxford University Press, Oxford. 214p.
|
Molla M H R, Al-Imran M, Aktaruzzaman M, Mandol S, Sarkar M S I, Islam M S. 2015. Spatio-temporal variations of macrobenthic annelid community of the Karnafuli River Estuary, Chittagong, Bangladesh. Int. J. Mar. Sci., 5(26): 1-10.
DOI:10.5376/ijms.2015.05.0026 |
Muniz P, Pires A M S. 1999. Trophic structure of polychaetes in the São Sebastião Channel (southeastern Brazil). Mar.Biol., 134(3): 517-528.
DOI:10.1007/s002270050567 |
Nandan S B, Azis A P K. 1996. Water quality and benthic faunal diversity of a polluted estuary, southwest coast of India. Indian J. Env. Prot., 16: 12-22.
|
Pearson T H. 1970. The benthic ecology of Loch Linnhe and Loch Eil, a Sea-Loch system on the west coast of Scotland.I. The physical environment and distribution of the macrobenthic fauna. J. Exp. Mar. Biol. Ecol, 5(1): 1-34.
DOI:10.1016/0022-0981(70)90026-2 |
Pramanik M A H. 1988. Methodologies and techniques of studying coastal systems: Case Studies Ⅱ. Space and Remote Sensing Organization (SPARSO). Presented at the National Development and Management. Coastal Area Resource Development and Management Association (CARDMA), Bangladesh. p.122-138.
|
Pravinkumar M, Murugesan P, Prakash K R, Elumalai V, Viswanathan C, Raffi S M. 2013. Benthic biodiversity in the Pichavaram mangroves, Southeast Coast of India. J.Oceanogr. Mar. Sci., 4(1): 1-11.
|
Sarker J M, Patwary S A M, Uddin A M M B, Hasan M M, Tanmay M H, Kanungo I, Parvej M R. 2016. Macrobenthic community structure-an approach to assess coastal water pollution in Bangladesh. Fish. Aquac. J., 7: 157.
DOI:10.4172/2150-3508.1000157 |
Sharif A S M, Islam S, Islam M. 2017. Occurrence and distribution of macrobenthos in relation to physicochemical parameters in the lower Meghna River estuary, Bangladesh. Int. J. Mar. Sci., 7(12): 102-113.
DOI:10.5376/ijms.2017.07.0012 |
Shou L, Huang Y J, Zeng J N, Gao A G, Liao Y B, Chen Q Z. 2009. Seasonal changes of macrobenthos distribution and diversity in Zhoushan sea area. Aquat. Ecosyst. Health Manage., 12(1): 110-115.
DOI:10.1080/14634980802697902 |
Vasanth Kumar B, Roopa S V, Gangadhar B K. 2013. Distribution and abundance of macrobenthos in mangroves ecosystem of Kali Estuary, Karwar, Karnataka. Int. J. Life Sci., 1(4): 313-316.
|
Xu Y, Li X Z, Wang H F, Zhang B L. 2016. Seasonal and spatial variations of macrobenthic community structure and diversity in the South Yellow Sea. Aquat. Ecosyst.Health Manage., 19(1): 92-100.
DOI:10.1080/14634988.2016.1139429 |
Ysebaert T, Meire P, Maes D, Buijs J. 1993. The benthic macrofauna along the estuarine gradient of the Schelde estuary. Netherl. J. Aquat. Ecol., 27(2-4): 327-341.
DOI:10.1007/BF02334796 |