Institute of Oceanology, Chinese Academy of Sciences
Article Information
- HE Jingjing, LIN Xiaopei
- Co-variation of the surface wind speed and the sea surface temperature over mesoscale eddies in the Gulf Stream region: momentum vertical mixing aspect
- Journal of Oceanology and Limnology, 37(4): 1154-1164
- http://dx.doi.org/10.1007/s00343-019-8094-0
Article History
- Received Apr. 13, 2018
- accepted in principle Jul. 10, 2018
- accepted for publication Oct. 10, 2018
Air-sea interaction is of great interest to oceanographers and atmospheric scientists. In the past few decades, some studies have investigated the negative correlation between sea surface temperature (SST) and surface wind speed on the basin scale (Fig. 1a), indicating the atmospheric forcing of the underlying ocean (Okumura et al., 2001; Alexander et al., 2002; Xie, 2004). Recently, with high-resolution satellite observations and modeling simulations becoming available, the positive correlation between SST and surface wind speed in meso to small scales has been highlighted (Fig. 1b), which is indicative of an oceanic forcing to the overlying atmosphere (Chelton et al., 2004; Xie, 2004; Small et al., 2008; Chelton and Xie, 2010).

|
| Fig.1 Maps of the linear correlation coefficients between SST and surface wind speed (SWS) based on unfiltered data (a) and spatial high-pass filtered data (b) The black points show the correlation coefficients with statistical significance above the 95% confidence level, the contours are the multi-year mean SST, with intervals of 2℃ and thick contours at 10℃, 15℃, 20℃, and 25℃. |
As the strongest western boundary current in the ocean, the Gulf Stream transports large amounts of warm water from the tropical ocean to higher latitudes near continental coasts, providing intense air-sea exchanges. Many previous studies have investigated the effects of the Gulf Stream on the overlying atmosphere. The small-scale SST anomalies can affect the surface wind speed (Xie, 2004; Park et al., 2006; O'Neill et al., 2010), surface wind stress (Bryan et al., 2010), surface wind direction (O'Neill et al., 2010), surface wind divergence and curl fields (Chelton et al., 2004; Minobe et al., 2010). In addition, the influences of Gulf Stream fronts can extend from the boundary layer to the free troposphere, with deep convection, local precipitation, and frequent high clouds anchored over the bands of warm water (Minobe et al., 2008, 2010; Liu et al., 2014).
Until now, two hypotheses have been put forward to explain the relationship between SST changes and surface winds at the meso to small scales: vertical mixing mechanism (Wallace et al., 1989) and sea level pressure (SLP) adjustment (Lindzen and Nigam, 1987). The relative contributions in changing the surface wind field are still under debate. Some studies have found that the modification of the surface winds over the Gulf Stream is due to the SLP adjustment (Minobe et al., 2008, 2010; Liu et al., 2014); while others have argued that this response is attributed to the momentum vertical mixing mechanism (Sweet et al., 1981; Park et al., 2006). Small et al. (2003) have suggested that these two mechanisms can produce positive SST-surface wind anomalies correlations when considering the prevailing wind thermal advection.
The regions of strong western boundary current are characterized by the high mesoscale eddy activities (Chelton et al., 2011), and the oceanic eddy related air-sea interaction have been investigated in recent years. Kouketsu et al. (2011) pointed out the winter SST variations in the western boundary current region can force the overlying atmosphere just as they do in the tropics. The SST positive anomalies induced by more warm eddies are primarily responsible for the turbulent heat flux (Sugimoto and Hanawa, 2011) and westerly winds (Sugimoto et al., 2017) in the Kuroshio-Oyashio confluence region. In addition, the warm (cold) eddies accelerate (decelerate) winds in the near-surface atmosphere via vertical mixing effect in the Kuroshio Extension region (Ma et al., 2015, 2016). However, the understanding of the co-variation of surface wind speed and SST variations associated with the mesoscale eddies in the Gulf Stream region is inadequate. Besides, which mechanism is dominant in explaining the positive SST-surface wind speed perturbation correlation is not clear.
In this study, we will only focus on the response of surface wind speed to the SST changes induced by oceanic mesoscale eddies over the Gulf Stream frontal region, without discussing the influence of SST on surface heat flux, using high-resolution satellite measurements and atmospheric reanalysis data. Furthermore, we will quantify the effect of eddyinduced SST perturbation on the surface wind speed and MABL height. The dominant mechanism is then identified by inspecting the patterns of surface wind divergence.
2 DATA AND METHOD 2.1 DataBoth high-resolution satellite measurements and atmospheric reanalysis data are used to investigate local air-sea interaction in the Gulf Stream frontal region. The SST and surface wind speed are obtained from the Advanced Microwave Scanning Radiometer for Earth Observing System (AMSR-E; http://www.remss.com/). The AMSR-E data are available from June 2002 to September 2011 on a 0.25°×0.25° grid. The surface wind vectors at 0.25° horizontal resolution are obtained from the Cross Calibrated Multi-Platform (CCMP) V2.0 dataset (http://www.remss.com/), which provides consistent, gap-free long-term timeseries of the surface wind vector analysis field from July 1987 to May 2016. The oceanic surface currents on a 0.25°×0.25° grid are estimated from satellite altimetry data, which combine observations from the Ocean Topography Experiment (TOPEX)/Poseidon, ERS-1/2, Jason-1, and Envisat satellites (http://marine.copernicus.eu/services-portfolio/access-to-products/). The mesoscale eddies are from the fourth version of global mesoscale eddy atlas (http://wombat.coas.oregonstate.edu/eddies/). The atmospheric reanalysis parameters, including the air temperature, MABL height, and SST, are available from ERA-Interim on a 0.25°×0.25° gridwhich is produced by the European Centre for Medium-Range Weather Forecasts (ECMWF; http://apps.ecmwf.int/) (Dee et al., 2011). The SST from ERA-Interim is only used to match with the analysis of MABL height.
All data used here are monthly averages, which is long enough to filter out the synoptic perturbations in the atmospheric variables. The study period of this work is from June 2002 to September 2011, limited by the AMSR-E data available to us.
2.2 Method 2.2.1 Spatial high-pass filterBecause the ocean has a much smaller deformation radius inherently than the atmospheric counterpart, the signals at oceanic meso to small scales are usually obscured by large-scale patterns (Chelton et al., 2004; Chelton and Xie, 2010). The high-pass spatial filtering, hence, is indispensable to extract the smallscale structures in the oceanic and atmospheric variables over frontal regions. Following previous studies (Ma et al., 2015; Chen et al., 2017), the surface wind speed and SST are spatially high-pass filtered in two dimensions to remove the signal with wavelength scales being larger than 7.5° in the zonal direction and 5.5° in the meridional direction. This filter window is roughly selected by the wavelength of the oceanic eddy, which is smaller than 850 km. In addition, to roughly reduce the effect of background fronts, the climatological frontal signals are also removed from the SST field after the spatial high-pass filtering process. This could not obviously influence the characteristics of coupling.
Figure 1 shows the distribution of the linear correlation coefficient between the surface wind speed and SST based on unfiltered and filtered AMSR-E satellite observations over the Gulf Stream region. As shown in Fig. 1a, the significant SSTsurface wind speed correlations are predominantly negative on the basin scale. In contrast, after conducting spatial high-pass filtering, the strong positive SST-surface wind speed correlations are found mostly in the north of 35°N (Fig. 1b). As this suggests that, the persistent small-scale features of primary interest here are obscured by the large-scale signals, with the filter effective at removing the largescale variability, high-pass spatial filtering is adopted for every grid to examine the effects of SST changes on the surface wind speed over the mesoscale eddies in the Gulf Stream region for each month. All perturbation or anomaly fields hereafter represent the data underwent spatial high-pass filtering.
2.2.2 Composite for the oceanic mesoscale eddiesThe variables of the surface wind speed perturbation, MABL height perturbation, and SST perturbation are collocated with the composite area of a 4°×4° box centered on each oceanic eddy center. The composite analyses over warm and cold eddies are calculated separately and only for all strong oceanic eddies defined as eddies with amplitudes larger than 8 cm. As a result, over 10 200 strong warm eddies and 10 400 strong cold eddies in the Gulf Stream region (72°–22°W, 33°–47°N) from 2002 to 2011 are used for the composite analysis. In addition, to quantify the response of the surface wind speed to SST perturbations induced by warm and cold eddies, linear fits are made to the SST-surface wind speed perturbations and SST-MABL height perturbations for both types of oceanic mesoscale eddies with the F-test is used to assess the significance of the linear fits.
3 RESULT AND DISCUSSIONThe air-sea interactions are usually influenced by the oceanic and atmospheric background variations, including the ocean current, SST, SST gradient, wind speed and direction, and MABL. The characteristics of positive SST-surface wind speed correlations will be investigated in the following sections.
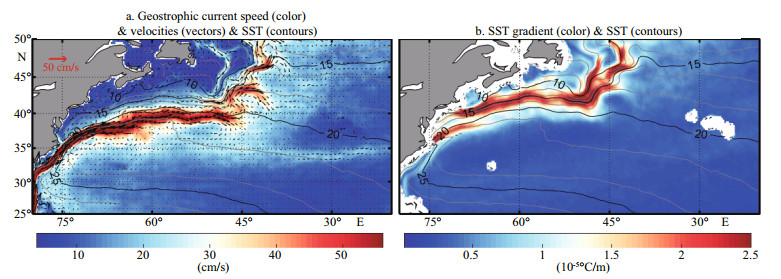
3.1 Surface oceanic conditionsFigure 2a shows the multi-year mean surface current velocity and SST in the Gulf Stream region. The surface currents are fast and narrow, with the maximum speed above 2 m/s, transporting warm subtropical water to high latitudes, and leaving a warm tongue in the SST field. Along the north wall of the Gulf Stream, there is a significant band of strong SST gradients, as shown in Fig. 2b. A sharp SST front forms between the warm Gulf Stream and the cold shelf water. The mean SST increases for over 2℃ in a distance of 100 km. Combined with the spatial distribution of positive correlations of SST-surface wind speed perturbations (Fig. 1b), the consistency between the positive correlation and strong currents or SST gradients suggests that the strong air-sea interaction over the frontal region is anchored by the strong oceanic current and SST gradient. These frontal effects associated with the Gulf Stream and SST gradients have been investigated in many previous studies (Minobe et al., 2008, 2010; Liu et al., 2014).
|
| Fig.2 The map of the multi-year mean surface geostrophic current speed (color), velocities (vectors) and SST (contours) (a); the map of the multi-year mean SST gradient (color) and SST (contours) (b) In each panel, the contour interval of SST is 2℃, with thick contours at 10℃, 15℃, 20℃, and 25℃. |
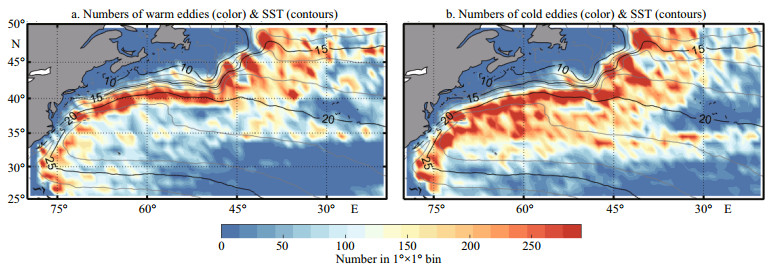
Defining the total number of oceanic eddies detected in a 1°×1° bin as the eddy density, Fig. 3a and 3b show the spatial patterns of densities of strong warm and cold eddies with amplitudes larger than 8cm during the period of 2002–2011, respectively, with most of the strong warm and cold eddies found near the intense Gulf Stream current path and a predominance of strong warm (cold) eddies on the poleward (equatorward) of the Gulf Stream. By comparison, the region of preference for strong warm eddies (Fig. 3a) is narrower than its counterpart region of preference for strong cold eddies (Fig. 3b). The impact of transient oceanic eddies on the atmosphere is very important in the frontal zone. Notice that the density patterns of strong warm and cold eddies are roughly consistent with the distribution of positive correlations of SST-surface wind speed perturbation (Fig. 1b). As the oceanic eddies affect the near-surface wind speed, the detailed response of the surface wind speed to SST changes induced by warm and cold eddies will be quantified in Section 3.3.
|
| Fig.3 The density of strong warm (a) and cold (b) eddies in the Gulf Stream region during the period of 2002–2011 The density is defined as the total number of the eddies detected in a 1°×1° bin and a strong eddy is defined as an eddy with amplitude larger than 8 cm. The contour interval of SST is 2℃, with thick contours at 10℃, 15℃, 20℃, and 25℃. |
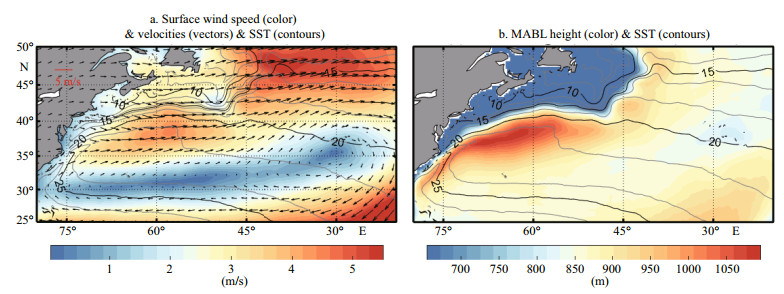
Figure 4a gives the mean surface wind over the Gulf Stream region, illustrating a strong westerly component. In the north of 35°N, the surface winds are northwesterly to westerly, originating from the cold, dry North American continent, and causing a strong turbulent heat flux release in the Gulf Stream frontal region. The mean surface wind speed shows a clear association with the SST, with a high surface wind speed over the warm flank of the strong SST front.
|
| Fig.4 The map of the multi-year mean surface wind speed (color) and surface wind velocity (vectors) from CCMP, and SST from AMSR-E (contours) (a); the map of the multi-year mean MABL height from ERA-Interim (color), and SST (contours) (b) The contour interval of SST is 2℃, with thick contours at 10℃, 15℃, 20℃, and 25℃. |
Because the direct influence of the SST changes on the surface wind is confined mainly to the MABL (Norris, 1998), being tightly associated with the entrainment and heat fluxes (Suarez et al., 1983), the MABL structure plays an important role in the air-sea interaction. The mean MABL height, as shown in Fig. 4b, exhibits an obvious front along the strong SST front, with higher values over warm water, which is roughly consistent with the surface wind speed in the north of 35°N (Fig. 4a). The height increases from the cold side with a typical value smaller than 700 m toward the warm side of the SST front up to approximately 1 100 m, which locates between the latitudes of 35°N and 40°N, where there is the strong westerly wind (Fig. 4a).
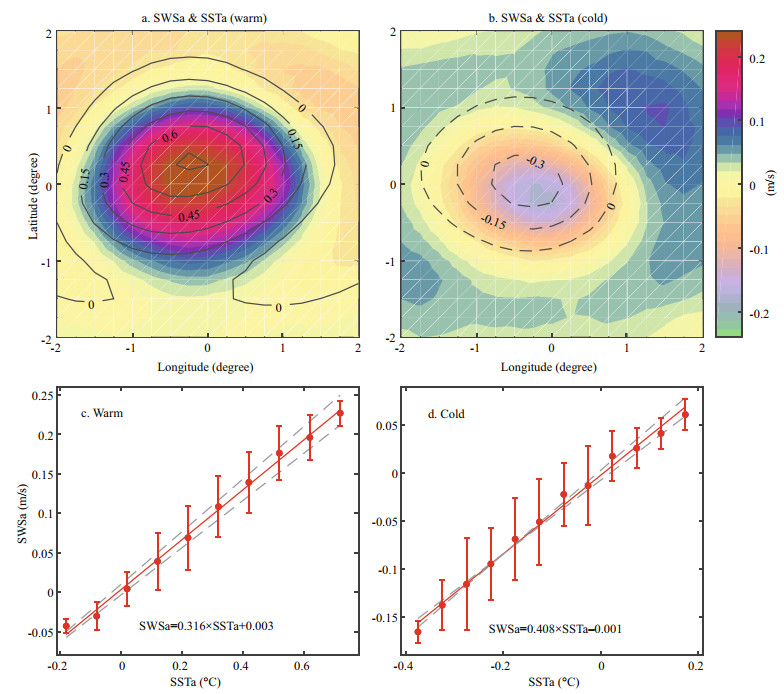
3.3 Composites for warm and cold eddiesThe positive SST-surface wind speed correlation reveals the co-variation of high (low) surface wind speed perturbations over warm (cool) SST perturbations (Fig. 1b). To quantify the linear relationship between surface wind speed perturbation and SST anomaly induced by the oceanic eddies, the composites of SST and surface wind speed for warm and cold eddies are shown in Fig. 5a and 5b, respectively. The composites show that positive (negative) SST perturbations accelerate (decelerate) surface wind, with some phase differences between SST and surface wind speed perturbations. For the warm eddies, the maximum SST perturbations and surface wind speed perturbations are about 0.77℃ and 0.25 m/s, respectively. For the cold eddies, the maximum SST perturbations and surface wind speed perturbations are approximate 0.38℃ and 0.18 m/s, respectively. In addition, the binned scatterplots of surface wind speed perturbation as a function of SST perturbation over the composite warm and cold eddies are shown in Fig. 5c and 5d, respectively, with each point representing the bin-averaged values. The coupling coefficient between surface wind speed perturbation and SST perturbations is implied by the slope of the linear fit by least squares to the binned averages, with all linear fits exhibited in Fig. 5 significant at the 95% confidence level.
|
| Fig.5 Composites of SST perturbations (SSTa, contours in a and b; ℃) and surface wind speed perturbations (SWSa, colors in a and b; m/s) for the warm (a) and cold (b) eddies; the binned scatterplots of SWSa as a function of SSTa over warm (c) and cold (d) eddies in the Gulf Stream frontal region In each bin of the bottom panels, the points represent the means of the wind speed, and the error bars represent the ±1 standard deviation of all the samples of the wind speed anomalies falling into this bin. The coupling between SWSa and the SSTa is implied by the slope of the linear fit by least squares to the binned averages in each panel. The linear fitting function is indicated in the lower-right corner. |
This result clearly shows that the surface-windspeed perturbations are related linearly to the SST perturbations over both warm and cold eddies in the Gulf Stream frontal region. The surface wind speed accelerates (decelerates) approximate 0.32 (0.41) m/s per 1℃ SST perturbation induced by the warm (cold) eddy.
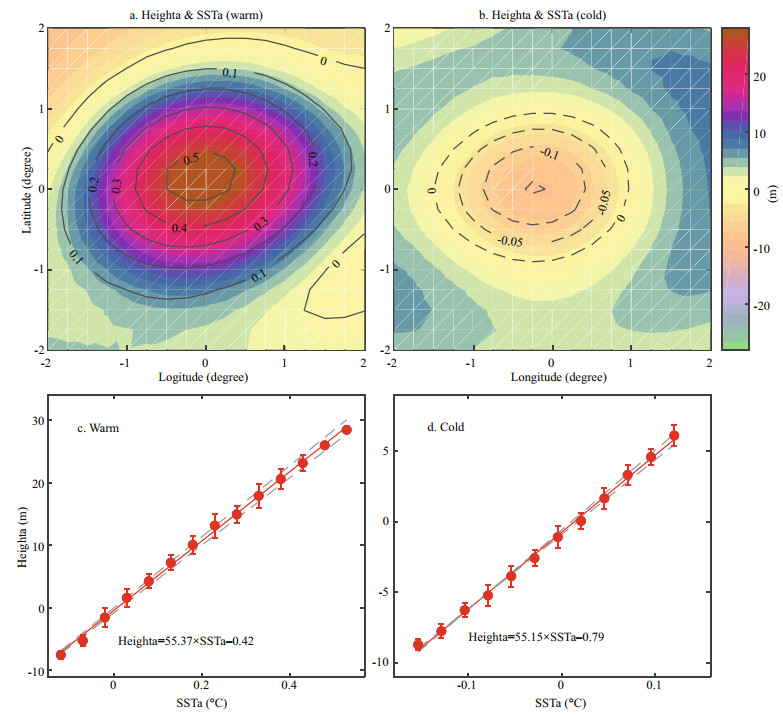
Similarly, the strong warm (cold) eddy usually leads to the unstable (stable) MABL. As shown in Fig. 6, there exist significant positive correlations between SST perturbations and height perturbations over the eddies. Almost all of the maximum perturbations in height and SST are located at the eddy centers (Fig. 6a, b). To quantify the height change with SST perturbation, the binned scatterplots of SST perturbation and MABL height perturbation over the composite warm and cold eddies are shown in Fig. 6c and 6d, respectively. It reveals that the MABL height perturbation is significantly correlated with SST perturbation, with an elevation of 55 m per 1℃ of SST perturbation induced by the strong warm eddy and a drop of 54 m per 1℃ of SST perturbation induced by the strong cold eddy.
|
| Fig.6 Composites of SSTa (contours in a and b; ℃) and MABL height perturbations (heighta, colors in a and b; m) for the warm (a) and cold (b) eddies; the binned scatter plots of heighta as a function of SSTa over warm (c) and cold (d) eddies in the Gulf Stream frontal region In each bin of the panels, the points represent the means of the MABL heighta, and the error bars represent the ±1 standard deviation of all the samples of the MABL heighta falling into this bin. The coupling between MABL heighta and the SSTa is implied by the slope of the linear fit by least squares to the binned averages in each panel. The linear fitting functions are indicated in the lower-right corner in these maps. |
The dominant mechanism contributes to the response of the atmosphere to the SST changes can be estimated by the distribution of surface wind divergence (Chen et al., 2017) and the SST spatial pattern (Lambaerts et al., 2013). As the surface wind divergence is related closely to the vertical motion in the MABL, it is useful to examine the surface wind speed response to oceanic eddy in terms of surface wind divergence. Under the background westerly wind, there are about 80% of oceanic eddies over the Gulf Stream region generate the momentum vertical mixing type of atmospheric response stated in the study of Chen et al. (2017).
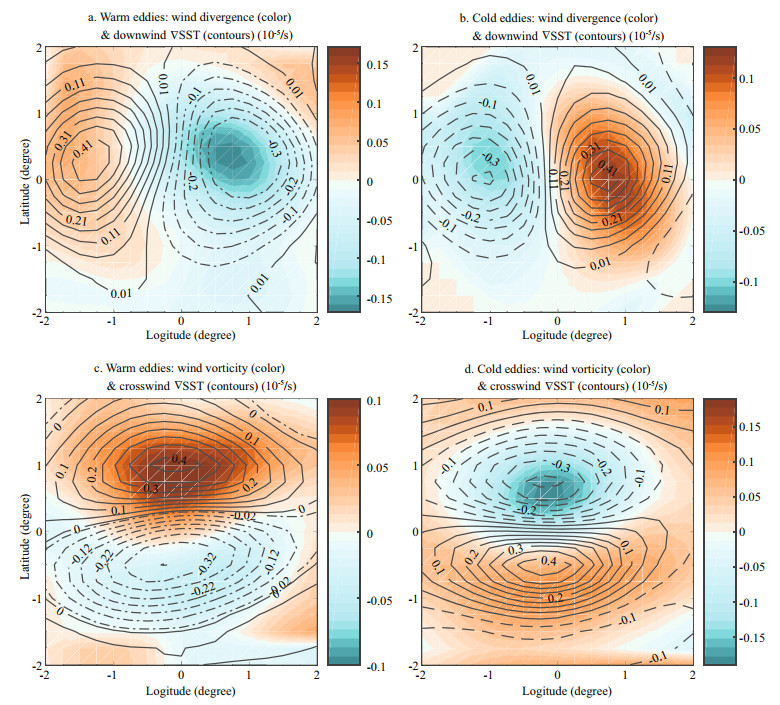
Figure 7a and 7b shows the composite surface wind divergence perturbation and downwind SST gradient perturbation over the warm eddies and cold eddies, respectively. In the zonal direction, there are significant dipolar patterns. As shown in the binned scatterplots over composite warm and cold eddies (Fig. 8a, b), the linear relationship between the downwind SST gradient perturbation and the surface wind divergence perturbation suggests that the momentum vertical mixing mechanism acts as a leading mechanism in the co-variation of surface wind speed perturbations and SST perturbations induced by strong oceanic eddies.
|
| Fig.7 The composite of downwind SST gradient and surface wind divergence perturbations over the strong warm (a) and cold eddies (b); the composite of crosswind SST gradient and surface wind vorticity perturbations over the warm (c) and cold eddies (d) |

|
| Fig.8 Binned scatterplots of spatial high-pass filtered fields of the wind divergence as a function of the downwind SST gradient (a, b), and the wind vorticity as a function of the crosswind SST gradient for the warm (a, c) and cold (b, d) eddies in the Gulf Stream region The points in each panel are the means within each bin computed from overlapping averages, and the error bars are the ±1 standard deviation of all the samples of anomalies falling into this bin. The coupling between SST and the surface winds is implied by the slope of the linear fit by least squares, whose value is indicated in the lower-right corner of each panel. |
To further test the dominant role of momentum vertical mixing in the covariation of surface wind speed and SST over the oceanic eddies, Fig. 7c and 7d show the relationship between surface wind vorticity and crosswind SST gradient. In the meridional direction, there are significant dipolar patterns for warm and cold eddies, consistent with the patterns revealed in the study of Ma et al. (2015). The linear binned scatterplots over the composites of strong warm and cold eddies, as shown in Fig. 8c and 8d, exhibit that the surface wind vorticity perturbation is linearly related to the crosswind component of the SST gradient perturbation, further lending support to the momentum vertical mixing mechanism.
The strong warm eddy causes a large warming at the lower level, reducing the static stability of the MABL, which intensifies the momentum vertical mixing to accelerate the surface wind and results in the positive correlation between surface wind speed and SST perturbations. By contrast, the SST perturbation induced by cold eddies causes large cooling at the lower level, which can stabilize the near-surface atmosphere and suppress momentum vertical mixing. Hence, the positive SST-surface wind speed correlations anchored over frontal regions with energetic oceanic eddies are mainly controlled by strong mesoscale eddies and MABL height fronts.
4 CONCLUSIONThe present study has investigated the covariation of surface wind speed perturbation and SST perturbations over oceanic eddies in the Gulf Stream frontal region by using high-resolution satellite observations and atmospheric reanalysis data from 2002 to 2011. Our results show that the pattern of positive SST-surface wind-speed perturbation correlations is mainly anchored by strong SST gradients and the MABL height front, with active warm and cold eddies around. The positive SSTsurface wind speed perturbation correlations are mostly found in the north of 35°N, where strong SST fronts and oceanic eddies are generated. Across the Gulf Stream front, the MABL has a significant transitional structure, with high over the warm side and low over the cold side.
The SST perturbation induced by warm eddies increases surface wind speed and deepens the MABL, while the surface wind speed decreases and MABL height drops over the strong cold eddy. For the warm eddy, the surface wind speed increases about 0.32 m/s and the MABL height increases approximate 55 m per 1℃ of SST perturbation. For the cold eddy, the surface wind speed decreases about 0.41 m/s and the MABL drops approximate 54 m per 1℃ of SST perturbation.
Our study supports the momentum vertical mixing mechanism proposed by Wallace et al. (1989) as the primary mechanism explaining the covariation of surface wind speed and SST perturbations over oceanic eddies in the Gulf Stream region. Heating over warm eddy deepens and destabilizes the MABL, resulting in decreased vertical wind shear and enhanced momentum vertical mixing, bringing fastmoving air from aloft to accelerate the surface wind, and producing the positive SST-surface wind speed correlations. On the contrary, the SST perturbation induced by strong cold eddies stabilizes the MABL and reduces the MABL height, which decouples the surface winds from winds aloft, with the net effect of decreasing the surface wind speed over negative SST perturbations.
5 DATA AVAILABILITY STATEMENTThe high-resolution satellite observations, which include the SST and surface wind speed from AMSR-E, and surface wind vectors from CCMP, are available from the Remote Sensing Systems website http://www.remss.com/support/data-shortcut/ after registration.
The oceanic surface geostrophic currents are downloaded from the website of the Copernicus Marine Environment Monitoring Service http://marine.copernicus.eu/services-portfolio/access-toproducts/ after registration.
The mesoscale eddies are from the 4th version of the global mesoscale eddy atlas available at http://wombat.coas.oregonstate.edu/eddies/.
The ERA-Interim atmospheric reanalysis data, including the MABL height, SST, air temperature, are downloaded from the website of the ECMWF http://apps.ecmwf.int/ after registration.
6 ACKNOWLEDGEMENTWe thank Richard Foreman, Ph.D., from Liwen Bianji, Edanz Editing China (www.liwenbianji.cn/ac), for editing the English text of the draft of this manuscript.
Alexander M A, Bladé I, Newman M, Lanzante J R, Lau N, Scott J D. 2002. The atmospheric bridge:the influence of ENSO teleconnections on air-sea interaction over the global oceans. Journal of Climate, 15(16): 2205-2231.
DOI:10.1175/1520-0442(2002)015<2205:TABTIO>2.0.CO;2 |
Bryan F O, Tomas R, Dennis J M, Chelton D B, Loeb N G, McClean J L. 2010. Frontal scale air-sea interaction in high-resolution coupled climate models. Journal of Climate, 23(23): 6277-6291.
DOI:10.1175/2010JCLI3665.1 |
Chelton D B, Schlax M G, Freilich M H, Milliff R F. 2004. Satellite measurements reveal persistent small-scale features in ocean winds. Science, 303(5660): 978-983.
DOI:10.1126/science.1091901 |
Chelton D B, Schlax M G, Samelson R M. 2011. Global observations of nonlinear mesoscale eddies. Progress in Oceanography, 91(2): 167-216.
DOI:10.1016/j.pocean.2011.01.002 |
Chelton D B, Xie S P. 2010. Coupled ocean-atmosphere interaction at oceanic mesoscales. Oceanography, 23(4): 52-69.
DOI:10.5670/oceanog |
Chen L J, Jia Y L, Liu Q Y. 2017. Oceanic eddy-driven atmospheric secondary circulation in the winter Kuroshio Extension region. Journal of Oceanography, 73(3): 295-307.
DOI:10.1007/s10872-016-0403-z |
Dee D P, Uppala S M, Simmons A J, Berrisford P, Poli P, Kobayashi S, Andrae U, Balmaseda M A, Balsamo G, Bauer P, Bechtold P, Beljaars A C M, Van De Berg L, Bidlot J, Bormann N, Delsol C, Dragani R, Fuentes M, Geer A J, Haimberger L, Healy S B, Hersbach H, Hólm E V, Isaksen L, Kållberg P, Köhler M, Matricardi M, McNally A P, Monge-Sanz B M, Morcrette J J, Park B K, Peubey C, De Rosnay P, Tavolato C, Thépaut J-N, Vitart F. 2011. The ERA-Interim reanalysis:configuration and performance of the data assimilation system. Quarterly Journal of the Royal Meteorological Society, 137(656): 553-597.
DOI:10.1002/qj.828 |
Kouketsu S, Tomita H, Oka E, Hosoda S, Kobayashi T, Sato K. 2011. The role of meso-scale eddies in mixed layer deepening and mode water formation in the western North Pacific. Journal of Oceanography, 68(1): 63-77.
DOI:10.1007/s10872-011-0049-9 |
Lambaerts J, Lapeyre G, Plougonven R, Klein P. 2013. Atmospheric response to sea surface temperature mesoscale structures. Journal of Geophysical Research:Atmospheres, 118(17): 9611-9621.
DOI:10.1002/jgrd.50769 |
Lindzen R S, Nigam S. 1987. On the role of sea surface temperature gradients in forcing low-level winds and convergence in the tropics. Journal of the Atmospheric Sciences, 45(17): 2418-2436.
DOI:10.1175/1520-0469(1987)044<2418:OTROSS>2.0.CO;2 |
Liu J W, Xie S P, Norris J R, Zhang S P. 2014. Low-level cloud response to the gulf stream front in winter using CALIPSO. Journal of Climate, 27(12): 4421-4432.
DOI:10.1175/JCLI-D-13-00469.1 |
Ma J, Xu H M, Dong C M, Lin P F, Liu Y. 2015. Atmospheric responses to oceanic eddies in the Kuroshio Extension region. Journal of Geophysical Research:Atmospheres, 120(13): 6313-6330.
DOI:10.1002/2014JD022930 |
Ma J, Xu H M, Dong C M. 2016. Seasonal variations in atmospheric responses to oceanic eddies in the Kuroshio extension. Tellus A:Dynamic Meteorology and Oceanography, 68(1): 31563.
DOI:10.3402/tellusa.v68.31563 |
Minobe S, Kuwano-Yoshida A, Komori N, Xie S P, Small R J. 2008. Influence of the Gulf Stream on the troposphere. Nature, 452(7184): 206-209.
DOI:10.1038/nature06690 |
Minobe S, Miyashita M, Kuwano-Yoshida A, Tokinaga H, Xie S P. 2010. Atmospheric response to the gulf stream:seasonal variations. Journal of Climate, 23(13): 3699-3719.
DOI:10.1175/2010JCLI3359.1 |
Norris J R. 1998. Low cloud type over the ocean from surface observations. Part Ⅰ:Relationship to surface meteorology and the vertical distribution of temperature and moisture.Journal of Climate, 11(3): 369-382.
DOI:10.1175/1520-0442(1998)011<0369:LCTOTO>2.0.CO;2 |
Okumura Y, Xie S P, Numaguti A, Tanimoto Y. 2001. Tropical Atlantic air-sea interaction and its influence on the NAO. Geophysical Research Letters, 28(8): 1507-1510.
DOI:10.1029/2000GL012565 |
O'Neill L W, Esbensen S K, Thum N, Samelson R M. 2010. Dynamical analysis of the boundary layer and surface wind responses to mesoscale SST perturbations. Journal of Climate, 23(3): 559-581.
DOI:10.1175/2009JCLI2662.1 |
Park K A, Cornillon P C, Codiga D L. 2006. Modification of surface winds near ocean fronts:Effects of Gulf Stream rings on scatterometer (QuikSCAT, NSCAT) wind observations. Journal of Geophysical Research:Oceans, 111(C3): C03021.
DOI:10.1029/2005JC003016 |
Small R J, deSzoeke S P, Xie S P, O'Neill L, Seo H, Song Q, Cornillon P, Spall M, Minobe S. 2008. Air-sea interaction over ocean fronts and eddies. Dynamics of Atmospheres and Oceans, 45(3): 274-319.
DOI:10.1016/j.dynatmoce.2008.01.001 |
Small R J, Xie S P, Wang Y Q. 2003. Numerical simulation of atmospheric response to pacific tropical instability waves. Journal of Climate, 16(22): 3723-3741.
DOI:10.1175/1520-0442(2003)016<3723:NSOART>2.0.CO;2 |
Suarez M J, Arakawa A, Randall D A. 1983. The parameterization of the planetary boundary layer in the UCLA general circulation model:formulation and results. Monthly Weather Review, 111(11): 2224-2243.
DOI:10.1175/1520-0493(1983)111<2224:TPOTPB>2.0.CO;2 |
Sugimoto S, Aono K, Fukui S. 2017. Local atmospheric response to warm mesoscale ocean eddies in the KuroshioOyashio confluence region. Science Reports, 7(1): 11871.
DOI:10.1038/s41598-017-12206-9 |
Sugimoto S, Hanawa K. 2011. Roles of SST anomalies on the wintertime turbulent heat fluxes in the kuroshio-oyashio confluence region:influences of warm eddies detached from the kuroshio extension. Journal of Climate, 24(24): 6551-6561.
DOI:10.1175/2011JCLI4023.1 |
Sweet W R, Fett R, Kerling J, La Violette P. 1981. Air-sea interaction effects in the lower troposphere across the north wall of the Gulf Stream. Monthly Weather Review, 109(5): 1042-1052.
DOI:10.1175/1520-0493(1981)109<1042:ASIEIT>2.0.CO;2 |
Wallace J M, Mitchell T P, Deser C. 1989. The influence of sea-surface temperature on surface wind in the eastern equatorial pacific:seasonal and interannual variability. Journal of Climate, 2(12): 1492-1499.
DOI:10.1175/1520-0442(1989)002<1492:TIOSST>2.0.CO;2 |
Xie S P. 2004. Satellite observations of cool ocean-atmosphere interaction. Bulletin of the American Meteorological Society, 85(2): 195-208.
DOI:10.1175/BAMS-85-2-195 |
 2019, Vol. 37


