 2019, Vol. 37
Institute of Oceanology, Chinese Academy of Sciences
Article Information
- KIM Hansoo, KANG Donhyug, JUNG Seung Won, KIM Mira
- High-frequency acoustic backscattering characteristics for acoustic detection of the red tide species Akashiwo sanguinea and Alexandrium affine
- Journal of Oceanology and Limnology, 37(4): 1268-1276
- http://dx.doi.org/10.1007/s00343-019-8113-1
Article History
- Received Apr. 30, 2018
- accepted in principle Jul. 19, 2018
- accepted for publication Sep. 21, 2018


2 Department of Ocean System Engineering, Jeju National University, Jeju 63243, Korea;
3 Library of Marine Samples, Korea Institute of Ocean Science & Technology (KIOST), Geoje 53201, Korea
Harmful algal blooms (HABs, also called red tides) result from the rapid and excessive growth of phytoplankton (Rhodes et al., 2001; Jeong and An, 2011; Kudela and Gobler, 2012). These events have major impacts on coastal marine ecology, fisheries, and living marine resources (Lee and Lee, 2006; Rabalais et al., 2009; Kim, 2010). The dinoflagellates Akashiwo sanguinea and Alexandrium affine are the most common HAB species worldwide (Steidinger and Tangen, 1997; Wagey et al., 2001; Lee et al., 2005), and can be found in the South Sea off the coast of Korea and in the Ariake Sea off the coast of Japan (Lee et al., 2005; Lim et al., 2008; Katano et al., 2011). Akashiwo sanguinea is a cosmopolitan HAB species that is found frequently in oceans from temperate to tropical waters and can pose a severe threat to fish, shellfish, and sea birds (Steidinger and Tangen, 1997; Tang and Gobler, 2015). Alexandrium affine is a potentially toxic phytoplankton that can cause poisoning (Anderson, 1998; Nguyen-Ngoc, 2004; Kim et al., 2016). Damage and illness caused by A. sanguinea and A. affine have occurred every year in Korea, Northeast Asia, as well as other locations worldwide (Jessup et al., 2009; Lee et al., 2016). To prevent ecosystem damage caused by HABs, forecasting and detecting the occurrence of HABs as early as possible are necessary.
Previous studies of HABs have used various techniques, including visual observation, seawater sampling to count organisms, and satellite observation (Ahn et al., 2005). However, these methods are laborious and not applied in real-time. Moreover, satellite-based remote sensing to monitor HABs cannot detect the low abundance of species or the influence of weather conditions (Anglès et al., 2008). A hydroacoustic technique has been investigated and used to estimate marine biomass in situ (Medwin and Clay, 1998; Simmonds and MacLennan, 2005). In our previous studies, we proposed HAB measurement methods using high-frequency ultrasound in real-time (Bok et al., 2010; Kim et al., 2010, 2018). Bok et al. (2010) explored the possibility of detecting HAB species by measuring backscattering signals from Cochlodinium polykrikoides. Kim et al. (2010) detected C. polykrikoides in the South Sea off the coast of Korea by comparing measured volume backscattering strength (Sv) with that in a theoretical fluid sphere scattering model. These studies showed that acoustic signals could be used to detect HAB cell abundance. Recently, Kim et al. (2018) developed an acoustic sensing system for HABs using a 3.5-MHz ultrasound, which they tested in laboratory and field conditions. However, they mainly focused on developing the sensing system, and only considered C. polykrikoides species. In Korea, the damage caused by HABs is defined by cell abundance (Kim et al., 2016; NIFS (National Institute of Fisheries Science, Korea), 2018). However, the acoustic properties of A. sanguinea and A. affine have remained unexplored in this context. To develop an early detection system for other HAB species, it is necessary to understand the relationship between their acoustic backscattering signals and cell abundance.
In this study, we explored the high-frequency acoustic backscattering characteristics of two HAB species, A. sanguinea and A. affine. We measured acoustic signals using the developed acoustic sensing system under laboratory conditions. In addition, we compared the measuring acoustic signals in the laboratory from the A. sanguinea and A. affine with different cell populations, to those predicted by a fluid sphere scattering model. We also operated the sensing system in the field over a period of one month, when red tides occurred, to measure and verify acoustic signals from A. sanguinea.
2 MATERIAL AND METHOD 2.1 Sampling and cultivation of red tide speciesAkashiwo sanguinea is a representative HAB species found in the South Sea off the coast of Korea during autumn. This species exists as single cells that do not form chains. Samples were collected to obtain resting cysts. Figure 1 shows a photograph of several cells taken using a camera connected to a microscope (BX50; Olympus, Waltham, MA, USA). The size of each cell was calculated and averaged using these images (mean length: 62.3 μm, mean width: 78.5 μm; Fig. 1a). Alexandrium affine is another HAB species found in the same region during summer (mean cell length: 26.7 μm; mean width: 26.2 μm; Fig. 1b).

|
| Fig.1 Micrograph of two harmful algal bloom species a. Akashiwo sanguinea; b. Alexandrium affine. |
Samples were stored and cultivated in f/2 medium (Guillard, 1975) and irradiated at a light intensity of 80 μmol/(m2·s) at 20℃ on a 12 h:12 h light/dark cycle (Bok et al., 2010). Cell counting was performed using a microscope after pipetting samples of the cultured medium onto a counting plate.
2.2 Relative received level (RRL)Figure 2 shows the experimental setup for acoustic measurements and data collection. To measure the acoustic backscattering signal, we used a previously developed ultrasound-based acoustic sensing system for red tides (Kim et al., 2018). The system generates a negative spike excitation signal from a 3.5-MHz ultrasonic transducer (A381S-SU; Olympus) and obtains data in a region of interest of 50–90 mm.

|
| Fig.2 Experimental setup to measure the acoustic signals of harmful algal bloom species (a) and sampling of both species (Akashiwo sanguinea and Alexandrium affine) (b) |
The acquired digital acoustic signals were expressed on a decibel scale. RRL is defined as the ratio between the received and reference levels (Kim et al., 2018). It is calculated as
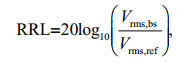 (1)
(1)where Vrms, bs and Vrms, ref are the root-mean-square voltages of signals backscattered by a scatterer (HAB species) and a reference, respectively. To obtain Vrms, ref, in the laboratory, the reference level was measured from filtered seawater. In the field, the reference level was measured from a background seawater sample without HAB.
2.3 Volume backscattering strength (Sv)To compare the measured RRLs and a theoretical volume backscattering strength (Sv), we used a fluid sphere scattering model (Johnson, 1977). In the model, the product of the wave number (k) and the equivalent spherical radius (a) were smaller than 1 (ka < < 1), because the Rayleigh scattering region was satisfied (Medwin and Clay, 1998). The mean values of the spherical radius (a) of the two HAB species, A. sanguinea and A. affine, were 31.1 and 13.1 μm, respectively. The model is
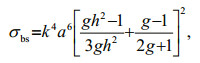 (2)
(2)where σbs is the total backscattering cross-section of the density ratio (g=ρ2/ρ1) and sound speed ratio (h=c2/c1) (Johnson, 1977; Medwin and Clay, 1998). In both ratios, ρ and c are the density and sound speed, respectively, and subscript 1 and 2 refer to seawater and acoustic scatterers, respectively. The scatterers are randomly distributed, and the total Sv of the insonified volume is the sum of the intensities from all individual scatterers. The Sv is expressed in decibels with logarithm notation as follows:
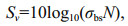 (3)
(3)where N is the cell abundance per unit volume. To calculate Sv, we used values of g and h of 1.05 and 1.05, respectively, for these similar HAB species (Kim et al., 2012).
2.4 Laboratory and field experimentsTo measure acoustic signals in the laboratory, cells were placed in a small flask, with a stirrer to ensure a uniform distribution. The acoustic signals were measured from A. sanguinea populations with cell abundances diluted from the maximum cell abundance of 5 060 cells/mL (310, 620, 1 250, 2 530, and 5 060 cells/mL) for each measurement (Fig. 2a). The signals from A. affine were measured randomly at cell abundances of 690, 1 710, 21 890, 81 200, and 207 500 cells/mL after filtering the culture (Fig. 2b). The cell abundance for the experiment was diluted by 1/2 every time based on the maximum cell abundance. The signals were measured 10 times for each cell abundance in the laboratory. To measure a representative mean received level for each experiment, we averaged approximately 50 pings. Filtered seawater without HAB cells (0 cells/mL) was used as a control.
In the field, the two HAB species A. sanguinea and A. affine do not appear during the same season in Korea. Whereas A. sanguinea is the dominant species and forms blooms in autumn, A. affine is dominant and forms blooms in summer. Therefore, the acoustic experiment and water sampling for the field application focused only on A. sanguinea. We set up the acoustic sensing system for one month in the South Sea (Fig. 3a) and continuously measured the acoustic signals in the field (Fig. 3b). To eliminate acoustic signals caused by surface bubbles from breaking waves, the acoustic transducer was placed at a depth of 1.5 m based on the e-folding depth (Crawford and Farmer, 1987). In addition, a hydro-wiper (Zebra-Tech Ltd., Nelson, New Zealand) was applied to the sensor surface once every 30 min to minimize biofouling effects caused by marine organisms. To remove false targets caused by the presence of marine organisms, we applied the moving averaging method (Kim et al., 2018). The measured acoustic data were transmitted in real-time through code division multiple access (CDMA) communication and confirmed on a remotely controlled computer.

|
| Fig.3 Experimental site in the South Sea off the coast of Korea (a) and installation of the acoustic sensing system used in the experiment (November 2016) (b) |
Phytoplankton communities were assessed in seawater samples. The samples were concurrently collected once daily, at the depth and location of the acoustic sensor. Samples were fixed in Lugol's iodine solution to count cells under the microscope (Guillard, 1975).
3 RESULT 3.1 The RRL from laboratory measurements and Sv from the modelThe acoustic signals were measured at five-cell-number intervals according to the cell abundances of A. sanguinea and A. affine, respectively. The mean RRLs were about 3–18 dB for A. sanguinea at a cell abundance of 310–5 060 cells/mL (Fig. 4a), while those of A. affine were about 3–23 dB for a cell abundance of 690–207 500 cells/mL (Fig. 4b). Overall, there was a strong correlation between the RRL and cell abundance, with the RRL tending to increase significantly as the cell abundance increased.

|
| Fig.4 Relative received level (RRL) of Akashiwo sanguinea (a) and Alexandrium affine (b), with cell abundance measured in the laboratory, and a comparison of the relative RRL and relative volume backscattering strength (Sv) of A. sanguinea (c) and A. affine (d) |
To compare the measured RRL and modeled Sv directly, we calculated the relative RRL and relative Sv using the minimum cell abundance of each species as a reference value. The reference values for A. sanguinea and A. affine were therefore 310 and 690 cells/mL, respectively. Over the range of cell abundances of A. sanguinea (310–5 060 cells/mL), the acoustic level increased with increasing cell abundance. The relative RRL and Sv values showed similar tendencies within approximately 1–2 dB (Fig. 4c). In the case of A. affine, at abundances below 20 000 cells/mL, the difference in acoustic level between the relative RRL and Sv values was within 1 dB. However, at a high cell abundance of approximately 80 000 cells/mL, the difference between the relative RRL and Sv values was approximately 5 dB, which was much larger than the difference at low abundances (Fig. 4d).
3.2 Field experimentFigure 5 shows the RRL and cell abundance observed before and after A. sanguinea blooms during autumn in 2016 (acoustic data: Fig. 5a; sampling data: Fig. 5b). All acoustic data were compared with biological sampling data collected at the same time. In the absence of A. sanguinea blooms (November 1 to 7, November 23 to December 1), diatoms were the dominant species in the environment, comprising approximately 96% of the phytoplankton population and including Skeletonema dohrnii/marinoi complex, Pseudonitzschia delicatissima, Chaetoceros curvisetus, Leptocylindrus danicus, and other phytoplankton. Akashiwo sanguinea was a minor species, accounting for the other 4% of all phytoplankton. In the absence of A. sanguinea blooms, the RRLs were almost less than 5 dB, and this tendency remained constant.

|
| Fig.5 The relationship between the relative received level (RRL) and Akashiwo sanguinea cell abundance (a); the phytoplankton composition of the biological sampling data (b) The shaded area indicates an A. sanguinea bloom. |
In contrast, A. sanguinea dominated from November 7 to 23, 2016. During the blooms, A. sanguinea was the dominant species, accounting for 79% of all phytoplankton. The RRL gradually increased, and high RRL values appeared due to A. sanguinea blooms. The RRL was about 7 dB when the HAB cell abundance was about 1 000 cells/mL on November 7. When the cell abundance was 2 000 cells/mL, the RRL was about 12 dB. At the maximum abundance of 3 395 cells/mL, the RRL was about 17 dB. The RRL increased during the day and decreased at night due to diel vertical migration (DVM) in HAB phytoplankton species. DVM patterns were apparent in the measured acoustic signals, and the RRLs were about 13–15 dB during the day and 0 to 3 dB at night. After the HAB species disappeared (November 23), diatoms regained dominance.
4 DISCUSSIONTraditionally, phytoplankton measurements that have been toxic to large numbers of populations have used direct methods using filtered seawater and a microscope. Recently, a detection method using a high-frequency acoustic sensor has been proposed, and results measured at the sea are presented (Bok et al., 2010; Kim et al., 2010, 2018). The most important factor in the acoustic method is the understanding of the acoustic properties of the target phytoplankton. In this study, we first present the acoustical characteristics, which are the key elements for acoustical detection of two species (A. sanguinea and A. affine) of the toxic phytoplankton, and the results of field application are presented. These results will be applied to future methods of acoustic detection of phytoplankton.
In this acoustic system, ultrasonic signals did not transmit continuously for a long time. For analysis of acoustic measurement, a complete data set was obtained from the average of 50 ping data, then elapsed time does not exceed 1 s. In addition, the temperature data were checked inside the system and bottle. Considering a very short time and temperature data, heat effect did not happen and the cooling system did not necessary. In the limitation of field measurements, the two HAB species A. sanguinea and A. affine do not occur during the same season in Korea. A. sanguinea is the predominant species in autumn and A. affine in summer. As the acoustic sensor field experiments were conducted during autumn, our results pertain to A. sanguinea, the dominant species at the time. Therefore, field experiments for A. affine are scheduled for future studies.
The presence of HABs is likely a consequence of pollution and is a threat to sustainable productivity in many coastal areas because HABs deplete the dissolved oxygen in seawater (Kim et al., 2016). Although these phytoplankton HAB species have not been considered potentially harmful or toxic, they cause extensive damage to marine ecosystems at high cell abundances (Kim, 2005; Kwon and Oh, 2014). HABs that occurred in the Bay of Peru and in Monterey Bay of California, USA, reportedly killed fishes and seabirds, and has killed seaweeds and shellfish, resulting in large economic losses and damage to the aquaculture industry in Japan (Matsubara et al., 2007; Jessup et al., 2009). In addition, these species are the suspected cause of fish damages and marine mammal stranding in the 1990's in the Gulf of Mexico (Badylak et al., 2014).
To prevent damage from HAB species, the NIFS in Korea has set a standard for red tide based on cell abundance of HAB species. To alert anglers, the red tide standard consists of three stages: preliminary precaution, precaution, and warning. Alert notices are issued when the cell abundance of dinoflagellates, except Chattonella spp., C. polykrikoides, Gyrodinium sp., and Karenia mikimotoi, exceeds 10 000 cells/mL (preliminary precaution), 30 000 cells/mL(precaution), and 50 000 cells/mL (warning) (NIFS (National Institute of Fisheries Science, Korea), 2018). The target dinoflagellate species (A. sanguinea and A. affine) of this study are considered in this alert system. From the results of laboratory and field experiments using these the two species, we obtained information indicative of the occurrence of a red tide bloom using acoustic data over a short period.
We measured the RRL and modeled the Sv from A. sanguinea and A. affine. Most of the measured relative RRL values were similar to the modeled relative Sv values, i.e., within 2 dB. However, the high abundance of both HAB species differed from the measured and modeled relative values by about 3–5 dB (Fig. 4). The model values linearly increased, but the measured values differed in populations with a higher cell abundance.
The relatively large difference in high abundance is likely to be due to errors in the measurement process. The sample preparation process for high abundance took a relatively long time. This is likely to be due to changes in the acoustically physical parameter. In the model, to reduce the differences between measured and model values, g and h must be accurate. However, when computing the theoretical model, it was difficult to measure the g and h of HAB species due to their very small size. Some previous studies have included g and h estimates for phytoplankton. Eppley et al. (1967) and Oliver et al. (1981) reported g value ranges for phytoplankton of 0.98–1.27 and 1.02–1.07, respectively. Furthermore, Van Ierland and Peperzak (1984) assumed a g value range for dinoflagellates of 1.01–1.21. Kim et al. (2010) applied g=1.07 and h=1.06 as parameters for C. polykrikoides. Kim et al. (2012) assumed parameters of g=1.05 and h=1.05 for Chattonella antiqua. Considering the appearance and structure of algae, model estimates in this study were calculated using g and h parameter values of 1.05 for both HAB species, with both species being similar in size to C. antiqua cells (Kim et al., 2012). In the future, accurate acoustic parameter measurement of the target species is required for more accurate model calculation.
Phytoplankton abundance in the field is shown in Fig. 5b. Diatoms were the most dominant species from November 1 to 6 and accounted for 65% of the total phytoplankton. The corresponding RRLs, including less than 5 dB for diatoms, showed the detection characteristics of the field data. These low RRL values were a result of the low values of the physical properties density ratio (g) and sound speed ratio (h) between the organism's body and seawater. From November 7 to 23, A. sanguinea was the dominant species, accounting for approximately 79% of total phytoplankton. The corresponding high RRL was the result of high g and h values for dinoflagellates.
Akashiwo sanguinea was dominant in the oceanic environments studied here, with the RRL increasing during the day and decreasing at night. However, we could not confirm the mobility of A. sanguinea within the water column, because we measured all of the acoustic signals at a constant depth. Phytoplankton generally moved closer to the sea surface during the daytime to conduct photosynthesis and then moved toward the seafloor at night. In previous studies, one of the phytoplankton species of A. sanguinea and Amphidinium carterae Hulburt migrated vertically in response to light (Katano et al., 2011; Kim et al., 2017). In our field experiment results, the DVM pattern was revealed by the RRL during blooms. Measured surface layer values were higher during the day and lower at night, following the DVM pattern of the HAB species.
5 CONCLUSIONIn this study, we explored the high-frequency acoustic backscattering characteristics of two HAB species, A. sanguinea and A. affine, which occur in the South Sea off the coast of Korea. Due to the small size of the target, we used ultrasound for the measurements. Experiments were conducted under laboratory and field conditions. In the laboratory experiment, the acoustic signal received from each species was directly proportional to the cell abundance. We derived a relationship between the cell abundance and acoustic signal received for each species. The measured signals were compared to predictions of a fluid sphere scattering model. When A. sanguinea blooms appeared at an abundance greater than 3 500 cells/mL, the acoustic signals varied with cell abundance, showing a good correlation. These results confirmed that acoustic measurements could be used to detect HABs. Our findings contribute to our understanding of the HAB acoustic properties. In future studies, we will clarify the vertical migration of HAB species by measuring acoustic signals at multiple depths, including at the surface, middle, and bottom of the water column.
6 DATA AVAILABILITY STATEMENTThe datasets generated and/or analyzed during the current study are available from the corresponding author on reasonable request.
7 ACKNOWLEDGMENTThis research was a part of the project titled "Establishment and demonstration of red tide detection and prediction system for minimizing red tide damage" funded by the Ministry of Oceans and Fisheries, Korea (PM61410). The authors thank Hyun Jung Kim, Junsu Kang, and Hye Jung Han for their help in the laboratory and field data acquisition. Especially, we are grateful to Mr. Byoung-Kwon Kim for technical assistance in acoustic sensing system integration.
Ahn Y H, Shanmugam P, Chang K I, Moon J E, Ryu J H. 2005. Spatial and temporal aspects of phytoplankton blooms in complex ecosystems off the Korean coast from satellite ocean color observations. Ocean Sci. J., 40(2): 67-71.
DOI:10.1007/BF03028587 |
Anderson D M. 1998. Physiology and bloom dynamics of toxic Alexandrium species, with emphasis on life cycle transitions. In: Anderson D M, Cembella A D, Hallegraeff G M eds. Physiological Ecology of Harmful Algal Blooms. Springer, Berlin Heidelberg. p.29-48.
|
Anglès S, Jordi A, Garcés E, Masó M, Basterretxea G. 2008. High-resolution spatio-temporal distribution of a coastal phytoplankton bloom using laser in situ scattering and transmissometry (LISST). Harmful Algae, 7(6): 808-816.
DOI:10.1016/j.hal.2008.04.004 |
Badylak S, Phlips E J, Mathews A L, Kelley K. 2014. Akashiwo sanguinea (Dinophyceae) extruding mucous from pores on the cell surface. Algae, 29(3): 197-201.
DOI:10.4490/algae.2014.29.3.197 |
Bok T H, Paeng D G, Kim E, Na J, Kang D. 2010. Ultrasound backscattered power from Cochlodinium polykrikoides, the main red tide species in the Southern Sea of Korea. J.Plankton. Res., 32(4): 503-514.
DOI:10.1093/plankt/fbq001 |
Crawford G B, Farmer D M. 1987. On the spatial distribution of ocean bubbles. J. Geophys. Res., 92(8): 8231-8243.
|
Eppley R W, Holmes R W, Strickland J D H. 1967. Sinking rates of marine phytoplankton measured with a fluorometer. J. Exp. Mar. Biol. Ecol., 1(2): 191-208.
DOI:10.1016/0022-0981(67)90014-7 |
Guillard R R L. 1975. Culture of phytoplankton for feeding marine invertebrates. In: Smith W L, Chanley M H eds.Culture of Marine Invertebrate Animals. Springer, Boston, MA. p.29-60.
|
Jeong S O, An G H. 2011. The fluctuations of Cochlodinium polykrikoides blooms in coastal waters of Korea. In: Proceedings of the Korean Society of Environment and Ecology Conference. Daegu University, Daegu. p.57-58.
|
Jessup D A, Miller M A, Ryan J P, Nevins H M, Kerkering H A, Mekebri A, Crane D B, Johnson T A, Kudela R M. 2009. Mass stranding of marine birds caused by a surfactant-producing red tide. PLoS One, 4(2): e4550.
DOI:10.1371/journal.pone.0004550 |
Johnson R K. 1977. Sound scattering from a fluid sphere revisited. J. Acoust. Soc. Am., 61(2): 375-377.
DOI:10.1121/1.381326 |
Katano T, Yoshida M, Yamaguchi S, Hamada T, Yoshino K, Hayami Y. 2011. Diel vertical migration and cell division of bloom-forming dinoflagellate Akashiwo sanguinea in the Ariake Sea, Japan. Plankton Benthos Res., 6(2): 92-100.
DOI:10.3800/pbr.6.92 |
Kim E, Lee H, Na J, Choi J W, Kang D. 2010. 5-MHz acousticbackscatter measurements of Cochlodinium polykrikoides blooms in Korean coastal waters. ICES J. Mar. Sci., 67(8): 1759-1765.
DOI:10.1093/icesjms/fsq093 |
Kim H, Bok T H, Paeng D G, Kim J, Nam K H, Lee J B, Shah M M R. 2017. Mobility of Amphidinium carterae Hulburt measured by high-frequency ultrasound. J. Acoust. Soc.Am., 141(4): EL395-EL401.
DOI:10.1121/1.4980007 |
Kim H, Kang D, Jung S W. 2018. Development and application of an acoustic system for harmful algal blooms (HABs, red tide) detection using an ultrasonic digital sensor. Ocean Sci. J., 53(1): 91-99.
DOI:10.1007/s12601-017-0061-0 |
Kim H G. 2005. Harmful Algal Blooms in the Sea. Dasom Publishing Co, Seoul. 467p.
|
Kim H G. 2010. An overview on the occurrences of harmful algal blooms (HABs) and mitigation strategies in Korean coastal waters. In: Ishimatsu A, Lie H J eds. Coastal Environmental and Ecosystem Issues of the East China Sea. TERRAPUB and Nagasaki University, Tokyo. p.121-131.
|
Kim J, Choi J W, Kang D. 2012. Laboratory experiment to measure 5-MHz volume backscattering strengths from red-tide causing microalgae Chattonella antiqua. Ocean Sci. J., 47(3): 173-179.
DOI:10.1007/s12601-012-0017-3 |
Kim J S, Park K W, Youn S H, Lim W A, Yoo Y D, Seong K A, Yih W H. 2016. Species diversity of the dinoflagellate genus Alexandrium in the coastal waters of Korea during summer 2013. Korean Soc. Oceanogr., 21(4): 158-170.
|
Kudela R M, Gobler C J. 2012. Harmful dinoflagellate blooms caused by Cochlodinium sp.:global expansion and ecological strategies facilitating bloom formation. Harmful Algae, 14: 71-86.
DOI:10.1016/j.hal.2011.10.015 |
Kwon H K, Oh S J. 2014. Growth response of the Dinoflagellate Akashiwo sanguinea in relation to temperature, salinity and irradiance, and its advantage in species succession. J.Korean Soc. Mar. Environ. Saf., 20(1): 1-10.
DOI:10.7837/kosomes.2014.20.1.001 |
Lee C K, Lee O H, Lee S M. 2005. Impacts of temperature, salinity and irradiance on the growth of ten harmful algal bloom-forming microalgae isolated in Korean coastal waters. J. Korean Soc. Oceanogr., 10(1): 79-91.
|
Lee K H, Jeong H J, Kwon J E, Kang H C, Kim J H, Jang S H, Park J Y, Yoon E Y, Kim J S. 2016. Mixotrophic ability of the phototrophic dinoflagellates Alexandrium andersonii, A. affine, and A. fraterculus. Harmful Algae, 59: 67-81.
DOI:10.1016/j.hal.2016.09.008 |
Lee Y S, Lee S Y. 2006. Factors affecting outbreaks of Cochlodinium polykrikoides blooms in coastal areas of Korea. Mar. Pollut. Bull., 52(6): 626-634.
DOI:10.1016/j.marpolbul.2005.10.015 |
Lim W A, Lee Y S, Lee S G. 2008. Characteristic of environmental factors related to outbreak and decline of Cochlodinium polykrikoides bloom in the southeast coastal waters of Korea, 2007. J. Korean Soc. Oceanogr., 13(3): 325-332.
|
Matsubara T, Nagasoe S, Yamasaki Y, Shikata T, Shimasaki Y, Oshima Y, Honjo T. 2007. Effects of temperature, salinity, and irradiance on the growth of the dinoflagellate Akashiwo sanguinea. J. Exp. Mar. Biol. Ecol., 342(2): 226-230.
DOI:10.1016/j.jembe.2006.09.013 |
Medwin H, Clay C S. 1998. Fundamentals of Acoustical Oceanography. Academic Press, Boston, MA. 712p.
|
Nguyen-Ngoc L.. 2004. An autecological study of the potentially toxic dinoflagellate Alexandrium affine isolated from Vietnamese waters. Harmful Algae, 3(2): 117-129.
DOI:10.1016/S1568-9883(03)00062-3 |
NIFS (National Institute of Fisheries Science, Korea). 2018.Standard of harmful algal blooms forecast in Korea.http://www.nifs.go.kr/red/operation_4.red. Accessed on 2018-07-01. (in Korean)
|
Oliver R L, Kinnear A J, Ganf G G. 1981. Measurements of cell density of three freshwater phytoplankters by density gradient centrifugation. Limnol. Oceanogr., 26(2): 285-294.
DOI:10.4319/lo.1981.26.2.0285 |
Rabalais N N, Turner R E, Díaz R J, Justić D. 2009. Global change and eutrophication of coastal waters. ICES J. Mar.Sci., 66(7): 1528-1537.
DOI:10.1093/icesjms/fsp047 |
Rhodes L L, Mackenzie A L, Kaspar H F, Todd K E. 2001. Harmful algae and mariculture in New Zealand. ICES J.Mar. Sci., 58(2): 398-403.
DOI:10.1006/jmsc.2000.1023 |
Simmonds J, MacLennan D N. 2005. Fisheries Acoustics: Theory and Practice. 2nd edn. Blackwell, Oxford, UK. 437p.
|
Steidinger K A, Tangen K. 1997. Dinoflagellates. In: Tomas C R ed. Identifying Marine Phytoplankton. Academic Press, San Diego. p.387-598.
|
Tang Y Z, Gobler C J. 2015. Sexual resting cyst production by the dinoflagellate Akashiwo sanguinea:a potential mechanism contributing to the ubiquitous distribution of a harmful alga. J. Phycol., 51(2): 298-309.
DOI:10.1111/jpy.12274 |
Van Ierland E T, Peperzak L. 1984. Separation of marine seston and density determination of marine diatoms by density gradient centrifugation. J. Plankton Res., 6(1): 29-44.
DOI:10.1093/plankt/6.1.29 |