 2019, Vol. 37
Institute of Oceanology, Chinese Academy of Sciences
Article Information
- ZHANG Man, SMYTH Rebecca Ashley, ZHU Weixia, ZHANG Li, LI Yuncong, WANG Yifan, LI Xuejun, GU Qianhong, GAO Yunni
- Spatial distribution and filtering efficiency of Daphnia in a deep subtropical reservoir
- Journal of Oceanology and Limnology, 37(4): 1277-1288
- http://dx.doi.org/10.1007/s00343-019-8100-6
Article History
- Received Apr. 20, 2018
- accepted in principle Aug. 14, 2018
- accepted for publication Nov. 1, 2018


2 Tropical Research and Education Centre, University of Florida, Homestead 33031, U.S.;
3 Henan Entry-Exit Inspection and Quarantine Bureau, Zhengzhou 450003, China
Compared to natural lakes, reservoirs experience greater spatial heterogeneity (Kalff, 2002; Han and Liu, 2011) associated with management for water quality. Reservoir zonation occurs longitudinally as water enters from a stream into an impoundment. In a typical reservoir, abiotic and biotic variables (flow rate, depth, trophic state, food resources, transparency, etc.) change along the continuum from the riverine source, through the transition zone into the lacustrine zone. The change in environmental conditions can influence the biota, leading to distinct biological zones. Studies of how differences of zooplankton distribution and function in different zones of a reservoir could, to some extent, help managers protect water quality (Kirk, 2011; Betini et al., 2017).
The "multiple driving forces hypothesis" predicts that, on large spatial scales, physical processes including water temperature and wind have strong control over the spatial distribution organisms; while on small spatial scales, biological drivers (including predation, competition, size of organisms and food sources) are strong (Pinel-Alloul, 1995). At a small spatial scale, a reservoir always is strong controlled by biological drivers over the spatial distribution. For example, Elser et al. (2001) pointed out that the taxonomic composition and distribution of zooplankton is influenced by the food quality. Terrestrial carbon inputs partition into different spatial regions of a reservoir and, therefore impact zooplankton distribution. Terrestrial carbon inputs are greater in riverine and transitional zones than in lacustrine zones, leading to growth efficiency variations for zooplankton in the former associated with a decrease in food quality (Brett et al., 2009).
In zooplankton communities, Daphnia exerts strong grazing effects on organic particles (phytoplankton and its retinue; e.g., bacterioplankton and associated organic detritus) (Sarnelle, 2005; Altshuler et al., 2011; Effler et al., 2015). Persson et al. (2007) pointed out that Daphnia is a keystone genus in freshwater ecosystems, providing a major link in the energy flow between primary producers and secondary consumers in these food webs. They exert greater top-down control over primary producer biomass and water clarity than other zooplankton. As a non-selective filter feeding cladocerans, Daphnia has short lifecycles and respond rapidly to changes in the environment (Adrian et al., 2009; Fischer et al., 2011; De Senerpont Domis et al., 2013). The spatial pattern is of considerable interest, because under some conditions, it may influence phytoplankton community and water clarity (Kirk, 2011; Betini et al., 2017). The ability for Daphnia to control water clarity through grazing is related to body size as well as taxonomic composition (Cyr and Curtis, 1999). In addition, the maximum size of edible particles depends on body size (Burns, 1968). Daphnia with a larger body size has a strong control on phytoplankton and other particle detritus (Sarnelle, 2005). Therefore, knowledge of how Daphnia distribution and filtering efficiency in different zones of a reservoir would help explain phytoplankton biomass and protect water quality in reservoir management.
In order to elucidate the Daphnia distribution and their filtering efficiency in different zones of a reservoir and provide scientific suggestions for reservoir management, we compared to transition zone to lacustrine zone, both of which are easily modified by anthropogenic withdrawals. We took seasonal samples over two annual cycles from both zones, in a deep and meso-eutrophic reservoir in China to (ⅰ) determine the difference in the Daphnia distribution and filtering efficiency between the two zones; (ⅱ) evaluate the influence of environmental variability and the strength of environmental factors have on structuring Daphnia; and (ⅲ) quantify the interactions between Daphnia and water clarity in the two zones.
2 MATERIAL AND METHOD 2.1 Study sitesSamples were collected from Nanwan Reservoir (32°4′N, 113°57′E, Fig. 1), which is a deep, monomictic and mesotrophic reservoir, locates in Xinyang, Henan, in central China. It has a watershed area of 1 100 km2, water surface area of 4 573 km2, the total volume of 16.33×10⁸ m3, and an average depth of 13.5 m (Yu et al., 2009). The reservoir is mainly fed by 3 rivers: Wudao, Dongjia, and Tanjia Rivers. The average concentration (2014–2015 years) of total nitrogen (TN) and total phosphorus (TP) in the reservoir were 822.9 μg/L and 22.1 μg/L, respectively, indicating that the reservoir was meso-eutrophic (Carlson, 1977). The dry season, when precipitation is scarce, spans from October to May and the wet season from June to September during which about 60% of annual precipitation occurs. Silver carp (Hypophthalmichthys molitrix) and bighead carp (Aristichthys nobilis) have been intensively stocked in the past 15 years, and are the dominant fishes in the reservoir. The samples were collected from three transition sites and three lacustrine sites (Fig. 1).

|
| Fig.1 Location of Nanwan Reservoir and the sampling sites Stars: sites were chosen as transition zone; black dots: sites were chosen as lacustrine zone. |
Transition Zone (Sites 1–3): These sites were about 4–6 km below the tributary rivers and chosen as a type of river-reservoir transitional zone. These study sites were shallow (4–8 m), and had a negligible velocity (< 0.5 m/s), good light availability (Secchi depth > 1 m), and a soft and fine sediment bottom. The riverine watershed is primarily composed of forest and urban land with some agricultural areas.
Lacustrine Zone (Sites 4–6): These sites were characterized by decreased flow rates (< 0.1 m/s) and greater depth (8–18 m), resulting in decreased suspended solids, greater light penetration (Secchi depth > 2 m), but lower primary productivity (chlorophyll a (chl a) < 15 μg/L) due to decrease nutrient availability.
2.2 Sample collection and analysisWater temperature (T, ℃), dissolved oxygen (DO, mg/L) and pH were measured in the water surface by a multi-parameter water quality monitor (YSI incorporated Yellow Springs Ohio, USA). Secchi depth (SD) was recorded as a measure of water clarity. SD, an apparent optical property, is determined by the light-attenuating process of scattering caused by particles, including phytoplankton, bacterioplankton, associated organic detritus, and minerogenic particles.
As the major food of zooplankton, phytoplankton always lives in the euphotic zone. Thus, surface water samples for measuring nutrients, chl a and phytoplankton were collected with a 5-L iron sampler seasonally from September 21, 2014, to June 31, 2016. Soluble reactive phosphorus (SRP), dissolved inorganic nitrogen (DIN, NO3-N+NO2-N+NH4-N), total phosphorus (TP), total nitrogen (TN), and chl a) concentrations were measured according to the Chinese National Standards for water quality and the USA Environmental Protection Agency standards (APHA, 1989). After filtering 500-mL water samples through a 0.45-mm acetate fiber mesh filter, chl a was extracted with acetone and measured by spectrophotometry (Lorenzen, 1967; Lin et al., 2005). Chl a concentration is a proxy for estimating phytoplankton biomass, which could be consist of important part of particles in the water column. Samples for particulate organic carbon (POC) concentrations were filtered on pre-combusted (450℃ for 4 h) Whatman GF/F glass fiber filters and dried. Then filters were decarbonated with HCl fumes for 4 h, dried, and packed in silver cups. POC concentration was measured using an elemental analyzer (Euro EA 3028).
Phytoplankton samples were preserved with 1% Lugol's solution and 4% formaldehyde and were stored in cold conditions (4℃). After sedimentation for at least 64 h, the supernatant was siphoned off with a diameter hose. The residue (about 25 mL) was collected and used for counting phytoplankton. At least 300 phytoplankton units placed in a Sedgewick Rafter counting chamber were counted under an optical microscope at 400× magnification (APHA, 1989). Taxa were determined to the species wherever possible. To estimate phytoplankton biomass, at least 25 individuals for each species were measured and then approximations to geometric solids were applied to calculate individual biovolume (Hillebrand et al., 1999). Biomass of phytoplankton was estimated from the individual volume, assuming that 106 μm3 correspond to 1 μg of biomass. In addition, phytoplankton was measured by the length of the greatest axial linear dimension (GALD). Because GALD is related to Daphnia edibility, we defined edible phytoplankton as any species with GALD < 35 μm.
Zooplankton was sampled from each of the separate six sampling sites. To estimate the zooplankton biomass in the whole water layer, for each sample, a total of 40 L water was collected from the surface to the bottom at well-spaced intervals according to the different depths (4–18 m) of the sampling sites. Water was filtered through a 45-μm nylon net and concentrated to 10–20 mL. Samples were preserved with 5% formaldehyde. Since zooplankton species could not be sampled separately, all zooplankton species were sorted and counted using an optical microscope. To estimate the average body length of each zooplankton species, at least 25 specimens were measured. Biomass of each species was estimated from the average individual body length. Individual body wet weight (μg) was estimated following the equations of Zhang and Huang (1991). The zooplankton taxa were classed into three groups: Daphnia, other crustaceans, and rotifers + protozoa.
We estimated the Daphnia filtering rate as followed (Burns, 1969):
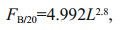
where FB/20 is the filtering rate at 20℃ (mL/(animal·d)) and L is the body size of the Daphnia (mm). The rate at the ambient temperature T is calculated according to an Arrhenius relationship:
where the coefficient θ was specified as 1.104 8 for D. galeata and 0.993 8 for D. pulex (Burns, 1969), respectively.
The overall filtering efficiency by Daphnia per unit volume of oxic water (F, mL/(L·d)), is calculated as:
where FD/a is the filtering rate of D. galeata and consists of more than 90% of total Daphnia species. Kf is the net efficiency. A value of Kf=0.5 is adopted according to Kasprzak et al. (1999) and Effler et al. (2015). Nh is the number of Daphnia collected in the vertical haul. Vn/DO is the volume of the vertical haul for the portion of the water column, for which the dissolved oxygen concentration (DO) is > 1 mg/L (usually the uppermost 8–10 m).
2.3 Statistical analysisThe mean values from three sites were used to give a value for each region. The Pearson correlation analysis was used to determine relationships between two parameters. Linear regression analysis was followed by the Pearson correlation analysis in case of significant effects. Linear regression analysis was conducted to search for possible cause-effect interactions in further. R2, P value and standard error (SE) were estimated in the analyses. The differences in environmental parameters, chl a concentration, edible phytoplankton biomass, zooplankton abundance and biomass between the two zones were tested by independent T-test. The assumed significance level was α=0.05. The statistical analysis was conducted in SPSS (SPSS for Windows, version 17.0).
After testing runs of detrended correspondence analysis (DCA), our results show that the gradient lengths of the first axis were 2.057. The results indicate that the linear model RDA was suitable for the analysis. Redundancy analysis (RDA) was used to identify the abiotic variables that drove the spatial distribution of the zooplankton groups in the reservoir. The statistical analysis was run with CANOCO (version 4.5).
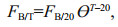
3 RESULT 3.1 Abiotic conditionsTable 1 shows the actual values of physical and chemical variables at six sampling sites and means values at two zones in the reservoir. The pH and water velocities were significantly higher in the transition zone than those in the lacustrine zone (pH: P=0.029; water velocity: P < 0.001). No differences in DO and water temperature were found between the transition and lacustrine zones (DO: P=0.418; water temperature: P=0.542). Significantly higher chl a concentrations were found in the transition zone than in the lacustrine zone (t-test, P=0.005). DIN and SRP concentrations were often higher in transition zone, but no significant differences were tested (DIN: P=0.061; SRP: P=0.367).
|
The zooplankton species composition was similar in the two zones. D. geleata and D. pulex were present in both zones. The dominant Daphnia was D. geleata, accounting for more than 90% of total Daphnia biomass in the two zones (Fig. 2e–h). The other cladocerans were represented by Diaphanosoma leuchtenbergianum, Chydorus sp., Moina sp., Bosmina sp., Leptodora kindtii, followed by copepods Neutrodiaptomus incongruens, Mesocyclops leuckarti, Thermocyclops taihokuensis and copepodids. Rotifers (mainly Filinia sp., Trichocerca sp., Brachionus urceus, Keratella ticinensis, and Keratella cochlearis) and Protozoa (mainly Difflugia corona, Difflugia urceolata, Difflugia acuminate, Difflugia oblonga, Tintinnopisis sp.) were also present but in very low biomass.

|
| Fig.2 Temporal variation of zooplankton and Daphnia (mean values±standard error from all three sites across the zone) during study period a. zooplankton abundance in transition zone; b. zooplankton abundance in lacustrine zone; c. zooplankton biomass in transition zone; d. zooplankton biomass in lacustrine zone; e. Daphnia abundance in transition zone; f. Daphnia abundance in lacustrine zone; g. Daphnia biomass in transition zone; h. Daphnia biomass in lacustrine zone. |
Overall, more Daphnia were detected in the lacustrine zone than in the transition zone (t-test, P < 0.001). In the transition zone, Daphnia accounted for only 4% of total zooplankton abundance and 14.3% of total zooplankton biomass (Fig. 2a, 2c), whereas Daphnia contributed to approximately 10% of total zooplankton abundance and 16.7% of total zooplankton biomass in the lacustrine zone (Fig. 2b, 2d). Significantly higher abundance (t-test, P=0.02) and biomass (t-test, P=0.019) of Daphnia were found in the lacustrine zone especially in March (abundance: 42%, biomass: 45% in 2015).
Greater Daphnia filtering was often found in lacustrine zone than in the transition zone (t-test, P=0.05), especially in March. Overall, Daphnia filtration ranged from 0 to 2.1×10³ mL/(L·d) in the transition zone, and from 0.2 to 6.9×10³ mL/(L·d) in the lacustrine zone (Fig. 3a).

|
| Fig.3 Variables (mean values±standard error from all three sites across the zone) related to Daphnia filtering efficiency during study period a. Daphnia filtering rates and Daphnia body length; b. Secchi depth (SD); c. chl a concentration; d. POC/chl a ratio. |
Deeper SD was observed in the lacustrine zone than in the transition zone (t-test, P=0.02). The SD ranged from 1.1 m to 2.7 m in the transition zone, and from 1.5 m to 4.5 m in the lacustrine zone (Fig. 3b). SD could exceed 2.5 m when Daphnia filtering was above the 2×10³ mL/(L·d). A positive relationship between the Daphnia filtering and SD is supported by the Pearson Correlation Analyses in the lacustrine zone (R=0.876, P=0.004).
Chl a concentration were always higher in the transition zone than in the lacustrine zone (t-test, P=0.012). The chl a concentration ranged from 0.5 to 21.4 μg/L in the transition zone, and from 0.8 to 15.4 μg/L in the lacustrine zone (Fig. 3c).
POC/chl a ratios can trace variation in suspended particulate organic matter composition, because POC in water includes terrestrial components whereas chl a is specific to autotrophs (Marra, 2002). Significantly higher POC/chl a ratios were found in the transition zone than in the lacustrine zone (t-test, P < 0.001, Fig. 3d), indicating more allochthonous material constituted the food source for Daphnia in transition zone.
3.3 Edible phytoplankton composition and biomassDuring the observation period, 110 taxa were identified for edible phytoplankton (GALD < 35 μm), distributing in 8 taxonomic groups: Chlorophyta (64), Bacillariophyta (18), Cyanophyta (16), Euglenophyta (4), Xanthophyta (3), Chrysophyta (3), Cryptophyta (1), Euglenophyta (1). In both of the two zones, Bacillariophyta and Cyanophyta relative biomass had main contribution of the total phytoplankton biomass. Bacillariophyta and Cyanophyta relative biomass had no significant differences in the two zones (t-test, P > 0.05), indicating that edible phytoplankton community of major taxonomic groups were similar in relative biomass composition between the two zones (Fig. 4). No significant difference of GALD < 35 μm phytoplankton biomass was found between the two zones (Fig. 5), suggesting that edible phytoplankton biomass could not explain high Daphnia distribution in lacustrine zone.

|
| Fig.4 GALD < 35 μm phytoplankton relative biomass composition (mean values from all three sites across the zone) during the study period a. transition zone; b. lacustrine zone. |

|
| Fig.5 GALD < 35 μm phytoplankton biomass (mean values± standard error from all three sites across the zone) in the transition and lacustrine zones during the study period |
The ratio of Daphnia biomass to chl a concentration (D/chl a ratio) fluctuated during the study period (Fig. 6). Overall, D/chl a ratios were significantly higher in the lacustrine zone than that in transition zone (t-test, P=0.002), indicating a possible enhanced grazing pressure on phytoplankton. In spring, the D/chl a ratio is high in both transition and lacustrine zones.

|
| Fig.6 The ratio of Daphnia biomass to chl a concentration (D/chl a ratio) (mean values±standard error from all three sites across the zone) during the study period |
To find the main strength of environmental variables for zooplankton community in the two zones, 10 different abiotic variables including POC/chl a, water velocity, pH, chl a, SD, TN, TP, DIN, SRP, and DO were selected to perform the RDA in the reservoir. The results of RDA using all 10 variables are illustrated in Fig. 7. Forward selection indicated that water velocity and POC/chl a were responsible for explaining 20.1% and 17.4% of the environmental variables in the first two axes, respectively (Monte Carlo test, P < 0.05), indicating that the two environmental variables made significant contributions to the zooplankton abundance. The first two axis account for 91.9% of the variance for the relationship between zooplankton community and environment.

|
| Fig.7 Ordination diagrams of redundancy analysis (RDA) showing variation of the zooplankton groups in relation to environment variability in the reservoir POC/chl a: ratio of particulate organic carbon to chlorophyll-a concentration; velocity: water velocity; TN: total nitrogen; TP: total phosphorus; DIN: dissolved inorganic nitrogen; SRP: soluble reactive phosphorus; DO: dissolved oxygen; SD: Secchi depth; chl a: chlorophyll a. Dots 1-24 (green color) represent the samples in the transition zone; dots 25-48 (blue color) represent the samples in the lacustrine zone. |
The linear regression analyses help to explain the cause-effect interactions between environmental parameters and Daphnia in further. A positive relationship between the Daphnia abundance and SD was supported by the linear regression analysis (R=0.653, P < 0.001, SE=4.88). Negative linear correlations were found between the Daphnia abundance and water velocity (Fig. 8a), and between the Daphnia abundance and POC/chl a (Fig. 8b). In the lacustrine zone, slower water velocity and lower ratio of POC/chl a accompanied by higher abundance of Daphnia could explain the deeper SD.

|
| Fig.8 The linear regression showing variations of Daphnia abundance in relation to water velocity and POC/ chl a ratio a. Daphnia abundance vs. water velocity; b. Daphnia abundance vs. the ratio of particulate organic carbon to chl a concentration (POC/chl a). |
Conditions in reservoirs are suitable for the development of spatial distribution, promoting variable distribution of species including Daphnia (Han and Liu, 2011). Throughout our study, there were significant increases in both Daphnia abundance and biomass in the lacustrine zone compared to the transition zone. Different zones displayed significant differences in abundance and biomass, indicating an extremely patchy distribution at a small spatial scale. Several researchers have reported different reasons for such a patchy distribution. For example, Verreth (1990) found that Daphnia was concentrated heavily in the lacustrine zone of a pond, and speculated that wind-induced currents may have displaced them on the down-wind side of the pond. Furthermore, Kvam and Kleiven (1995) found several Daphnia swarms with densities up to 4 000 ind./L in Lake Myravatn because of a predator avoidance. In our study, wind and predator avoidance do not explain the patchy distribution of Daphnia, since the three transition sites were connected to the lacustrine zone from different directions. Food quantity could not explain high Daphnia distribution in the lacustrine zone either, because no significant differences of edible phytoplankton composition and biomass were found in the two zones.
Rapid water velocity or short retention time can cause the Daphnia decrement in the transition zone. The negative relationship between water velocity and Daphnia abundance indicate that rapid water velocity could lead to Daphnia loss. This agrees with previous studies (Wiedenheft, 1984; Zhang et al., 2013; Da Rosa et al., 2017). Wiedenheft (1984) found lower Daphnia abundance with fast water velocity in the Missouri River compared to sample sites within a reservoir with longer retention time. Zhang et al. (2013) also pointed out that short retention time induced by increased outflow could remove large crustaceans leading to an increase in phytoplankton biomass and abundance after withdrawal. Thus, slow water velocity is important for maintenance of a healthy Daphnia community.
Food quality could explain the patchy distribution of Daphnia on the other hand. Previous studies have shown that low food quality could suppress Daphnia development (Taipale et al., 2011; McMeans et al., 2015). McMeans et al. (2015) found that higher somatic growth but no viable egg reproduction in D. magna exposed to high dissolved organic carbon (t-DOC) concentration and attributed the growth response to the provision of bacteria rather than direct t-DOC utilization. In addition, Taipale et al. (2011) showed that the conversion rate from α-linolenic acid (α-LA) to eicosapentaenoic acid (EPA) and docosahexaenoic acid (DHA) is low in herbivorous Daphnia, and thus Daphnia require EPA and DHA directly from their diets. However, terrestrial organic carbon available to support aquatic organism is almost entirely devoid of essential fatty acids and sterols (Brett et al., 2009; Taipale et al., 2014). The POC/chl a ratio can distinguish terrestrial detritus (POC/chl a greater than 100) from phytoplankton (POC/chl a between 30 and 100) (Meybeck et al., 1988). In our study, the POC/chl a ratios were constant in the lacustrine zones ranging from 66.7 to 85.1. However, the ratios increased to 84.5–136.3 in the transition zones, especially in summer (Fig. 3d). Thus, there was a notable difference in suspended particulate organic matter composition between phytoplankton-derived organic matter in the lacustrine zone and terrestrial organic matter during summer in the transition zone. Rain along with a higher turbidity associated with the inflow water could explain the increase in the terrestrial organic matter during summer in the transition zone. We suggest that these allochthonous resources may allow Daphnia to survive but limit population increase. In fact, Wetzel (1995) hypothesized that allochthonous resources might function as a metabolic "lifeboat" by providing low-quality resources that allowed consumers to survive during periods when more nutritious autochthonous resources were not available. Future research on fatty acids of allochthony and Daphnia should be considered to elucidate food quality and Daphnia abundance.
A number of factors can contribute to spatial variations of Daphnia along the water flow in a reservoir. In our study, water velocity and POC/chl a ratio may be not the only two factors account for the spatial variation. Even more, factors together could help to explain. However, within the existing environmental factors, those two factors are what we could make sure in analyzing the causes of spatial variation.
The D/chl a ratio can be used as an indicator of filtering efficiency on phytoplankton in the water column (Muylaert et al., 2003). In our study, the high ratio of D/chl a in the lacustrine represented strong top-down control on phytoplankton, especially in spring. In addition, there are other explanations for the variation in the ratio. For example, Havens and Beaver (2013) examined crustacean zooplankton from 15 shallow lakes in the south and central Florida and found that short-term and seasonal changes in biomass ratio of zooplankton to phytoplankton in Florida might be controlled by fish predation. However, fish predation could not explain the different D/chl a ratio in our study because fish can swim throughout the reservoir and have a similar density within the two zones.
In the formula, the filtering rate estimates were strongly correlated with Daphnia density and individual body length. The higher Daphnia filtering rate could reduce turbidity and lead to the deeper SD in the lacustrine zone. In spring, when Daphnia filtering rate was high, there was a long period of high water clarity. Daphnia filtering maybe not the only the reason accounting for the water clarity. But undeniable, the Daphnia filtering could play important roles in water clarity especially during spring. Tirok and Gaedke (2006) pointed out that high clarity events are commonly attributed to Daphnia grazing, although other consumers have also been implicated. Effler et al. (2015) also found that the high clarity events in Onondaga Lake were associated with elevated levels of Daphnia grazing.
5 CONCLUSIONIn our study, there were significant increases in Daphnia abundance and biomass in the lacustrine zone compared to the transition zone. The reasons of water velocity and food quality could help explaining Daphnia patchy distribution at a small spatial scale. On the one hand, rapid water velocity can cause the Daphnia decrement in the transition zone. On the other hand, a notable difference in suspended particulate organic matter composition between phytoplankton-derived organic matter in the lacustrine zone and terrestrial organic matter in the transition zone, indicating that food quality difference could explain the patchy distribution of Daphnia. The increased Daphnia filtering efficiency probably explained the water clarity in the lacustrine zone, especially during spring.
6 DATA AVAILABILITY STATEMENTThe data generated during the current study are available from the corresponding author on reasonable request.
Adrian R, O'Reilly C M, Zagarese H, Baines S B, Hessen D O, Keller W, Livingstone D M, Sommaruga R, Straile D, Van Donk E, Weyhenmeyer G A, Winder M. 2009. Lakes as sentinels of climate change. Limnol. Oceanogr., 54(6): 2283-2297.
|
Altshuler I, Demiri B, Xu S, Constantin A, Yan N D, Cristescu M E. 2011. An integrated multi-disciplinary approach for studying multiple stressors in freshwater ecosystems:Daphnia as a model organism. Integr. Comp. Biol., 51(4): 623-633.
DOI:10.1093/icb/icr103 |
American Public Health Association (APHA). 1989. Standard Methods for the Examination of Water and Wastewater. 17th edn. APHA-AWWA-WPCF, Washington DC.
|
Betini G S, Avgar T, McCann K S, Fryxell J M. 2017. Daphnia inhibits the emergence of spatial pattern in a simple consumer-resource system. Ecology, 98(4): 1163-1170.
DOI:10.1002/ecy.1752 |
Brett M T, Kainz M J, Taipale S J, Seshan H. 2009. Phytoplankton, not allochthonous carbon, sustains herbivorous zooplankton production. Proc. Natl. Acad.Sci. USA, 106(50): 21197-21201.
DOI:10.1073/pnas.0904129106 |
Burns C W. 1968. The relationship between body size of filter-feeding Cladocera and the maximum size of particle ingested. Limnol. Oceanogr., 13(4): 675-678.
DOI:10.4319/lo.1968.13.4.0675 |
Burns C W. 1969. Relation between filtering rate, temperature, and body size in four species of Daphnia. Limnol.Oceanogr., 14(5): 693-700.
DOI:10.4319/lo.1969.14.5.0693 |
Carlson R E. 1977. A trophic state index for lakes. Limnol.Oceanogr., 22(2): 361-369.
DOI:10.4319/lo.1977.22.2.0361 |
Cyr H, Curtis J M. 1999. Zooplankton community size structure and taxonomic composition affects size-selective grazing in natural communities. Oecologia, 118(3): 306-315.
DOI:10.1007/s004420050731 |
Da Rosa L M, De Souza Cardoso L, Crossetti L O, Da Motta-Marques D. 2017. Spatial and temporal variability of zooplankton-phytoplankton interactions in a large subtropical shallow lake dominated by non-toxic cyanobacteria. Mar. Freshwater Res., 68(2): 226-243.
DOI:10.1071/MF15356 |
De Senerpont Domis L N, Elser J J, Gsell A S, Huszar V L M, Ibelings B W, Jeppesen E, Kosten S, Mooij W M, Roland F, Sommer U, Van Donk E, Winder M, Lürling M. 2013. Plankton dynamics under different climatic conditions in space and time. Freshwater Biol., 58(3): 463-482.
DOI:10.1111/fwb.2013.58.issue-3 |
Effler S W, Spada M E, Gelda R K, Peng F, Matthews D A, Kearns C M, Hairston N G Jr. 2015. Daphnia grazing, the clear water phase, and implications of minerogenic particles in Onondaga Lake. Inland Waters, 5(4): 317-330.
DOI:10.5268/IW |
Elser J J, Hayakawa K, Urabe J. 2001. Nutrient limitation reduces food quality for zooplankton:Daphnia response to seston phosphorus enrichment. Ecology, 82(3): 898-903.
DOI:10.1890/0012-9658(2001)082[0898:NLRFQF]2.0.CO;2 |
Fischer J M, Olson M H, Williamson C E, Everhart J C, Hogan P J, Mack J A, Rose K C, Saros J E, Stone J R, Vinebrooke R D. 2011. Implications of climate change for Daphnia in Alpine lakes:predictions from long-term dynamics, spatial distribution, and a short-term experiment. Hydrobiologia, 676(1): 263-277.
DOI:10.1007/s10750-011-0888-9 |
Han B P, Liu Z W. 2011. Tropical and Sub-Tropical Reservoir Limnology in China: Theory and Practice. Springer, Dordrecht.
|
Havens K E, Beaver J R. 2013. Zooplankton to phytoplankton biomass ratios in shallow Florida lakes:an evaluation of seasonality and hypotheses about factors controlling variability. Hydrobiologia, 703(1): 177-187.
DOI:10.1007/s10750-012-1357-9 |
Hillebrand H, Dürselen C D, Kirschtel D, Pollingher U, Zohary T. 1999. Biovolume calculation for pelagic and benthic microalgae. J. Phycol., 35(2): 403-424.
DOI:10.1046/j.1529-8817.1999.3520403.x |
Kalff J. 2002. Limnology: Inland Water Ecosystems. Upper Saddle River Press, Prentice Hall.
|
Kasprzak P, Lathrop R C, Carpenter S R. 1999. Influence of different sized Daphnia species on chlorophyll concentration and summer phytoplankton community structure in eutrophic Wisconsin lakes. J. Plankton Res., 21(11): 2161-2174.
DOI:10.1093/plankt/21.11.2161 |
Kirk J T O. 2011. Light and Photosynthesis in Aquatic Ecosystems. Cambridge University Press, Cambridge.
|
Kvam O V, Kleiven O T. 1995. Diel horizontal migration and swarm formation in Daphnia in response to Chaoborus. Hydrobiologia, 307(1-3): 177-184.
DOI:10.1007/BF00032010 |
Lin S J, He L J, Huang P S, Han B P. 2005. Comparison and improvement on the extraction method for chlorophyll a in phytoplankton. Ecol. Sci., 24(1): 9-11.
(in Chinese with English abstract) |
Lorenzen C J. 1967. Determination of chlorophyll and pheo-pigments:spectrophotometric equations. Limnol.Oceanogr., 12(2): 343-346.
DOI:10.4319/lo.1967.12.2.0343 |
Marra J. 2002. Approaches to the measurement of plankton production. In: Williams P J L B, Thomas D N, Reynolds C S eds. Phytoplankton Productivity: Carbon Assimilation in Marine and Freshwater Ecosystems. Blackwell Science Ltd, Oxford. p.78-108.
|
McMeans B C, Koussoroplis A M, Kainz M J. 2015. Effects of seasonal seston and temperature changes on lake zooplankton fatty acids. Limnol. Oceanogr., 60(2): 573-583.
DOI:10.1002/lno.10041 |
Meybeck M, Cauwet G, Dessery S, Somville M, Gouleau D, Billen G. 1988. Nutrients (organic C, P, N, Si) in the eutrophic River Loire (France) and its estuary. Estuar., Coast Shelf Sci., 27(6): 595-624.
DOI:10.1016/0272-7714(88)90071-6 |
Muylaert K, Declerck S, Geenens V, Van Wichelen J, Degans H, Vandekerkhove J, Van der Gucht K, Vloemans N, Rommens W, Rejas D, Urrutia R, Sabbe K, Gillis M, Decleer K, De Meester L, Vyverman W. 2003. Zooplankton, phytoplankton and the microbial food web in two turbid and two clearwater shallow lakes in Belgium. Aquat. Ecol., 37(2): 137-150.
DOI:10.1023/A:1023988702926 |
Persson J, Brett M T, Vrede T, Ravet J L. 2007. Food quantity and quality regulation of trophic transfer between primary producers and a keystone grazer (Daphnia) in pelagic freshwater food webs. Oikos, 116(7): 1152-1163.
DOI:10.1111/oik.2007.116.issue-7 |
Pinel-Alloul B. 1995. Spatial heterogeneity as a multiscale characteristic of zooplankton community. Hydrobiologia, 300-301(1): 17-42.
DOI:10.1007/BF00024445 |
Sarnelle O. 2005. Daphnia as keystone predators:effects on phytoplankton diversity and grazing resistance. J.Plankton Res., 27(12): 1229-1238.
DOI:10.1093/plankt/fbi086 |
Taipale S J, Brett M T, Hahn M W, Martin-Creuzburg D, Yeung S, Hiltunen M, Strandberg U, Kankaala P. 2014. Differing Daphnia magna assimilation efficiencies for terrestrial, bacterial, and algal carbon and fatty acids. Ecology, 95(2): 563-576.
DOI:10.1890/13-0650.1 |
Taipale S J, Kainz M J, Brett M T. 2011. Diet-switching experiments show rapid accumulation and preferential retention of highly unsaturated fatty acids in Daphnia. Oikos, 120(11): 1674-1682.
DOI:10.1111/j.1600-0706.2011.19415.x |
Tirok K, Gaedke U. 2006. Spring weather determines the relative importance of ciliates, rotifers and crustaceans for the initiation of the clear-water phase in a large, deep lake. J. Plankton Res., 28(4): 361-373.
DOI:10.1093/plankt/fbi121 |
Verreth J. 1990. The accuracy of population density estimates of a horizontally distributed zooplankton community in Dutch fish ponds. Hydrobiologia, 203(1-2): 53-61.
DOI:10.1007/BF00005613 |
Wetzel R G. 1995. Death, detritus, and energy flow in aquatic ecosystems. Freshwater Biol., 33(1): 83-89.
DOI:10.1111/fwb.1995.33.issue-1 |
Wiedenheft W D. 1984. Establishment of Aquatic Baselines in Large Inland Impoundments:Segment 3 Report. US Department of Commerce, Helena. Yu G Z, Huang K, Chen F Y, Gao H, Zhao C M. 2009. Eco-environmental problems with the development on large-scale reservoirs in Xinyang City-using Nanwan reservoir as an example. J. Hydroecol., 2(1): 142-146.
(in Chinese with English abstract) |
Zhang M, Lin Q Q, Xiao L J, Wang S, Qian X, Han B P. 2013. Effect of intensive epilimnetic withdrawal on the phytoplankton in a (sub)tropical deep reservoir. J. Limnol., 72(3): 430-439.
|
Zhang Z S, Huang X F. 1991. Research Methods of Freshwater Plankton. Science Press, Beijing.
(in Chinese)
|