 2019, Vol. 37
Institute of Oceanology, Chinese Academy of Sciences
Article Information
- SONG Junjie, ZHAO Bo, LIU Jinhu, CAO Liang, DOU Shuozeng
- Comparative study of otolith and sulcus morphology for stock discrimination of yellow drum along the Chinese coast
- Journal of Oceanology and Limnology, 37(4): 1430-1439
- http://dx.doi.org/10.1007/s00343-019-8056-6
Article History
- Received Mar. 14, 2018
- accepted in principle May. 30, 2018
- accepted for publication Sep. 6, 2018


2 Laboratory for Marine Ecology and Environmental Science, Qingdao National Laboratory for Marine Science and Technology, Qingdao 266071, China;
3 University of Chinese Academy of Sciences, Beijing 100049, China;
4 Center for Ocean Mega-Science, Chinese Academy of Sciences, Qingdao 266071, China
An understanding of stock structure is fundamental to fisheries management. A stock is an arbitrary group of fish that is sufficiently large to be essentially selfreproducing, with members showing similar life history characteristics (Hilborn and Walters, 1992). Various techniques have been applied to identify stocks, including mark-recapture techniques and the analysis of catch data, fish morphology, life history characteristics, otolith microchemistry and morphology, and genetics (Begg and Waldman, 1999). Otoliths are acellular concretions of inorganic salts (mainly calcium carbonate) over a protein matrix in the inner ears. They are metabolically inert and grow throughout the lifetime of the fish (Campana and Neilson, 1985). Otolith morphology analysis is a relatively inexpensive and time-efficient method that is frequently used for stock identification at wide range of scales (Castonguay et al., 1991; Campana and Casselman, 1993; Begg and Waldman, 1999; Tracey et al., 2006; Stransky et al., 2008; Avigliano et al., 2014; Zhang et al., 2016).
Morphometry (e.g., area, perimeter, length, width, and their derivative indices) and shape analysis (e.g., Fourier transform, wavelet transform, landmark, and curvature scale space representation) are two important aspects of otolith morphology analysis (Bolles and Begg, 2000; Monteiro et al., 2005; Parisi-Baradad et al., 2005; Avigliano et al., 2015; Zhang et al., 2017). The former can provide otolith growth information and identify biologically meaningful differences among groups, whereas the latter can provide a large amount of otolith shape information. The combination of these two methods can describe otolith morphology more accurately and often achieves better results in stock discrimination than either method individually (Petursdottir et al., 2006; Tracey et al., 2006; Agüera and Brophy, 2011; Ferguson et al., 2011). To date, otolith shape analysis has commonly been based on the outline of the whole otolith.
The sulcus, which is a longitudinal depression on the medial side of the otolith, is commonly divided into two sections: the ostium and the cauda (Tuset et al., 2008). The relative sulcus and otolith sizes are eco-morphological adaptations that often contribute to the sound sensitivity of the auditory system (Gauldie, 1988; Torres et al., 2000a). Several studies have attempted to combine sulcus morphometrics with otolith morphometrics to discriminate among stocks (Torres et al., 2000b; Avigliano et al., 2014, 2015; de Carvalho et al., 2015). However, sulcus morphology has not previously been used alone for stock discrimination. The sagittae of sound-sensitive fish, such as sciaenids, are often characterized by clear and regular sulcus structures, which makes sciaenids ideal target fishes for evaluating the feasibility and efficiency of sulcus morphology analysis in stock discrimination. Sulcus morphology analysis can provide extra information about the specific structure of otolith, which is complementary to the overall otolith morphology analysis for stock discrimination.
The yellow drum, Nibea albiflora, is an important demersal sciaenid that is widely distributed in Chinese coastal waters from the Bohai Sea southwards to the East China Sea. It generally spawns from early April to late May in Chinese coastal waters and forages nearby and then migrates and lives in deeper waters in the winter (Chen, 1991). Due to overfishing and habitat loss caused by land reclamation and water pollution in the past decades, the biological traits and ecological features of the yellow drum have been remarkably affected (Xu et al., 2012). Accordingly, the fishery resources of yellow drum have been continuously declining in these regions. For example, during the past decade, the annual catch of this fish decreased gradually from approximately 94 000 t in 2009 to 74 000 t in 2015 (Fisheries and Fisheries Administration of the Ministry of Agriculture, 2016). Therefore, government and fishery organizations must implement effective management to sustainably develop and maintain the yellow drum fishery in China.
To date, population structure on the yellow drum in Chinese waters, which is essential for fishery management, has not been well documented. It was suggested that there might be two major populations along the Chinese coast: a Bohai Sea-Yellow Sea population and an East China Sea population, and there might be subpopulations within the major populations along the Chinese coast (Han et al., 2008; Xu et al., 2012). In this study, three geographical groups of the yellow drum were discriminated using analyses of both otolith and sulcus morphology. In the analyses, stock discrimination was conducted using shape indices (SIs), the elliptic Fourier coefficients (EFc), and a combination of the two parameters. The main objective was to determine whether sulcus morphology can be a useful tool for stock discrimination and whether it can perform as efficiently as the commonly used otolith morphology. In addition, this study aimed to provide insight into the stock structure of the yellow drum and inform efforts to implement effective stock-based fishery management in Chinese coastal waters.
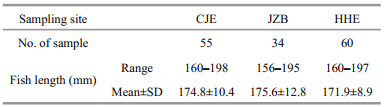
2 MATERIAL AND METHOD 2.1 Sample collection and study areaFish samples were collected via bottom trawling during a fishery survey of the Chinese coast. The sampling sites included the Huanghe (Yellow) River estuary (HHE) of the Bohai Sea, the Jiaozhou Bay (JZB) of the Yellow Sea, and the Changjiang (Yangtze) River estuary (CJE) of the East China Sea, all of which are yellow drum spawning areas (Fig. 1). In total, 149 specimens from the three sampling sites were used in this study (Table 1).

|
| Fig.1 Yellow drum sampling sites HHE: Huanghe River estuary; JZB: Jiaozhou Bay; CJE: Changjiang River estuary. |
The Changjiang River and the Huanghe River are the two longest rivers in China, discharging into the East China Sea and the Bohai Sea, respectively. The extensive influx of sand and mud from the rivers into the CJE and HHE contribute to the unique hydrology (e.g., chemical environment, temperature, salinity, and sediment) and biotic environments of these two estuarine areas (Chen, 2006). The JZB is a semiclosed bay characterized by relatively low exchange of sea water with the Yellow Sea. The aquatic environment of this bay has been markedly affected by human activities (e.g., large-scale reclamation, aquaculture, and industrial sewage discharge) during the past decades (Sun and Sun, 2011). Differences in latitude and water temperature likely contribute to the distinct niches of the three sampling sites. Therefore, yellow drum may experience different environmental conditions in these regions, which might lead to differences in life history traits, stock features or otolith morphology among the geographical groups.
2.2 Sample preparation and data acquisitionImmediately after capture, the fish were labeled and frozen for subsequent biological analysis, including otolith removal. In the laboratory, basic biology was determined and recorded. Sagittal otoliths were removed from each fish, cleaned of adhering tissue in distilled water, and stored dry in sealed glass vials until morphology analysis. Prior to imaging to collect the morphological measurements, the otoliths were rinsed in an ultrasonic cleaner, dried in an oven at 35℃, and then weighed to the nearest 0.01 mg.
Imaging was performed by positioning the medial side (the side with the sulcus) of each otolith facing up under a binocular microscope (Nikon SMZ1000, Tokyo, Japan) connected to a digital video camera (Fig. 2). ACT-2 software was used to capture the otolith images. All the images were captured at the same magnification (10 times). Next, the sulcus images were captured at 10 times magnification but at a different focal distance from that of the otolith images. Lighting conditions were adjusted to capture the clearest image of each sulcus. Because the contrast between the sulcus outline and the other regions of the otolith was not as distinct as that between the otolith outline and the black background, the sulcus was identified with the aid of Photoshop CS 5.0 (Adobe Systems Inc.). After the sulcus outline was identified, the sulcus region was painted white, and the other regions were painted black. To validate the determination of the sulcus outline with Photoshop CS 5.0, ten specimens were randomly selected to define the sulcus outline, which was repeated six times per specimen. Morphometrics (length, width, area, and perimeter) of these repetitions was performed, and the coefficients of variation (CV) were calculated according to the following formula: CV=(SD/Mean)×100%, where SD is the standard deviation. The CVs were small, ranging from 0.085% to 0.662%, demonstrating that the outline could be robustly defined.

|
| Fig.2 The left otolith and sulcus of a yellow drum (173 mm in fish length) The dashed line represents the outline of the sulcus. |
The images were imported into R (R Core Team; www.r-project.org) and evaluated using the shapeR package (Libungan and Pálsson, 2015) to generate four morphometrics (length, width, area, and perimeter) and the EFc of both the otoliths and the sulci. The length and width are the Feret diameters along the major and minor axes, respectively (Fig. 2). Then, SIs (formfactor, roundness, rectangularity, and ellipticity) were derived from the morphometrics (Tuset et al., 2003). The four SIs were calculated according to the following formulas:
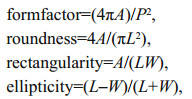
where A, P, L, and W are area, perimeter, length, and width, respectively.
Elliptic Fourier analysis was employed to analyze shape outlines because this type of analysis can be applied to complex curves (such as those exhibited by the otoliths and sulci of the yellow drum). Each elliptic Fourier harmonic has four EFc, and the EFc were automatically normalized based on the first three coefficients of harmonic 1 such that the EFc were invariant with respect to the rotation, dilation, and translation of the outline (Kuhl and Giardina, 1982). To determine the appropriate number of harmonics to adopt in the subsequent analyses, the Fourier power of each harmonic was calculated according to the following formula (Crampton, 1995):
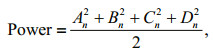
where An–Dn are four coefficients of the nth harmonic. The Fourier harmonics were truncated at the value of n when the cumulative power exceeded 99.9% of the total power. In this study, ten and nine harmonics were adopted in the subsequent analyses of the otolith and sulcus outlines, respectively.
2.3 Data analysisThe otolith and sulcus morphology data were subjected to the same analytical procedures.
First, the Kruskal-Wallis test was adopted to examine the size distribution of fish from each sampling site and between sexes. The Kruskal-Wallis test is a nonparametric test to examine whether the distributions of groups differ from each other. It is applicable when statistical assumptions (such as normality and homogeneity of variance) are violated. In the present study, the normality and homogeneity of length distributions among different sampling sites are violated. Therefore, the Kruskal-Wallis test was used instead of the analysis of variance. No significant difference was found among the sampling sites or between sexes.
Second, the effects of sex (male-female) or otolith position (left-right) on the parameters (SIs and EFc) of the otoliths and sulci were tested using analysis of covariance (ANCOVA) because sex or position might affect otolith and sulcus morphology, potentially confounding the discriminatory results for the stocks. Sex or position was the main factor, and fish length was a covariate. Before performing the ANCOVA, the Kolmogorov-Smirnov test and Levene's test were performed to examine normality and homogeneity of variance of the parameters (SIs and EFc), respectively. Parametric ANCOVA is robust to violation of either normality or homogeneity unless both assumptions are violated (Olejnik and Algina, 1984). All parameters met the normality assumption, and several parameters violated the homogeneity assumption. Therefore, all parameters were kept. These two tests (KolmogorovSmirnov and Levene's tests) were also performed before conducting ANCOVA in subsequent analyses.
Third, since the morphological variables must be invariant of fish size to be informative in discriminating among stocks, the effects of fish length on the parameters (SIs and EFc) were tested via ANCOVA. Sampling site was the factor, and fish length was the covariate. If a significant interaction was found, the corresponding coefficient was excluded from further statistical analyses because it could not be accurately adjusted (Begg and Brown, 2000). In this study, only EFc4b of otolith was excluded from subsequent statistical analysis because of the interaction of the factor and covariate observed for this parameter. Among the parameters selected for statistical analysis, those that were significantly influenced by fish length (roundness, four EFc of the sulcus and eight EFc of the otolith) were adjusted according to the allometric growth model (Lleonart et al., 2000):
 (1)
(1)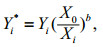 (2)
(2)where Eq.1 shows the regression between two variables. In Eq.2, Yi* is the adjusted parameter, Yi is the observed parameter (i.e., pre-adjustment), X0 is a selected standard fish length (i.e., the mean fish length of the samples, 173.8 mm in this study), Xi is the fish length of a specific specimen, and b is the regression coefficient between the log-transformed parameter and fish length. The regression slope, b, is a common within-group slope.
Fourth, since significant collinearity existed among the parameters (SIs and EFc), a principal component analysis (PCA) based on a variance-covariance matrix was performed to generate a new series of orthogonal variables, principal component scores (PCs), for subsequent canonical discriminant analysis (CDA) to discriminate among stocks (Næs and Mevik, 2001; Zhang and Dong, 2004; Agüera and Brophy, 2011). As a small number of PCs could explain most of the variance of the parameters, fewer variables would need to be adopted in the subsequent analyses. Scree plots were used to determine the number of adopted PCs.
Finally, the CDA was performed to test the accuracy of stock discrimination using the selected PCs. The CDA of each structure (otolith or sulcus) was performed three times, using SIs, EFc or a combination of the two parameters. The stepwise analysis was used in each CDA, and the classification success rates were generated based on leave-one-out crossvalidation. Since the sample size differed among groups, the prior probabilities were computed from group sizes. For each CDA, the homogeneity of the within-group covariance matrices was tested to determine the adoption of a linear (homogenous matrices; using pooled matrix) or quadric (heterogeneous matrices; using within-group matrices) model (Tuset et al., 2003).
Data processing and analysis were performed in SPSS 20.0 (IBM Corp, Armonk, NY) and SAS 9.4 (SAS Institute, Cary, NC). Differences were considered significant at P < 0.05.
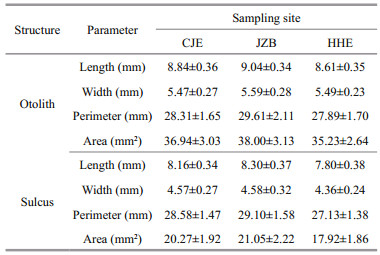
3 RESULTThe otolith and sulcus morphometrics of yellow drum from the three sampling sites are listed in Table 2. Sex or position did not significantly affect either the SIs or EFc of the otolith or sulcus (ANCOVA, P > 0.05 in all cases). Therefore, a total of 149 left otoliths from both sexes (68 males and 81 females) were used in the subsequent statistical analyses.
|
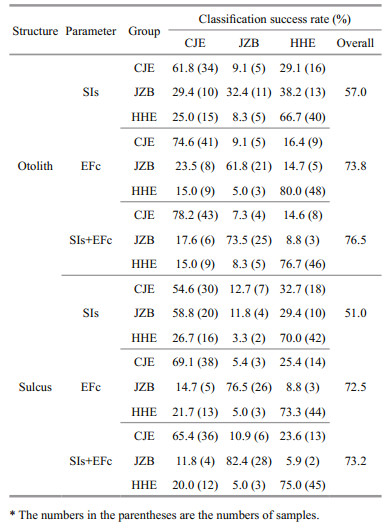
The variance explained by each PC and the contribution of each parameter to the PC are summarized in Appendix Tables A1 and A2. The prior probabilities of the CJE, JZB, and HHE groups were 36.9%, 22.8% and 40.3%, respectively. According to the test of the homogeneity of the within-group covariance matrices, a quadric model was adopted only for the CDA using otolith EFc, whereas linear models were applied for the other CDAs. The correlation coefficients between the discriminant functions and the adopted PCs in all CDAs are listed in Appendix Table A3. The CDA results for stock discrimination among the yellow drum groups using different parameters of otolith and sulcus morphology are summarized in Table 3 and shown in Fig. 3.
|

|
| Fig.3 Scatter plots of the two discriminant functions for the yellow drum groups using different morphology parameters of the otolith and sulcus a. otolith SIs; b. sulcus SIs; c. otolith EFc; d. sulcus EFc; e. otolith SIs and EFc; f. sulcus SIs and EFc. |
When using SIs alone, three PCs were generated via PCA, all of which were adopted in the CDA. The first canonical discriminant function (F1) explained 76.4% of the variance (eigenvalue, E=0.348) and could basically discriminate between the CJE and HHE groups. The F1 was closely correlated with PC3 (correlation coefficient, R=0.850) and PC2 (R=0.512). The second canonical discriminant function (F2) explained 23.6% of the variance (E=0.108). The F2 was closely correlated with PC2 (R=-0.676) and PC1 (R=0.669). However, both functions failed to discriminate the JZB group. The CDA produced an overall classification success rate of 57.0%, with the highest rate being obtained for the HHE group (66.7%), followed by the CJE (61.8%) and JZB (32.4%) groups. Over half of the JZB individuals (67.6%) were incorrectly assigned to the HHE and CJE groups. Most of the misclassified CJE and HHE individuals were assigned to each other.
When using EFc alone, nine PCs were generated via PCA, of which seven were adopted in the CDA. The F1 (E=0.781) was closely correlated with PC1 (R=0.652) and explained 74.8% of the variance, discriminating the HHE group from the other two groups well. The F2 (E=0.263) was closely correlated with PC2 (R=-0.643) and PC9 (R=0.541) and explained 25.2% of the variance, discriminating between the CJE and JZB groups well. The CDA produced an overall classification success rate of 73.8%, with the highest rate being obtained for the HHE group (80.0%), followed by the CJE (74.6%) and JZB (61.8%) groups. Most of the misclassified CJE and HHE individuals were assigned to each other.
When combining SIs and EFc, twelve PCs were generated via PCA, of which ten were adopted in the CDA. The F1 (E=1.014) was closely correlated with PC2 (R=0.736) and explained 63.9% of the variance, discriminating the HHE group from the other two groups well. The F2 (E=0.574) was closely correlated with PC3 (R=0.503) and PC11 (R=0.474) and explained 36.1% of the variance, discriminating between the CJE and JZB groups well. The CDA produced an overall classification success rate of 76.5%, with the highest rate being obtained for the CJE group (78.2%), followed by the HHE (76.7%) and JZB (73.5%) groups. Most of the misclassified CJE and HHE individuals were assigned to each other.
3.2 Stock discrimination by sulcus morphologyWhen using SIs alone, three PCs were generated via PCA, of which two were adopted in CDA. The F1 (E=0.254) was closely correlated with PC1 (R=0.864) and explained 94.1% of the variance, discriminating the HHE group from the other two groups well. The F2 (E=0.016) explained only 5.9% of the variance and was closely correlated with PC2 (R=0.864). However, both functions failed to discriminate between the CJE and JZB groups. The CDA produced an overall classification success rate of 51.0%, with the highest rate being obtained for the HHE group (70.0%), followed by the CJE (64.6%) and JZB (11.8%) groups. Almost all of the JZB individuals (88.2%) were incorrectly assigned to the HHE and CJE groups. Most of the misclassified CJE and HHE individuals were assigned to each other.
When using EFc alone, eight PCs were generated via PCA, of which seven were adopted in the CDA. The F1 (E=0.766) was closely correlated with PC4 (R=-0.687) and explained 67.1% of the variance, discriminating the JZB group from the other two groups well. The F2 (E=0.375) was closely correlated with PC1 (R=0.561) and PC2 (R=0.544) and explained 32.9% of the variance, discriminating between the CJE and HHE groups well. The CDA produced an overall classification success rate of 72.5%, with the highest rate being obtained for the JZB group (76.5%), followed by the HHE (73.3%) and CJE (69.1%) groups. Most of the misclassified CJE and HHE individuals were assigned to each other.
When combining SIs and EFc, ten PCs were generated via PCA, of which nine were adopted in the CDA. The F1 (E=0.808) was closely correlated with PC3 (R=-0.671) and explained 66.4% of the variance, discriminating the JZB group from the other two groups well. The F2 (E=0.408) was closely correlated with PC2 (R=-0.589) and PC1 (R=0.526) and explained 33.6% of the variance, discriminating between the CJE and JZB groups well. The CDA produced an overall classification rate of 73.2%, with the highest rate being obtained for the JZB group (82.4%), followed by the HHE (75.0%) and CJE (65.4%) groups. Most of the misclassified CJE and HHE individuals were assigned to each other.
4 DISCUSSIONIn contrast to the otolith morphology, which is widely used for stock discrimination (Castonguay et al., 1991; Campana and Casselman, 1993; Stransky et al., 2008; Libungan and Pálsson, 2015; Zhang et al., 2016), sulcus morphology has not previously been used alone for stock discrimination. Two recent studies combined otolith and sulcus morphometrics to discriminate among stocks of the silverside Odontesthes bonariensis and the croaker Plagioscion ternetzi and obtained modest classification rates (less than 70%; Avigliano et al., 2014, 2015). Additionally, Montanini et al. (2015) discriminated between red gurnard Aspitrigla cuculus and grey gurnard Eutrigla gurnardus by comparing the crystal structures of their sulci at different life stages. However, the feasibility and efficiency of sulcus morphology in stock discrimination has not been well evaluated. In the present study, analysis of both sulcus morphology and routine otolith morphology was conducted on three yellow drum groups to compare the performance of the two methods.
The present study revealed that, in morphological analyses of both the otolith and sulcus, the use of EFc either alone or in combination with morphometrics was more effective than the use of morphometrics alone in discriminating the three yellow drum groups. Similar results in otolith morphology analyses have been obtained in other species, such as Atlantic cod Gadus morhua (Petursdottir et al., 2006), striped trumpeter Latris lineata (Tracey et al., 2006), Atlantic saury Scomberesox saurus (Agüera and Brophy, 2011), and mulloway Argyrosomus japonicus (Ferguson et al., 2011). The morphometrics generally provided information on otolith growth and specified some biologically meaningful differences among the groups. However, the lack of sufficient morphological variables might have reduced the efficiency of morphometric and contributed to its relatively low overall classification success in stock discrimination. In contrast, EFc allowed the finer definition of the otolith outline and provided a large amount of information on otolith shape. Generally, lowerranking EFc describe general otolith shape, whereas higher-ranking EFc describe detailed characteristics (Kuhl and Giardina, 1982). Given that elliptic Fourier coefficients are sufficient, the otolith outline can be reconstructed and depicted in detail, which could improve the efficiency of stock discrimination.
Similar to otolith morphology, the analysis of sulcus morphology resulted in relatively high overall classification rates (particularly when using EFc or the combination of EFc and SIs) in the present study. These findings suggest that sulcus morphology can be used to discriminate among stocks of the yellow drum at levels comparable to those obtained using otolith morphology, although slightly lower overall classification rates were obtained with the former than with the latter. When depicting the sulcus outline during data acquisition, the contrast between the sulcus and the otolith was typically not as distinct as the contrast between the otolith outline and the background. Such lack of imaging contrast could cause the loss of some fine sulcus morphological information, which could affect the discriminatory efficiency. Therefore, practical methods should be developed in future studies to address this problem to improve the efficiency of sulcus morphology for stock discrimination.
To date, there have been few studies assessing the stock structure of yellow drum along the Chinese coast. It is generally assumed that two major populations potentially exist: a Bohai Sea-Yellow Sea population (northern population), from which the HHE and JZB samples of the present study were collected, and an East China Sea population (southern population), from which the CJE sample was collected. A recent genetic study detected small but significant genetic differentiation between the two populations (Han et al., 2008); the authors concluded that gene flow between the two populations might primarily occur during the long planktonic larval stage, which is promoted by the coastal currents of the Yellow Sea and the East China Sea. This flow might reduce the genetic differences between the two populations. However, genetic exchange during the adult stage was limited due to geographical segregation, which might have resulted in subpopulations within the two populations.
In the present study, both otolith morphology and sulcus morphology were useful for discriminating among the three yellow drum groups, implying that the three geographical groups are characterized by their own unique otolith and sulcus morphologies. Otolith morphology is mainly influenced by genetic and environmental factors (Cardinale et al., 2004; Vignon and Morat, 2010). In addition to the genetic differentiation of yellow drum along the Chinese coast as above mentioned, the environmental differences can also strongly influence otolith morphology. Water temperature, salinity, and biomass of benthos (the principal food for yellow drum) are different in three sampling sites (Chen, 2006; Li et al., 2010; Sun and Sun, 2011), which could affect the formation and growth of otoliths and thus lead to distinct otolith morphology of each group. The otolith morphology of the CJE group of the southern population could distinguish from the northern population, and the otolith morphologies of the HHE and JZB groups within the northern population could also distinguish between each other. These results are generally in agreement with the genetic conclusion that there were Bohai Sea-Yellow Sea population (northern population) and East China Sea population (southern population) (Han et al., 2008). These findings also support the view that there might exist subpopulations or geographically segregated stocks within the yellow drum populations (e.g., HHE stock and JZB stock within the northern population). Therefore, these stocks can be considered as different units for fishery management. However, further related studies covering all spawning areas of yellow drum are needed to achieve a comprehensive understanding of the stock structure along Chinese coast.
5 CONCLUSIONSulcus morphology alone is potentially useful for identifying different stocks of sciaenids, such as the yellow drum along the Chinese coast. In this study, sulcus morphology was used to classify geographic groups and yielded a success rate comparable to that obtained using the commonly used otolith morphology. When using either sulcus morphology or otolith morphology, EFc more efficiently discriminated among the stocks than SIs, and the combination of SIs and EFc improved the discriminatory efficiency over that obtained using either method alone. Since no studies have attempted to discriminate among stocks using sulcus morphology alone, additional studies will be necessary in the future to achieve a critical evaluation of the performance and efficiency of sulcus morphology analysis in stock discrimination.
6 DATA AVAILABILITY STATEMENTThe datasets during and/or analyzed during the current study available from the corresponding author on reasonable request.
7 ACKNOWLEDGMENTWe thank Dr. YU Xin, Ocean University of China, for his help in the statistical analysis.
Electronic supplementary material
Supplementary material (Appendix Tables A1–A3) is available in the online version of this article at https://doi.org/10.1007/s00343-019-8056-6.
Agüera A, Brophy D. 2011. Use of saggital otolith shape analysis to discriminate Northeast Atlantic and Western Mediterranean stocks of Atlantic saury, Scomberesox saurus saurus (Walbaum). Fish. Res., 110(3): 465-471.
DOI:10.1016/j.fishres.2011.06.003 |
Avigliano E, Comte G, Rosso J J, Mabragaña E, Rosa P D, Sanchez S, Volpedo A, del Rosso F, Schenone N F. 2015. Identification of fish stocks of river crocker (Plagioscion ternetzi) in Paraná and Paraguay rivers by using otolith morphometric analysis. Lat. Am. J. Aquat. Res., 43(4): 718-725.
|
Avigliano E, Martinez C F R, Volpedo A V. 2014. Combined use of otolith microchemistry and morphometry as indicators of the habitat of the silverside (Odontesthes bonariensis) in a freshwater-estuarine environment. Fish. Res., 149: 55-60.
DOI:10.1016/j.fishres.2013.09.013 |
Begg G A, Brown R W. 2000. Stock identification of haddock Melanogrammus aeglefinus on Georges Bank based on otolith shape analysis. Trans. Am. Fish. Soc., 129(4): 935-945.
DOI:10.1577/1548-8659(2000)129<0935:SIOHMA>2.3.CO;2 |
Begg G A, Waldman J R. 1999. An holistic approach to fish stock identification. Fish. Res., 43(1-3): 35-44.
DOI:10.1016/S0165-7836(99)00065-X |
Bolles K L, Begg G A. 2000. Distinction between silver hake (Merluccius bilinearis) stocks in U.S. waters of the northwest Atlantic based on whole otolith morphometrics. Fish. Bull., 98(3): 451-462.
|
Campana S E, Casselman J M. 1993. Stock discrimination using otolith shape analysis. Can. J. Fish. Aquat. Sci., 50(3): 1062-1083.
|
Campana S E, Neilson J D. 1985. Microstructure of fish otoliths. Can. J. Fish. Aquat. Sci., 42(5): 1014-1032.
DOI:10.1139/f85-127 |
Cardinale M, Doering-Arjes P, Kastowsky M, Mosegaard H. 2004. Effects of sex, stock, and environment on the shape of known-age Atlantic cod (Gadus morhua) otoliths. Can. J. Fish. Aquat. Sci., 61(2): 158-167.
DOI:10.1139/f03-151 |
Castonguay M, Simard P, Gagnon P. 1991. Usefulness of Fourier analysis of otolith shape for Atlantic mackerel (Scomber scombrus) stock discrimination. Can. J. Fish. Aquat. Sci., 48(2): 296-302.
DOI:10.1139/f91-041 |
Chen D G. 1991. Fish Ecology of the Bohai Sea and Yellow Sea. Ocean Press, Beijing. p.288-292.
(in Chinese)
|
Chen J S. 2006. Theories of River Water Quality and Water Quality of Chinese Rivers. Science Press, Beijing. p.103-168.
(in Chinese)
|
Crampton J S. 1995. Elliptic Fourier shape analysis of fossil bivalves:some practical considerations. Lethaia, 28(2): 179-186.
DOI:10.1111/let.1995.28.issue-2 |
de Carvalho B M, Vaz-dos-Santos A M, Spach H L, Volpedo A V. 2015. Ontogenetic development of the sagittal otolith of the anchovy, Anchoa tricolor, in a subtropical estuary. Sci. Mar., 79(4): 409-418.
DOI:10.3989/scimar.2015.79n4 |
Ferguson G J, Ward T M, Gillanders B M. 2011. Otolith shape and elemental composition:complementary tools for stock discrimination of mulloway (Argyrosomus japonicus) in southern Australia. Fish. Res., 110(1): 75-83.
DOI:10.1016/j.fishres.2011.03.014 |
Fisheries and Fisheries Administration of the Ministry of Agriculture. 2016. China Fisheries Yearbook. China Agriculture Press, Beijing. 45p.
(in Chinese)
|
Gauldie R W. 1988. Function, form and time-keeping properties of fish otoliths. Comp. Biochem. Physiol. A: Physiol., 91(2): 395-402.
DOI:10.1016/0300-9629(88)90436-7 |
Han Z Q, Gao T X, Yanagimoto T, Sakurai Y. 2008. Genetic population structure of Nibea albiflora in Yellow Sea and East China Sea. Fish. Sci., 74(3): 544-552.
DOI:10.1111/j.1444-2906.2008.01557.x |
Hilborn R, Walters C J. 1992. Quantitative Fisheries Stock Assessment: Choice, Dynamics, and Uncertainty. Chapman and Hall, New York. 67p.
|
Kuhl F P, Giardina C R. 1982. Elliptic Fourier features of a closed contour. Comput. Graph. Image Process., 18(3): 236-258.
DOI:10.1016/0146-664X(82)90034-X |
Li X Z, Liu L S, Li B Q. 2010. Macrobenthos in China Sea: Research and Practice. Ocean Press, Beijing. 378p.
(in Chinese)
|
Libungan L A, Pálsson S. 2015. ShapeR:an R package to study otolith shape variation among fish populations. PLoS One, 10(3): e0121102.
DOI:10.1371/journal.pone.0121102 |
Lleonart J, Salat J, Torres G J. 2000. Removing allometric effects of body size in morphological analysis. J. Theor. Biol., 205(1): 85-93.
DOI:10.1006/jtbi.2000.2043 |
Montanini S, Stagioni M, Valdrè G, Tommasini S, Vallisneri M. 2015. Intra-specific and inter-specific variability of the sulcus acusticus of sagittal otoliths in two gurnard species (Scorpaeniformes, Triglidae). Fish. Res., 161: 93-101.
DOI:10.1016/j.fishres.2014.07.003 |
Monteiro L R, Di Beneditto A P M, Guillermo L H, Rivera L A. 2005. Allometric changes and shape differentiation of sagitta otoliths in sciaenid fishes. Fish. Res., 74(1-3): 288-299.
DOI:10.1016/j.fishres.2005.03.002 |
Næs T, Mevik B H. 2001. Understanding the collinearity problem in regression and discriminant analysis. J. Chemom., 15(4): 413-426.
DOI:10.1002/cem.676 |
Olejnik S F, Algina J. 1984. Parametric ANCOVA and the rank transform ANCOVA when the data are conditionally nonnormal and heteroscedastic. J. Educ. Behav. Stat., 9(2): 129-149.
DOI:10.3102/10769986009002129 |
Parisi-Baradad V, Lombarte A, Garcia-Ladona E, Cabestany J, Piera J, Chic O. 2005. Otolith shape contour analysis using affine transformation invariant wavelet transforms and curvature scale space representation. Mar. Freshw. Res., 56(5): 795-804.
DOI:10.1071/MF04162 |
Petursdottir G, Begg G A, Marteinsdottir G. 2006. Discrimination between Icelandic cod (Gadus morhua L.) populations from adjacent spawning areas based on otolith growth and shape. Fish. Res., 80(2-3): 182-189.
DOI:10.1016/j.fishres.2006.05.002 |
Stransky C, Murta A G, Schlickeisen J, Zimmermann C. 2008. Otolith shape analysis as a tool for stock separation of horse mackerel (Trachurus trachurus) in the Northeast Atlantic and Mediterranean. Fish. Res., 89(2): 159-166.
DOI:10.1016/j.fishres.2007.09.017 |
Sun S, Sun X X. 2011. Atlas of Long-term Changes in the Jiaozhou Bay Ecosystem. Ocean Press, Beijing. 809p.
(in Chinese)
|
Torres G J, Lombarte A, Morales-Nin B. 2000a. Variability of the sulcus acusticus in the sagittal otolith of the genus Merluccius (Merlucciidae). Fish. Res., 46(1-3): 5-13.
DOI:10.1016/S0165-7836(00)00128-4 |
Torres G J, Lombarte A, Morales-Nin B. 2000b. Sagittal otolith size and shape variability to identify geographical intraspecific differences in three species of the genus Merluccius. J. Mar. Biol. Assoc. U. K., 80(2): 333-342.
DOI:10.1017/S0025315499001915 |
Tracey S R, Lyle J M, Duhamel G. 2006. Application of elliptical Fourier analysis of otolith form as a tool for stock identification. Fish. Res., 77(2): 138-147.
DOI:10.1016/j.fishres.2005.10.013 |
Tuset V M, Lombarte A, Assis C A. 2008. Otolith atlas for the western Mediterranean, north and central eastern Atlantic. Sci. Mar., 72(S1): 7-198.
|
Tuset V M, Lozano I J, González J A, Pertusa J F, García-Díaz M M. 2003. Shape indices to identify regional differences in otolith morphology of comber, Serranus cabrilla (L., 1758). J. Appl. Ichthyol., 19(2): 88-93.
DOI:10.1046/j.1439-0426.2003.00344.x |
Vignon M, Morat F. 2010. Environmental and genetic determinant of otolith shape revealed by a non-indigenous tropical fish. Mar. Ecol. Prog. Ser., 411: 231-241.
DOI:10.3354/meps08651 |
Xu D D, Lou B, Shi H L, Geng Z, Li S L, Zhang Y R. 2012. Genetic diversity and population structure of Nibea albiflora in the China Sea revealed by mitochondrial COI sequences. Biochem. Syst. Ecol., 45: 158-165.
DOI:10.1016/j.bse.2012.07.028 |
Zhang C, Fan Y N, Ye Z J, Li Z G, Yu H L. 2017. Identification of five Pampus species from the coast of China based on sagittal otolith morphology analysis. Acta Oceanol. Sin., 36(2): 51-56.
DOI:10.1007/s13131-017-0982-6 |
Zhang C, Ye Z J, Li Z G, Wan R, Ren Y P, Dou S Z. 2016. Population structure of Japanese Spanish mackerel Scomberomorus niphonius in the Bohai Sea, the Yellow Sea and the East China Sea:evidence from random forests based on otolith features. Fish. Sci., 82(2): 251-256.
DOI:10.1007/s12562-016-0968-x |
Zhang W T, Dong W. 2004. Advanced Tutorial for Statistical Analysis Using SPSS. High Education Press, Beijing. p.263.
(in Chinese)
|