 2019, Vol. 37
Institute of Oceanology, Chinese Academy of Sciences
Article Information
- HOU Huaqian, XIE Qiang, XUE Huijie, SHU Yeqiang, NAN Feng, YIN Yuqi, YU Fei
- Formation of an anticyclonic eddy and the mechanism involved: a case study using cruise data from the northern South China Sea
- Journal of Oceanology and Limnology, 37(5): 1481-1494
- http://dx.doi.org/10.1007/s00343-019-8275-x
Article History
- Received Oct. 19, 2018
- accepted in principle Dec. 17, 2018
- accepted for publication Feb. 18, 2019


2 Key Laboratory of Ocean Circulation and Wave Studies, Institute of Oceanology, Chinese Academy of Sciences, Qingdao 266071, China;
3 Institute of Deep-sea Science and Engineering, Chinese Academy of Sciences, Sanya 572006, China;
4 School of Marine Sciences, University of Maine, Orono 04469, Maine, USA;
5 Innovation Academy of South China Sea Ecology and Environmental Engineering, Chinese Academy of Science, Guangzhou 510301, China
The Luzon Strait separates the islands of Taiwan, China and Luzon and is the only very deep strait between the South China Sea (SCS) and the Western Pacific Ocean (WPO). Circulation in this area and throughout much of the SCS is strongly affected by the Kuroshio intrusion through the Luzon Strait (Nitani, 1972; Li and Wu, 1989; Qiu, 1992). Studies over the last three decades indicate that the Kuroshio intrusion is weak in summer before it strengthens from the beginning of the fall (Fan and Yu, 1981; Metzger and Hurlburt, 1996; Yaremchuk and Qu, 2004). Observations by Tian et al. (2006) also confirm the vertical "sandwich" structure of the Kuroshio intrusion with seasonal changes as documented by Hou et al. (2016). Kuroshio intrusions of different intensities strongly affect both SCS circulation and the formation of eddies in the northern SCS (Fan, 1982; Wang, 1986; Hu et al., 2000).
Three different mechanisms of eddy formation have been revealed (Wang and Chern, 1987a, b; Zu et al., 2013). The shedding of an anticyclonic eddy (AE) from the Kuroshio intrusion into the SCS was observed from data acquired in a cruise (Li et al., 1998). Eddies have been found to be shed from the looping path of the Kuroshio intrusion in studies using numerical models, satellite data, and data acquired in situ (Metzger and Hurlburt, 1996; Chen et al., 2011; Nan et al., 2011b). At the same time, it has been suggested that western Pacific Rossby waves have a role to play in the formation of eddies (Sheu et al., 2010; Zheng et al., 2011). Zheng et al. (2011) reported a mesoscale AE passing through the Luzon Strait and found that the mainstream Kuroshio intrusion behaved like an unsteady current that is frequently modified, causing cut-offs, meandering, and branching as it interacted with the eddy. Furthermore, local wind-stress curl has a nonnegligible effect on local circulation in the Luzon Strait (Yuan et al., 2007; Wang et al., 2008b). Wang et al. (2008b) used observations and models to show that wind jets through gaps among islands in the eastern SCS can promote the formation of eddies in winter. Yuan et al. (2007) found that the AE was facilitated by a southerly wind and minimal wind curl, and showed that this AE was generated to the northwest of the Luzon Strait rather than being shed from the Kuroshio intrusion in the Luzon Strait itself. These and other previous studies have thus shown that different eddies have different formation mechanisms.
The process of mixing in eddies during their movement has received barely any attention at all (Chen et al., 2009; Hsin, 2015), and it is still unclear whether there is any mixing between the water inside and outside an eddy as it migrates. It was previously shown that very little mixing occurs and that the characteristics of the water hardly vary at all (Shu et al., 2016b), although temperature-salinity (T-S) curves have indicated that the water in eddies shed from the Kuroshio intrusion has the same characteristics as mixtures of water from the SCS and the Western Pacific Ocean (Hsin, 2015; Zhang et al., 2016). To address the related knowledge gap, we herein investigate mixing and T-S variability associated with eddy generation in the northeastern SCS.
The remainder of the paper is organized as follows. In Section 2, we describe the cruise, satellite, and numerical model data, and explain the methods used to analyze the mechanism of eddy formation. The detailed characteristics and vorticity budget of the AE are discussed in Section 3, together with the mechanisms involved in the different stages of the process of AE formation and the origins of the water within it. The results are discussed further and some conclusions are drawn in Section 4.
2 DATA AND METHOD 2.1 Satellite and in situ observational dataSea surface height (SSH) data were acquired by the Copernicus Marine and Environment Monitoring Service before conversion to Archiving, Validation, and Interpretation of Satellite Oceanographic (AVISO) data (http://www.aviso.altimetry.fr/en/data.html). The spatial and temporal resolutions were 0.25° and 1 d, respectively. SSH data for March 5 to June 17, 2008 were used to track the AE (Fig. 1).

|
| Fig.1 The mean horizontal distribution of the SSH (AVISO) on April 12 and 13, 2014 after the investigation of the eddy and the locations of all the stations The stations are shown in different colors: red for the SCS water, blue for the eddy water, magenta for the eddy headstream water, and cyan for the Kuroshio intrusion water. The blue and magenta lines are the eddy tracks determined using the AVISO and HYCOM data, respectively, from March 5 to June 17. The color bar is the sea surface height in m. |
In-situ temperature and salinity data were obtained from 23 stations for April 2014 (Fig. 1). Data from five stations (d48, d49, d50, d93, and d92) were used to investigate the characteristics of the water inside the AE. Each station had a depth >1 500 m apart from station d49, which had a depth of 335 m. Data from four stations (d37–d40) were used to represent the characteristics of the SCS water, data from five stations (d60–d64) were used to represent the characteristics of water at 120°E, and data from six stations (d73–d78) were used to represent the characteristics of water in the northwestern Pacific Ocean. The vertical resolution of all the data was 1 m.
2.2 Data of the Hybrid Coordinate Ocean ModelThe Hybrid Coordinate Ocean Model (HYCOM) reanalysis dataset is supported by the National Ocean Partnership Program. The spatial temporal is 1/12°, and the data contain 32 vertical layers. By applying the "Navy Coupled Ocean Data Assimilation" method, the model was used to assimilate satellite data, in-situ sea surface temperature data, and in-situ vertical temperature and salinity data as acquired by expendable bathythermographs. The AE was also tracked using HYCOM SSH data of the period from March 5 to June 17, 2008 (Fig. 1). HYCOM data were also used for the period of March 5–18 to analyze the process of eddy formation by estimating the vorticity budget.
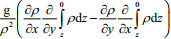
2.3 Vorticity budgetThe vorticity budget was estimated using the equation (Nan et al., 2011a)
 (1)
(1)where ζ is the relative vorticity, f is the planetary vorticity, ρ is the density, v=1.0×10⁻⁴ m2/s is the kinematic viscosity (Wallcraft et al., 2009; Nan et al., 2011b), and ∂ζ/∂t is the rate of change of relative vorticity. The term 


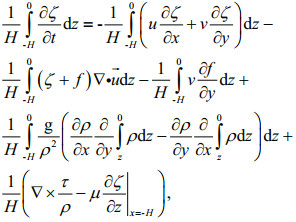 (2)
(2)where H is 500 m (the depth of the eddy) and τ is the wind stress. The vorticity diffusion term is derived from the diffusion term attributable to sea surface wind minus the term representing diffusion at the bottom of the eddy,
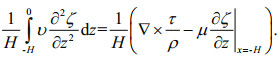 (3)
(3)The SSH distribution, the current field (from satellite data), and the locations of cruise stations across the AE for April 12 and 13, 2014 are shown in Fig. 1. The satellite data clearly indicate the AE at 21.5°N, 117.8°E. Five conductivity-temperaturedepth (CTD) stations (d92, d93, d50, d49, and d48) inside the AE were used. The current field indicates that the Kuroshio intrusion did not enter the SCS in this area and that the AE moved southwestward, confirming that the Kuroshio intrusion did not influence the southwestward movement of the AE at this time.
The distributions and variations in temperature and salinity derived from the in-situ data are shown in Fig. 2. The AE extended from 19.5°N to 21.5°N, and its effect on the local temperature and salinity anomalies are remarkable. As shown in Fig. 2, the AE had a depth of about 450 m, and the mean differences between the salinities and temperatures inside and outside the AE at the same depth were < 0.03 and < 0.5℃, respectively. The temperature at the center of the AE was almost 4℃ higher than the temperature of the water surrounding it at a depth of 100 m, where the difference was greatest. The salinity at the center of the AE was about 0.2 higher than the salinity of the water surrounding it at a depth of 150 m. The temperature maxima both inside and outside the AE were at the surface, and the mean surface temperature was 1℃ higher outside than inside the AE. The salinity maximum inside the AE was at a depth of almost 200 m, but outside the AE the salinity maximum was at a depth < 130 m. Cruise data reported in some studies indicate that AEs that form in the SCS have lower salinities and higher temperatures than the water outside the eddy (Chu et al., 2014), but other data indicate that AEs formed by the Kuroshio intrusion are warmer and more saline than those formed in SCS water (Chen et al., 2011; Zhang et al., 2016). The formation of the AE studied here was therefore probably induced by the Kuroshio intrusion in the 500 m nearest the surface.

|
| Fig.2 Vertical distributions of the temperature (a), salinity (b), temperature anomaly (c), and salinity anomaly (d) in the eddy (cruise data along 118°E from d45 to d50) The bottom of the AE is indicated by the gray line in (c) and (d). |
It is important to determine whether the Kuroshio intrusion was the only mechanism involved in the formation of the AE. A T-S diagram obtained using CTD data is shown in Fig. 3, and this illustrates the characteristics of the AE in more detail. The data used in Fig. 3 are the mean CTD data obtained from five stations (d48, d49, d50, d92, and d93). The Northwestern Pacific Ocean data are mean values obtained from a cruise along 122°E (d73–d78), and the SCS data are the mean CTD cruise data along 18°N (d37–d40). The CTD data along 120°E (d60–d64), where the AE was generated, are also shown for comparison with the data for the water inside the AE.

|
| Fig.3 Relationships between temperature and salinity in the transects 118°E, 120°E, 122.5°E, and 18°N (from 112°E to 115°E) The red line (transect at 18°N from d37 to d40) represents the SCS water, the blue line (transect 118°E from d48 to d50, d92, and d93) represents the eddy water, the magenta line (transect 120°E from d60 to d64) represents the eddy headstream water, and the cyan line (transect 122°E from d73 to d78) represents the Kuroshio intrusion water. The black lines in the background are isopycnals. Eddy and WPO observations to the north and south of the cruise data are also shown in the figure. The detail of the northern (d93, 21.75°N, 117.7°E), central (d50, 21.50°N, 118°E), and southern (d49, 21°N, 118°E) of the eddy and to the northern (d78, 22°N, 122.5°E), central (d76, 21°N, 122.5°E), and southern (d74, 20°N, 122.5°E) of the WPO are also shown. |
The water inside the AE was clearly different from the water elsewhere (Fig. 3), being neither from the Kuroshio intrusion nor from the SCS. There were several differences between the water in the AE forming area (along 120°E) and the water inside it. The water near the surface in the AE was less saline and cooler than the water along 120°E, whereas the deeper water in the AE (approximately 300–500 m) was more saline and warmer, suggesting that the water in the AE was not typical of the area, being a mixture of water from the Kuroshio intrusion and the SCS.
To allow further detailed comparisons to be made between the variability of the characteristics of the interior of the eddy and the water of the WPO, we included further CTD data in Fig. 3. Detailed temperature and salinity data from the northern side (d93, 21.75°N 117.7°E), central (d50, 21. 50°N 118°E), and southern side (d49, 21.75°N 117.7°E) of the eddy are shown in Fig. 3. Data from the northern (d78, 22°N 122.5°E), central (d76, 21°N 122.5°E), and southern side (d74, 20°N 122.5°E) of the WPO was also analyzed in detail. The water in the WPO was in fact relatively stable in that the temperature and salinity barely changed from south to north. At the same time, the variability of the water mass both inside and outside the eddy is considerable. The water in the southern part of the eddy region is closer to the characteristics of the water of the WPO, while the water in the north of the eddy has more in common with the water of the WPO in the upper 100 m approximately (23℃ isotherm at 21.5°N in Fig. 2), but is more like the SCS water below this depth.
3.2 The generationIn the previous section, we showed that the formation of the AE is influenced by the Kuroshio intrusion and local variations in circulation within the SCS. These local variations could have been caused by the Vietnam Offshore Current or other local variations in circulation within the SCS. The T-S curve for the AE was similar to that found previously (Jia et al., 2005; Wang et al., 2008a), but it remains unclear when and how the Kuroshio and SCS intrusions influence the AE. Some authors showed that the salinities and temperatures in the AE were lower after being shed from the Kuroshio intrusion and moving into the SCS (Chen et al., 2009; Zhang et al., 2016). This indicates that mixing occurs when an AE moves through the SCS. However, other researchers have shown that very little mixing occurs when an AE moves, meaning that the salinity hardly changes (Shu et al., 2016b).
The starting process (SP, March 5–18) is defined as the period during which the AE grew and moved slowly. SLAs and SSHs were obtained from the AVISO satellite data and used to investigate the constitution of the AE during the SP. The SLAs and SSHs on the day of maximum vorticity variation for each stage of the SP are shown in the left panes of Figs. 4 and 5. At the beginning of the SP (March 5–9), the Kuroshio intrusion is clear and there is a noticeable trend toward the formation of the AE, i.e., the eddy begins to form and the affected area increases according to the SSH data. The Kuroshio leap the SCS and intrusion decreased between March 10 and 18, but the AE continued to strengthen, its radius and velocity both increasing during this period. The behavior of the Kuroshio intrusion leads to the conclusion that the AE was induced and initially enhanced by it, before being strengthened by local variations in SCS circulation during the SP.

|
| Fig.4 The horizontal distributions of the AVISO SLAs (left) and HYCOM SLAs (right) on days of maximum vorticity variations The time of the eddy appearance is the most significant date of change in the eddy. The color bar is sea level anomaly in m. |

|
| Fig.5 Horizontal distributions of the AVISO SSHs (left) and HYCOM SSHs (right) on days of maximum vorticity variations The color bar is sea surface height in m. Time selection is as Fig. 4. |
The reanalysis data were used to verify and explain the conditions in the subsurface during the Kuroshio intrusion and the eddy formation. As mentioned above, the AE showed similar trajectories in both the AVISO and the HYCOM datasets (Fig. 1). Furthermore, the SSHs and SLAs obtained from the HYCOM data (right panes of Figs. 4 and 5) clearly indicate that the AE remained mostly in the same place, as also indicated by the AVISO data. Meanwhile, the SLA data inside the eddy reveal a maximum difference between the HYCOM and AVISO data of less than 0.059 m. The mean difference is just 0.026 m, which is less than one tenth of the highest SLA value. The reanalysis data captured the main characteristics of the AE very well. The locations of the AE as seen in these two datasets were similar, and the differences in the areas covered by the AE in the datasets were not sufficient to affect the conclusions drawn here.
The temperature and salinity distributions and the anomalies from the HYCOM data for the 118°E transect from 19.5°N to 21.5°N are shown in Fig. 6, in which the AE can clearly be seen. The in-situ and HYCOM data showed similar patterns, with warmer and more saline water in the same parts of the AE. Similar temperature and salinity differences were also found between the water inside and outside the AE. The differences between the CTD and HYCOM data are shown in Fig. 7. The mean difference in temperature was 0.10℃ inside the eddy, implying a higher temperature for the HYCOM data than observed. The average salinity difference was 0.036, with the HYCOM salinity being greater than observed. The possible cause of this phenomenon is that the eddy is likely to have more inflow from the South China Sea according to the HYCOM simulation. These differences do not affect our analysis, and we therefore, believe that the HYCOM data are reliable.

|
| Fig.6 The vertical distributions of the temperature (a), salinity (b), temperature anomaly (c), and salinity anomaly (d) in the eddy determined from the HYCOM data (118°E) |

|
| Fig.7 Vertical distributions of the temperature difference (a) and salinity difference (b) between the CTD and the HYCOM data in the eddy transect (118°E) A positive value signifies that the CTD value is greater than the HYCOM value. |
The HYCOM data and the vorticity equation were used to identify the contributions of the different factors to the formation of the AE. The factors involved were the absolute vorticity stretching term, the planetary vorticity advection term, the baroclinic contribution to the vorticity change term, the vorticity diffusion term for the bottom of the AE, and the term for vorticity diffusion caused by the wind. The SP was defined as the period during which the AE grew.
As mentioned above, the SP was March 5–18. Each term during the SP was calculated using Eq.1, and the results are shown in Fig. 8. The AE edge was defined approximately as the edge of a cylinder. The surface radial water had a mean velocity >0.1 m/s and the maximum depth had a mean velocity >0.1 m/s (Shu et al., 2014, 2016a, 2016b). The highest SSH was in the center of the AE.

|
| Fig.8 Time series for different terms (vorticity variation, vorticity advection, absolutely vorticity stretching, beta effect, baroclinic contribution, wind stress, and friction stress) in the vorticity equation (a); time series of the vorticity variation term and the two main terms (vorticity advection) and absolute vorticity stretching in the vorticity equation (b) |
The results of the vorticity equation indicate that the terms with the greatest effect on eddy growth were the planetary vorticity advection and the absolute vorticity stretching. These terms were one order of magnitude greater than the baroclinic contribution to the change in the vorticity term, and more than two orders of magnitude larger than the other terms. This leads to the conclusion that the AE formed due to planetary vorticity advection and absolute vorticity stretching.
The vorticity variations indicate three stages of development of the AE. The three-step nature of the development was determined by considering the eddy budget, which shows that each step has essentially the same eddy-promoting factor. The AE grew rapidly in the first (March 5–9) and third stages (March 13–18) but more slowly in the second stage (March 10–12), in which it retained most of its vorticity. The maximum change in vorticity was -10.362×10⁻¹²/s in the third stage, but the vorticity was < -7.103×10⁻¹²/s at other times (Table 1). The maximum variation and total contribution (mean variation in each stage multiplied by the period for each step) were larger in the third than in the first stage. Further details are given in Table 1.
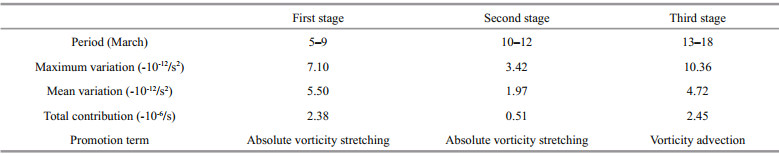
During the first and second stages of the SP, eddy growth was promoted by the absolute vorticity stretching term and inhibited by the vorticity advection term. The weakening of the absolute vorticity stretching term after March 9 resulted in a decreased variation in the vorticity. In conjunction with the AVISO and HYCOM SSH data (Fig. 5), the Kuroshio intrusion moved across the SCS which leads to the conclusion that the stretching weakened. During the Kuroshio intrusion itself (the first stage), the significant convergence caused by Kuroshio intrusion led to a high rate of eddy growth. Thereafter, the weakened intrusion limited the convergence and slowed down the eddy growth (the second stage). In the third stage, convergence changed to divergence before March 16, and the absolute vorticity stretching term suppressed eddy growth. However, at the same time, the vorticity advection term promoted eddy growth. The Kuroshio intrusion moved away from the AE between March 13 and 16; therefore, the vorticity budget was supplied only by the SCS. The vorticity advection changed from a preventative to a promoting term, and the absolute vorticity stretching term changed to a preventative term. After March 16, the absolute vorticity stretching term also became a promoting term. Both terms then promoted the AE, which grew fastest in the third SP stage.
In summary, during the Kuroshio intrusion period (the first stage of the SP), the absolute vorticity stretching term affected eddy growth the most, while the vorticity advection term limited it. The Kuroshio intrusion then moved away from the AE, and the convergence weakened. The absolute vorticity stretching term became weaker in the second stage and the AE grew very slowly. During the third stage, the vorticity advection term became limiting before changing back to promoting the AE. The AE grew fastest during this stage because the absolute vorticity stretching term as a preventative term is not strong enough. During the Kuroshio intrusion, the absolute vorticity stretching term was the only promoting term. After that, the promoting term(s) changed over time. Interestingly, the AE grew most rapidly when the Kuroshio leap SCS with intrusion moved away from the AE, rather than when the Kuroshio intrusion was in the vicinity.
The temperature and salinity structures cited here explain the cause of the phenomenon of the AE. The Kuroshio intrusion entered the South China Sea initially, bringing water with high temperature and salinity. The intrusion water caused the isothermal and isocratic surfaces to sink, and this sinking stretched the eddy at the same time. The SCS water then flowed into the eddy. In the absence of high temperature and high salinity water, the stretching process was weakened. Eddy growth was affected by the dynamics of the local circulation structure. The eddy budget results reveal that eddy growth was strongest during this period.
3.3 Evidence of mixingThere is a clear need for evidence in support of the theory that the Kuroshio intrusion is involved in the first stage of the SP but then becomes less important. By considering the velocity fields for the 120°E transect, and by water mass analysis, we investigated this effect, and the velocity fields along the 120°E transect are shown in Fig. 9. It is clear that the intrusion into the southern part of the AE (20.5°N–21.5°N) is conducive to eddy formation because it provides convergence in the anticyclonic direction. In the first stage of the SP, the Kuroshio intrusion was very strong throughout the transect. As discussed above, the formation of the AE was activated by the Kuroshio intrusion. The Kuroshio intrusion to the north of the AE then weakened and was only present to the south of the AE from March 10 to 12 (the second stage). The results of the vorticity equation (Fig. 8) indicate that the promoting term (the absolute vorticity stretching term) became weaker during this stage, meaning that the Kuroshio intrusion was no longer the main factor in the formation of the AE. In the final stage of the SP, the extent of the Kuroshio intrusion decreased further before finally disappearing altogether. However, the vorticity variation did not decrease, and the vorticity advection remained the main term influencing the AE. Variations in circulation within the SCS are more complex than the Kuroshio intrusion; therefore, the promoting term became unstable. The AE strengthened most rapidly in the final stage, even in the absence of the Kuroshio intrusion (Fig. 9).

|
| Fig.9 Vertical distributions of the velocity in the 120°E section (HYCOM data) |
Ocean mixing can also be used to prove that the AE was induced and initially enhanced by the Kuroshio intrusion but then strengthened by variations in SCS circulation. The effects of local mixing on the formation of the AE and spatiotemporal variations in the T-S curves inside the AE were assessed by dividing it into four boxes representing the northwest, northeast, southwest, and southeast quadrants (Fig. 5, right pane). The mean T-S curves for the four boxes during the SP are shown in Fig. 10. The mean temperature and salinity were calculated for each 3-d period, in an attempt to simplify the figure and illustrate the trend. The Kuroshio intrusion contained warmer and saltier water than the SCS, thus a Kuroshio intrusion eddy has a high salinity and a high temperature. If our assumptions are reasonable, at the beginning of the SP the southeastern parts of the AE must be the first to have high salinity and temperature. The Kuroshio intrusion then influences the southwestern, northwestern, and northeastern parts (i.e., in a clockwise manner). In the final stage, water with SCS characteristics influences the AE in a clockwise manner. The SCS water decreases the temperature and salinity of the AE clockwise from the southwestern part.

|
| Fig.10 Relationships between the temperature and salinity in the northwestern, northeastern, southwestern, and southeastern parts of the eddy |
As shown in Fig. 10, the maximum temperature and salinity were not reached in the final SP stage. Instead, the maxima occurred in the southeastern part between March 7 and 9, in the southwestern part between March 13 and 15, and in the northwestern part between March 16 and 18. The maxima in the northeastern part were too small to identify. The salinity and temperature varied in ways similar to the suggestion made in the previous paragraph. This provided further evidence for variations in SCS circulation in the study area influencing eddy formation at the end of this stage; indeed, this phenomenon was clear in the southern part of the AE. In the northwestern quadrant, the phenomenon was rather less clear, however. The T-S curve changed little during the final SP stage, and the maximum T-S slope was found in the northwestern quadrant. This provides evidence that during the process of eddy formation the mixing originated in the southeastern quadrant of the AE. The AE was anticyclonic, and mixing within it was slow. Strong T-S curves were found between March 7 and 9 on the eastern side of the AE, indicating that the Kuroshio intrusion had an effect during this stage of formation of the AE.
4 DISCUSSION AND CONCLUSIONThe SCS Western Boundary Current flows along the southeastern Vietnamese coast, before turning eastward to form an offshore current (Fang et al., 2012). Evidence for this current was first seen in figures published by Dale (1956) and Wyrtki (1961), and it was first identified from hydrographic observations and termed the Southeast Vietnam Offshore Current by Fang and Fang (1998). The Vietnam Offshore Current moves to the east of the SCS and northward along the west coast of Luzon Island. Local variations in the Vietnam Offshore Current along the west coast of Luzon Island are the main source of seawater mixing in the last stage of the SP, as also indicated by the AVISO data (Fig. 5). Hu et al. (2012) used cruise data to show that Kuroshio water intruded into the SCS and formed an eddy to the southwest of Taiwan, China. However, these observations do not provide sufficient evidence for the contribution of this or other currents to the formation of the AE. Other methods must be considered in future studies to allow the contributions of different currents in the SCS to be identified.
The cruise, satellite, and HYCOM reanalysis data provide a novel perspective regarding the formation of an AE to the southwest of Taiwan, China. Shipbased data combined with satellite SSH data indicate that the AE extended from 20.5°N to 22°N and was 450 m deep. The water at the center was 4 ℃ warmer and 0.2 more saline than the water outside the AE. The maximum salinity within the AE was at almost 200 m depth, much deeper than outside the AE. The T-S curves compared with CTD data from the same cruise indicated that the water in the AE had characteristics that differed from those of the Kuroshio intrusion water, the SCS water, and the water in which the AE formed. We therefore conclude that the AE water was a mixture of Kuroshio intrusion and SCS water.
The vorticity budget was used to improve our understanding of the eddy mixing process and the generation of the AE. The satellite and HYCOM data indicate that the Kuroshio intrusion first promoted the AE (from March 5 to 9). The eddy then became stronger through local variations in SCS circulation (from March 10 to 18). The vorticity budget inside the AE area, determined using the HYCOM data, suggests that the vorticity advection term and the absolute vorticity stretching term had the strongest effects on eddy growth; these terms are more than one order of magnitude larger than the others. Vorticity variations indicate that eddy growth during the SP (March 5–18) can be considered in three separate stages. The AE strengthened during the first (March 5–9) and the final (third) stage (March 13–18). The absolute vorticity stretching term strengthened the AE during the first two stages, and the vorticity advection term strengthened the AE during the third stage. During the third stage, both the absolute vorticity stretching term and the vorticity advection term promoted eddy growth, and growth was fastest on March 17. This means that by then variations in circulation within the SCS were more important than the Kuroshio intrusion. During the second stage, the absolute vorticity stretching term became smaller and almost balanced the advection term, and the AE grew only slowly. Therefore, by combining the AVISO and HYCOM SSH data, it was possible to show that the movement of the Kuroshio intrusion away from the eddy caused a weakening of the absolute vorticity stretching term.
The satellite and HYCOM data were used to identify the initial mixing time, but further evidence was required to understand the mixing in the AE. Two other methods were therefore used. First, the velocity fields along the transect at 120°E were used to identify variations in the Kuroshio intrusion. The AE was promoted by the Kuroshio intrusion only during the first stage (March 5–9), as observed in the predominantly westward velocity along the transect. This westward velocity had weakened considerably by the third stage, showing that the effect of the Kuroshio intrusion had disappeared by then, even though the variability of the vorticity remained very strong. This provided evidence of variation in SCS circulation, rather than Kuroshio intrusion, in the promotion of eddy growth during this period.
Secondly, the T-S curves for the four quadrants of the AE also allowed the progress of mixing in the AE to be investigated. Having entered the AE from the southeast, the Kuroshio intrusion provided more saline and warmer water than that of the SCS, and the T-S curves thus indicate the progress of the eddy formation during the SP. The maximum salinity and temperature occurred between March 9 and 11 in the southeastern quadrant, between March 11 and 15 in the southwestern, and between March 15 and 18 in the northwestern quadrant. On the southern side, the water became more and then less saline, indicating that the growth of the AE was not influenced by the Kuroshio intrusion in the final stage of the SP. This was more remarkable in the southern than the northern half of the AE, indicating that the SCS intrusion was strongest to the south.
5 DATA AVAILABILITY STATEMENTThe datasets generated and analyzed during the current study are available from the corresponding author on reasonable request.
6 ACKNOWLEDGMENTWe would like to thank anonymous reviewers for their helpful comments and suggestions that improved the manuscript.
Chen G X, Hou Y J, Chu X Q, Qi P, Hu P. 2009. The variability of eddy kinetic energy in the South China Sea deduced from satellite altimeter data. Chin. J. Oceanol. Limnol., 27(4): 943-954.
DOI:10.1007/s00343-009-9297-6 |
Chen G X, Hu P, Hou Y J, Chu X Q. 2011. Intrusion of the Kuroshio into the South China Sea, in September 2008. J.Oceanogr., 67(4): 439-448.
DOI:10.1007/s10872-011-0047-y |
Chu X Q, Xue H J, Qi Y Q, Chen G X, Mao Q W, Wang D X, Chai F. 2014. An exceptional anticyclonic eddy in the South China Sea in 2010. J. Geophys. Res. Oceans, 119(2): 881-897.
DOI:10.1002/2013JC009314 |
Dale W L. 1956. Wind and drift current in the South China Sea. Malay. J. Trop. Geogr., 8: 1-31.
|
Fan K L, Yu C Y. 1981. A study of water masses in the seas of southernmost Taiwan. Acta Oceanogr. Taiwan, 12: 94-111.
|
Fan K L. 1982. A study of water masses in Taiwan Strait. Acta Oceanogr. Taiwan, 13: 140-153.
|
Fang G H, Wang G, Fang Y, Fang W D. 2012. A review on the South China Sea western boundary current. Acta Oceanol.Sin., 31(5): 1-10.
DOI:10.1007/s13131-012-0231-y |
Fang W D, Fang G H. 1998. The recent progress in the study of the southern South China Sea circulation. Adv. Earth Sci., 13(2): 166-172.
(in Chinese with English abstract) |
Hou H Q, Xie Q, Chen G X, He Y K, Shu Y Q, Priyadarshana T, Yao J L, Wang D X. 2016. Observed inter-annual variability of volume transport at 120°E transect in northeastern South China Sea. Oceanol. Limnol. Sin., 47(1): 36-42.
(in Chinese with English abstract) |
Hsin Y C. 2015. Multidecadal variations of the surface Kuroshio between 1950s and 2000s and its impacts on surrounding waters. J. Geophys. Res. Oceans, 120(3): 1 792-1 808.
DOI:10.1002/2014JC010582 |
Hu J Y, Kawamura H, Hong H S, Qi Y Q. 2000. A review on the currents in the South China Sea:seasonal circulation, South China Sea warm current and Kuroshio intrusion. J.Oceanogr., 56(5): 607-624.
|
Hu J Y, Zheng Q A, Sun Z Y, Tai C K. 2012. Penetration of nonlinear Rossby eddies into South China Sea evidenced by cruise data. J. Geophys. Res. Oceans, 117(C3): C03010.
DOI:10.1029/2011JC007525 |
Jia Y L, Liu Q Y, Liu W. 2005. Primary study of the mechanism of eddy shedding from the Kuroshio bend in Luzon Strait. J. Oceanogr., 61(6): 1 017-1 027.
DOI:10.1007/s10872-006-0018-x |
Joe W, Chern C S. 1988. On the Kuroshio branch in the Taiwan Strait during wintertime. Prog. Oceanogr., 21(3-4): 469-491.
DOI:10.1016/0079-6611(88)90022-5 |
Li L, Nowlin W D Jr, Su J L. 1998. Anticyclonic rings from the Kuroshio in the South China Sea. Deep Sea Res. I Oceanogr. Res. Pap., 45(9): 1 469-1 482.
DOI:10.1016/S0967-0637(98)00026-0 |
Li L, Wu B Y. 1989. A Kuroshio loop in South China Sea? -On circulations of the north-eastern South China Sea. J.Oceanogr. Taiwan Strait, 8(1): 89-95.
(in Chinese with English abstract) |
Metzger E J, Hurlburt H E. 1996. Coupled dynamics of the South China Sea, the Sulu Sea, and the Pacific Ocean. J.Geophys. Res. Oceans, 101(C5): 12 331-12 352.
DOI:10.1029/95JC03861 |
Nan F, He Z G, Zhou H, Wang D X. 2011a. Three long-lived anticyclonic eddies in the northern South China Sea. J.Geophys. Res. Oceans, 116(C5): C05002.
DOI:10.1029/2010JC006790 |
Nan F, Xue H J, Chai F, Shi L, Shi M C, Guo P F. 2011b. Identification of different types of Kuroshio intrusion into the South China Sea. Ocean Dyn., 61(9): 1 291-1 304.
DOI:10.1007/s10236-011-0426-3 |
Nitani H. 1972. Beginning of the Kuroshio. In: Stommel H, Yoshida K eds. Kuroshio: its Physical Aspects. University of Tokyo Press, Tokyo. p.129-163.
|
Qiu B. 1992. Recirculation and seasonal change of the Kuroshio from altimetry observations. J. Geophys. Res.Oceans, 97(C11): 17 801-17 811.
DOI:10.1029/92JC01792 |
Sheu W J, Wu C R, Oey L Y. 2010. Blocking and westward passage of eddies in the Luzon Strait. Deep Sea Res. Ⅱ Top. Stud. Oceanogr., 57(19-20): 1 783-1 791.
DOI:10.1016/j.dsr2.2010.04.004 |
Shu Y Q, Xiu P, Xue H J, Yao J L, Yu J C. 2016b. Gliderobserved anticyclonic eddy in Northern South China Sea. Aquat. Ecosyst. Health Manage., 19(3): 233-241.
DOI:10.1080/14634988.2016.1208028 |
Shu Y Q, Xue H J, Wang D X, Chai F, Xie Q, Yao J L, Xiao J G. 2014. Meridional overturning circulation in the South China Sea envisioned from the high-resolution global reanalysis data GLBa0.08. J. Geophys. Res. Oceans, 119(5): 3 012-3 028.
DOI:10.1002/2013JC009583 |
Shu Y Q, Xue H J, Wang D X, Xie Q, Chen J, Li J, Chen R Y, He Y K, Li D N. 2016a. Observed evidence of the anomalous South China Sea western boundary current during the summers of 2010 and 2011. J. Geophys. Res.Oceans, 121(2): 1 145-1 159.
DOI:10.1002/2015JC011434 |
Tian J W, Yang Q X, Liang X F, Xie L L, Hu D X, Wang F, Qu T D. 2006. Observation of Luzon Strait transport. Geophys. Res. Lett., 33(19): L19607.
DOI:10.1029/2006GL026272 |
Wallcraft A J, Metzger E J, Carroll S N. 2009. Software Design Description for the Hybrid Coordinate Ocean Model(HYCOM) Version 2.2. Naval Research Laboratory, p.13-15.
|
Wang D X, Xu H Z, Lin J, Hu J Y. 2008a. Anticyclonic eddies in the northeastern South China Sea during winter 2003/2004. J. Oceanogr., 64(6): 925-935.
DOI:10.1007/s10872-008-0076-3 |
Wang G H, Chen D K, Su J L. 2008b. Winter eddy genesis in the eastern South China Sea due to orographic wind jets. J. Phys. Oceanogr., 38(3): 726-732.
DOI:10.1175/2007JPO3868.1 |
Wang J, Chern C S. 1987a. The warm-core eddy in the northern South China Sea, I. Preliminary observations on the warm-core eddy. Acta Oceanogr. Taiwan, 18: 92-103.
(in Chinese with English abstract) |
Wang J, Chern C S. 1987b. The warm-core eddy in the northern South China Sea, Ⅱ. A simple mechanism for the establishment and development of the warm-core eddy. Acta Oceanogr. Taiwan, 18: 104-113.
(in Chinese with English abstract) |
Wang J. 1986. Observation of abyssal flows in the Northern South China Sea. Acta Oceanogr. Taiwan, 16: 36-45.
|
Wyrtki K. 1961. Physical Oceanography of the Southeast Asian Waters. University of California, San Diego.
|
Yaremchuk M, Qu T D. 2004. Seasonal variability of the largescale currents near the coast of the Philippines. J. Phys.Oceanogr., 34(4): 844-855.
DOI:10.1175/1520-0485(2004)034<0844:SVOTLC>2.0.CO;2 |
Yuan D L, Han W Q, Hu D X. 2007. Anti-cyclonic eddies northwest of Luzon in summer-fall observed by satellite altimeters. Geophys. Res. Lett., 34(13): L13610.
DOI:10.1029/2007GL029401 |
Zhang Z W, Tian J W, Qiu B, Zhao W, Chang P, Wu D X, Wan X Q. 2016. Observed 3D structure, generation, and dissipation of oceanic mesoscale eddies in the South China Sea. Sci. Rep., 6: 24349.
DOI:10.1038/srep24349 |
Zheng Q A, Tai C K, Hu J Y, Lin H Y, Zhang R H, Su F C, Yang X F. 2011. Satellite altimeter observations of nonlinear Rossby eddy-Kuroshio interaction at the Luzon Strait. J.Oceanogr., 67(4): 365-376.
DOI:10.1007/s10872-011-0035-2 |
Zu T T, Wang D X, Yan C X, Belkin I, Zhuang W, Chen J. 2013. Evolution of an anticyclonic eddy southwest of Taiwan. Ocean Dyn., 63(5): 519-531.
DOI:10.1007/s10236-013-0612-6 |