 2019, Vol. 37
Institute of Oceanology, Chinese Academy of Sciences
Article Information
- WU Zaixing, YU Zhiming, SONG Xiuxian, CAO Xihua, YUAN Yongquan
- Application and comparison of two symptom-based eutrophication-assessment methods in Jiaozhou Bay, China
- Journal of Oceanology and Limnology, 37(5): 1582-1594
- http://dx.doi.org/10.1007/s00343-019-8099-8
Article History
- Received Jun. 20, 2018
- accepted in principle Oct. 8, 2018
- accepted for publication Dec. 25, 2018


2 Laboratory of Marine Ecology and Environmental Science, Qingdao National Laboratory for Marine Science and Technology, Qingdao 266237, China;
3 Center for Ocean Mega-Science, Chinese Academy of Sciences, Qingdao 266071, China;
4 University of Chinese Academy of Sciences, Beijing 100049, China
Coastal eutrophication has become a worldwide environmental and social-economic problem in recent decades. Anthropogenic activities have been found responsible for accelerated fluxes of nutrients into aquatic systems (Nixon, 1995) and "cultural eutrophication" (Downing and McCauley, 1992) in coastal areas. Typical symptoms of eutrophication include harmful algal blooms (HABs), as well as high concentrations of chlorophyll a (Chl-a), high levels of organic material, overgrowth of seaweed, anoxia or hypoxia, and losses of submerged aquatic vegetation (Boynton et al., 1982; Burkholder et al., 1992; Hallegraeff, 1993). These problems may indirectly affect human health and create heavy economic losses (Anderson et al., 2000).
Coastal eutrophication management has thus become a critical issue. Assessment has been proved to be an important and effective tool in determining the scope, magnitude, and severity of eutrophication (Devlin et al., 2011). Various assessment methods that use eutrophication-related indicators have been used to characterize the degree of oligotrophy and eutrophication (reviewed by Kitsiou and Karydis, 2011). These include the Oslo-Paris Commission (OSPAR) Common Procedure (CP) (OSPAR Commission, 2003), the assessment of estuarine trophic status (ASSETS) (Bricker et al., 2003), and the Water Framework Directive (WFD) (Council of European Communities, 2000). These methods focus on the indicators of ecological and biological effects (symptoms of eutrophication), and some of them use more than one category of biological indicators (for example, primary and secondary biological impacts in ASSETS; and direct and indirect effects in OSPAR). In contrast to nutrient-based assessments, they are all symptom-based assessment that can reduce the misrepresentation of a system. Misrepresentation often occurs in a nutrient-based assessment because nutrient concentrations are not necessarily robust descriptors of eutrophication in coastal waters, especially in estuarine systems (Cloern, 2001; Bricker et al., 2003).
China has been confronted with serious coastal eutrophication in recent years. Industrialization and urbanization have resulted in a substantial increase in nutrient concentrations in estuaries and coastal areas, and these have stimulated phytoplankton growth (Shen 2001). Simultaneously, HABs and red tides have become frequent along Chinese coastlines (Huang et al., 2003). Eutrophication has been reported from north to south, including the Changjiang (Yangtze) River estuary; the East China Sea; Daya Bay and Beibu Gulf in the South China Sea (Yu et al., 2011; Lai et al., 2014; Wu et al., 2016). However, nutrient-based methods are most frequently used in assessing the trophic status of coastal waters. This is simply because, in a modern monitoring system, many ecological and biological indicators (macroalgae, submerged aquatic vegetation, etc.) are not monitored. The indices include the eutrophication index (the EI method by Zou et al., 1983) and the nutrient quality status index (the NQI method by Chen, 1987); both of them used dissolved inorganic nitrogen (DIN), dissolved inorganic phosphorus (DIP), and chemical oxygen demand (COD) as the main indicators. It is essential to apply a symptombased eutrophication-assessment method suitable to Chinese cases. ASSETS has often been applied in China (Xiao et al., 2007; Xu, 2012; Lai et al., 2014; Wu et al., 2016). The OSPAR CP has been used in Liaodong Bay and Qingduizi Bay, Liaoning, in northeastern China, and scored the two bays as "potential problem area" and "problem area", respectively (Zhang et al., 2009; Zhao, 2010).
In addition to the direct application of well-known eutrophication-assessment methods, some methods suitable for the regional-specific environmental and ecological conditions of China have been proposed, based on modifications to ASSETS and OSPAR CP. Yu et al. (2011) modified ASSETS (Bricker et al., 2003) and described an integrated symptom-based eutrophication-assessment method (hereafter: the integrated method) suitable for the Changjiang River estuary. In these modifications, the multi-parameters of both water quality and ecological response were considered to reflect the status of the ecosystem, and the criteria used to classify ecological responses were modified and designed with particular reference to China's National Seawater Quality Standard (NSQS, 1997). Wu et al. (2013) applied the integrated method to the southwestern Bohai Sea after minor modifications were made to the indicators and their thresholds (e.g., spatial coverage was added to HAB duration and frequency, and total phytoplankton abundance was added to dinoflagellate cell abundance). The special monitoring and Coastal Environment Assessment Regional Activity Center (CEARAC), one of the four centers of the Northwest Pacific Action Plan (NOWPAP), an intergovernmental organization under the United Nations Environment Programme (UNEP), developed NOWPAP Common Procedure (NOWPAP CPNOWPAP CEARAC, 2009).
In this study, the integrated method (including both water quality and ecological response) was compared with NOWPAP CP. Observation data from Jiaozhou Bay were used to compare the two methods in evaluating trophic status. We anticipated that the comparison would help to improve the current methodology. Eutrophication assessment is key to eutrophication management, and helps to provide policy makers with insights into the scope and magnitude of eutrophication, the environmental conditions, and the course of eutrophication. We believe that the assessment results from these two symptom-based methods may have important implications for guidance to the eutrophication management of Jiaozhou Bay.
2 MATERIAL AND METHOD 2.1 Study area and data for assessmentJiaozhou Bay (Fig. 1) is located in the South Yellow Sea. It is a typical temperate bay with a temperature range of 2–28℃. In spring, tides are high, reaching 4.2 m with strong turbulent mixing. The average period of water exchange with the open sea is about 12.5 days (Yang et al., 2013). The average salinity is around 32. Some small rivers flow into the bay, mainly from the north and east, and the total discharge is about 2×10⁹ m3/a Jiaozhou Bay covers an area of 390 km2 and has an average water depth of 7 m. It is a semi-enclosed bay and is connected to the South Yellow Sea only through a narrow opening in the south, which is 2.5 km wide. The annual precipitation is about 740 mm; summer season (June to August) is the rainy season and the rainfall accounts for more than 60% of the annual total (Han, 2013).

|
| Fig.1 Location of Jiaozhou Bay and sampling sites |
We chose Jiaozhou Bay as a study case area for eutrophication assessment mainly because its geographic position allowed it to fall into the scope of NOWPAP. It is a typical coastal ecosystem and one of the most studied in China. Human activities that significantly affect the ecosystem include aquaculture, seaport, and wastewater input. Several rivers flow into Jiaozhou Bay, and among them, the Haibo River carries the largest annual DIN load into the bay (about 3 024 t in 2001, accounting for 39% of the total riverine DIN load), followed by the Dagu River in the north (about 2 295 t/a; Zhang and Sun, 2007). Intensive marine aquaculture has been developed inside the bay; Manila clam (Ruditapes philippinarum) aquaculture, for example, has a large production of 200 000 t/a (Zhou et al., 2006). It is believed that there is top-down control in the Jiaozhou Bay ecosystem (removal of phytoplankton or Chl-a by filtering water in the bay) produced by shellfish aquaculture (Han and Wang, 2001).
To assess the trophic status of Jiaozhou Bay, nutrients including DIN (e.g., nitrate, nitrite, and ammonium), DIP, COD, Chl-a, and dissolved oxygen (DO) were collected from the Jiaozhou Bay Marine Ecosystem Station, which belongs to the Chinese Academy of Sciences. The station has been monitoring the bay for several decades. Data from 1997 to 2009 were collected from observations and publications (Sun and Sun, 2011; Sun et al., 2011). At least four seasonal cruises were made in the bay in February, May, August, and November, to represent spring, summer, autumn, and winter data. Seven sampling sites were placed inside the bay or in the inner bay, rather than at the mouth or outside the bay (Fig. 1). Their deployment took into account the geographical and chemical location (e.g., river estuary, sewage discharge, or aquaculture area). HABs or red tide data were obtained from the Bulletin of Marine Environmental Quality of Qingdao and Shandong Province (Shandong and Qingdao Ocean and Fishery Administration, 1997–2001). Data on phytoplankton abundance and bottom DO were obtained from previous studies (Xiao et al., 2007; Wang et al., 2013; Wu et al., 2014), and riverine DIN and DIP loads in NOWPAP CP from published papers (Zhang and Sun, 2007; Wang, 2009).
Analyses of water quality and biological parameters were conducted following China's national standard methods on marine monitoring specification (GB 17378.4-1998) and marine investigation specification (GB/T 12763.4-2007).
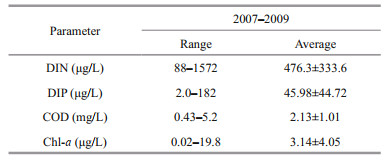
NOWPAP CP used annual average values from 3 recent years (in this study from 2007 to 2009) for "status" assessment and long-term years of data for "trend" assessment (see Section 2.2.2). To make the results more comparable, the assessment data from all four seasons in 2007–2009 (representing "status" assessment) were used by the integrated method for assessing trophic status. In the case of Jiaozhou Bay, the winter DIN and DIP were recommended by NOWPAP CP but the annual average DIN and DIP were used. The simple reason for this was that winter nutrients were not the highest of the four seasons and could underrepresent the trophic status of the bay. The average concentrations and ranges of DIN, DIP, COD, and Chl-a in Jiaozhou Bay are presented in Table 1.
|
The integrated method used both causative indicators (water quality) and effect indicators (ecological response) for assessment of trophic status. The method has been described in detail by Yu et al. (2011) and Wu et al. (2013). Some methodology rationales of the integrated method were adapted from ASSETS (e.g., the stepwise decision logic, combination matrix, and threshold of DO). To accommodate regional coastal environmental conditions, the indicators and thresholds were designed according to China's national seawater quality standard and previous studies.
The water quality indicators included DIN, DIP, and COD, while ecological response included primary (Chl-a, and macroalgae and phytoplankton abundance) and secondary (DO, HABs, or red tides) ecological responses.
Before the calculation of trophic status, a physical sub-division according to the salinity of the waterbody was made (salinity < 0.5, salinity>0.5, salinity < 25, and salinity>25), which provided a consistent basis for comparisons of coastal systems at different geographical locations (NOAA, 1985). For the assessment concentrations of each indicator, a percentile-based approach (10th percentile for DO and 90th for other indicators) was used to avoid extremely high or low values. For each indicator score, inclusion of assessment concentrations, spatial coverage, frequency, and duration in the stepwise decision logic helped to more accurately capture the scope and magnitude of an eutrophication incident. Based on the salinity zones, an area-weighted score was then obtained for each indicator. Next, ratings of water quality and primary ecological response were calculated by averaging their respective indicators, while ratings of secondary response were determined by the lowest score of indicators (DO and HABs). This gave the secondary response a higher weight because it represented well-developed eutrophication stages (Bricker et al., 2003; Devlin et al., 2011).
Results of primary and secondary responses were combined into a total ecological response through a combination matrix, and then the final overall trophic rating was obtained by combining water quality rating and ecological rating through 23 possible combinations. The final overall rating fell into one of five grades and five colors: high (best, blue), good (green), moderate (yellow), poor (orange), and bad (red).
2.2.2 The NOWPAP CPThe NOWPAP CP is a method designed by NOWPAP CEARAC for the assessment of eutrophication status in the coastal areas of the NOWPAP region (NOWPAP CEARAC, 2009) (http://www.cearac-project.org/cearac-project/integrated-report/eut_2011.pdf). This method was modified from OSPAR CP and used a two-step process, in common with OSPAR CP: the screening procedure and the CP. In the screening procedure, the eutrophication status was preliminarily assessed to detect symptoms of eutrophication (occurrence of hypoxia or anoxia, high frequency of red tide or HAB events, and high levels of Chl-a), while the CP could be skipped if no symptoms of eutrophication were detected in the screening step.
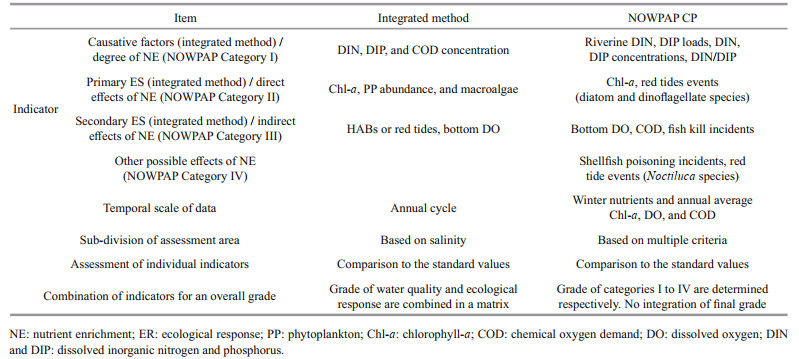
The CP comprised four assessment categories. Category Ⅰ reflected the degree of nutrient enrichment, which was determined by nutrient load and concentrations. Category Ⅱ showed the direct effects of nutrient enrichment, determined by Chl-a (both annual maximum and mean values), and red tide events of diatom and dinoflagellate species. Category Ⅲ indicated the indirect effects of nutrient enrichment, determined by DO, fish kill incidents, and COD. Category Ⅳ took into account other possible effects of nutrient enrichment, determined by shellfish poisoning incidents and red tide events of Noctiluca species. NOWPAP CP differed from OSPAR CP in that the eutrophication status of each parameter was identified by comparing the assessment values at each sampling site (instead of percentile-based values) to designated reference values obtained from a national standard or eutrophication study (above or below the reference values for the majority of sampling sites), instead of exceeding the reference values by 50%. For sub-division of areas, NOWPAP CP was based on multiple criteria of geographic location, sampling sites, and salinity, instead of a single criterion of salinity.
Another main difference from OSPAR CP was that the eutrophication status in NOWPAP CP was identified by both the status (above or below the reference) and trend (increase, decrease, or no trend) of each indicator (Fig. 2). The status of each indicator was rated as one of the following six scores: high and increase (HI), high but no trend (HN), high but decrease (HD), low but increase (LI), low and no trend (LN), and low and decrease (LD) (Fig. 2). The parameters of nutrient loads were evaluated via the trend only, and then the final status was classified as "decrease", "increase", or "no trend".

|
| Fig.2 The rating of eutrophication status by NOWPAP CP |
In common with OSPAR CP, the classification of status in NOWPAP CP was determined for each category but no "one out, all out" principle was applied. The status of each category was determined by status of parameters that were most representative. In addition, no final classification of eutrophication status was determined by integration of the four category ratings (Ⅰ–Ⅳ).
2.2.3 Comparison of the two assessment methodsBoth the integrated method and NOWPAP CP are symptom-based multi-parameter eutrophication methods; water column nutrients indicators were, however, not excluded (Table 2). Nutrients were considered to be causative factors of eutrophication, even though concentrations did not always necessarily correlate with biological symptoms (Cloern, 2001).
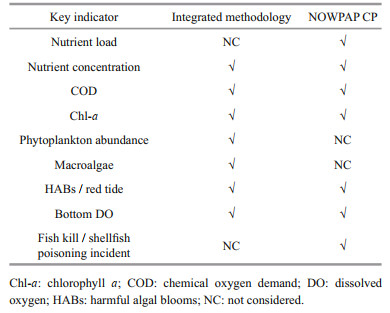
COD, Chl-a, HABs/red tide, and DO were the common indicators adapted in the two methods, in addition to nutrient concentrations. Phytoplankton abundance and macroalgae were used in the integrated method only, while nutrient loads, ratio of DIN and DIP, and fish kill/shellfish poisoning incidents were only included in NOWPAP CP. More specific HABs or red tide species (diatom, dinoflagellate, and Noctiluca species) in NOWPAP CP were classified in detail, to indicate different stages and degree of ecological effects (NOWPAP CEARAC Report 2009). Another main difference was that the COD in the integrated method was used as a causative indicator, while in NOWPAP CP it was an indirect effect of nutrient enrichment (Table 3). In China, the discharge of organic material is usually accompanied by discharge of nutrients, indicating the degrees of human pressure or contributions to coastal water quality and eutrophication. Thus, data availability means that COD was used as a causative factor in the integrated method instead of biochemical oxygen demand (BOD), although the latter might be a better indicator reflecting these contributions. In addition, COD was selected as an indicator of category Ⅲ in NOWPAP CP, for the simple reason that a series of biochemical reactions caused by nutrient enrichment included phytoplankton growth and subsequent increase in COD.
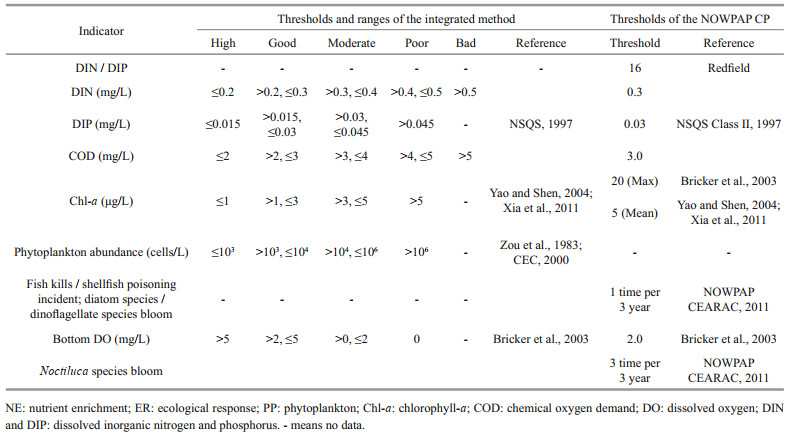
Unlike winter nutrients, which were used in NOWPAP CP, all other indicators covered multiseasonal sampling of data to avoid biased results due to limited seasonal data (Devlin et al., 2011). NOWPAP CP used annual average data for most recent three years for status assessment, and the integrated method used annual data from all indicators. Both methods allowed the sub-division of assessment area to assess the trophic status at smaller spatial scales. In NOWPAP CP, the assessment values at each sampling site (instead of the percentile-based values used in the integrated method) were compared with the reference values. After obtaining scores of individual indicators by comparing values to the thresholds (Table 4), the grades of water quality and ecological response were obtained by averaging or selecting the maximum indicators in the integrated method. In NOWPAP CP, the grades of categories Ⅰ–Ⅳ were obtained by selecting the most representative status of indicators. The thresholds of COD, DIN, and DIP in both methods were based on China's National Seawater Quality Standard (NSQS, 1997). Phytoplankton abundance was specified according to previous research in Chinese coastal regions and the EU WFD (Zou et al., 1983; CEC, 2000). Criteria for mean Chl-a was specified according to previous eutrophication studies in these areas (Yao and Shen, 2004; Xia et al., 2011). Reference was made to Bricker et al. (2003) for maximum Chl-a in the NOWPAP CP, and for setting the DO threshold. Bloom events, fish kill incidents, and shellfish poisoning incidents were considered "high" as long as one or three events have occurred in most recent three years (NOWPAP CEARAC, 2011).
For assessment results, the main difference was that there was no final integration of overall grades after obtaining the grades of the four categories in NOWPAP CP, which may lead to poor comparability between different assessment areas. Both assessment methods generated a certain degree of current trophic status in their results. In addition to "status", NOWPAP CP contained a "trend" assessment, which provided a vision of the long-term changes in eutrophication conditions. The trend analysis was carried out by nonparametric Mann-Kendall test (Salmi et al., 2002).
3 RESULTNo sub-division of the assessment area was obtained in either assessment, since all sampling sites were located inside Jiaozhou Bay and the median values of salinity at each sampling site were above 25 (Sun and Sun, 2011).
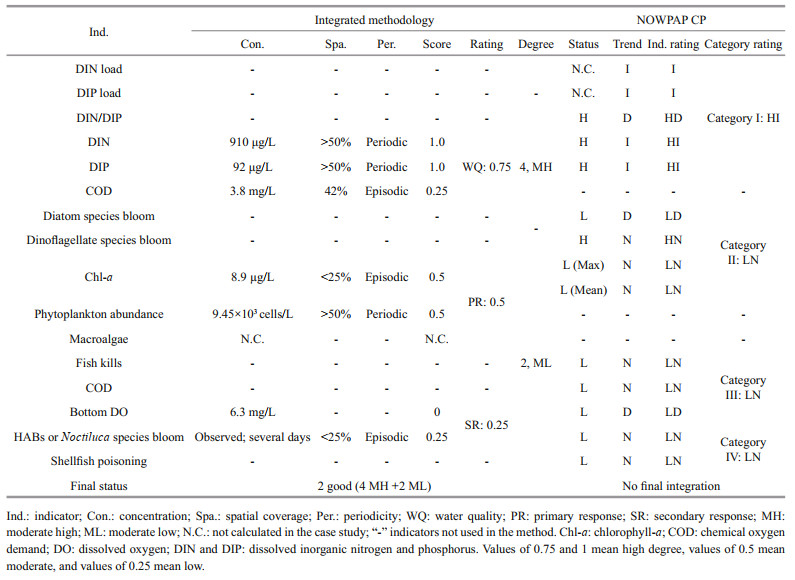
There are five assessment categories (high to bad) for the overall results of the integrated method and no overall integrated results for the NOWPAP CP. However, though no direct comparison of the final overall rating of trophic status, detailed comparison can be made between the individual parameters, different categories of problems, such as nutrient enrichment problem and ecological response to nutrient enrichment, which would improve comparability of the two methods. Detailed results and comparisons are shown for Jiaozhou Bay to illustrate the calculations behind the outcome in Table 5. Jiaozhou Bay exhibited an overall trophic status of "2, good" based on the integrated method, indicating quite a good condition. The rating for water quality was "moderate high", indicating quite a high degree of problematic enrichment (reflected by nutrients). Compared with water quality, the rating of ecological response was relatively lower. The secondary ecological response (rating of "low" a score of 0.25) mediated the "moderate" rating of primary ecological response (a score of 0.5), resulting in a "moderate low" degree of ecological response. Although providing no overall integration of trophic status, NOWPAP CP was able to reflect two kinds of eutrophication conditions: nutrient enrichment problems, and the ecological effects of nutrients, similar to the water quality and ecological response in the integrated method. The outcome indicated that the degree of nutrient enrichment (category Ⅰ) was "high and increasing", while the effects of nutrient enrichment (categories Ⅱ–Ⅳ) were all "low and no trend".
|
Specifically, considering individual indicators, nutrient enrichment (DIN and DIP) in Jiaozhou Bay was obvious, with the highest scores of "1.0" for DIN and DIP in the integrated method and all indicating "high" status in NOWPAP CP. The 90th percentile DIN value and status (left-hand graph in Fig. 3), and DIN trend (right-hand graph in Fig. 3) provide examples of calculations for indicators in each method. The spatial coverage of DIN and DIP indicated that pollution conditions varied in different parts of the bay, and a large proportion of Jiaozhou Bay was confronted with nutrient enrichment (spatial coverage was more than 50%). This may also be reflected by the fact that assessment concentrations of DIN and DIP in a majority of sampling sites were higher than the reference line in NOWPAP CP (Fig. 3, right-hand graph).

|
| Fig.3 DIN 90th percentile value (910 μg/L) in the years 2007–2009 (left), and DIN status and trend in seven sites in the years 1997–2009 with a high and increasing trend (right) in Jiaozhou Bay |
It seemed that COD was not a problem because high values were occasionally monitored in only a few sites. The scores for Chl-a were both "low" considering indicators of both the maximum and mean values in NOWPAP CP. The 90th percentile of Chl-a fell into the "poor" range (8.9 μg/L; see Table 5), based on a relatively strict Chl-a threshold of ">5.0 μg/L as poor" in the integrated method. However, a final score of 0.5, which was considered reasonable, was obtained for Chl-a (see Table 5), considering that high concentrations occurred occasionally (but not periodically) only in the northeastern part in summer 2008. The phytoplankton abundance inner the Jiaozhou Bay was not a problem in one year period, according to investigation in the year 2007 (Wu et al., 2014) and 2010 (Wang et al., 2013). The 10th percentile value for bottom DO was about 6.3 mg/L according to previous research into Jiaozhou Bay (Xiao et al., 2007; Wu et al., 2014), indicating that neither method identified DO as a problem. HABs or red tide events emerged frequently from 1998 to 2004 (one to two blooms per year in most years—many located in the northern and northeastern shallow parts) and began to decrease sharply after 2004. Only one red tide event, of Heterocapsa sp., was recorded in the inner bay in 2008. The score for HABs was, therefore, low (0.25) in the integrated method when frequency and spatial coverage were considered. The rating for red tide was "high" in NOWPAP CP owing to the "one event per 3 years" criterion. Neither incidents of shellfish poisoning nor abnormal fish kills were observed or reported in the inner Jiaozhou Bay so they were both rated as "low".
4 DISCUSSIONTo improve comparability, this study used the same temporal-scale data for both methods. With same assessment data, the methodological design of the assessment model will determine the final assessment results. Our analysis suggested that the greatest similarities between the two methods were in the design of the symptom-based indicators. They both used indicators of both nutrient enrichment and its ecological effects in the methodological design to represent eutrophication. The methodological design of the two techniques also indicated that the currently dominant eutrophication assessment based on nutrients only was partial and may bias the actual trophic status in certain circumstances, because the methodological design ignored the ecological effects. In the case of Jiaozhou Bay, considering nutrients only would lead to a high degree of eutrophication status of the bay.
Both methods treated eutrophication as a dynamic, developing process instead of a static state, and divided the problem into different stages according to the severity of their ecological effects. The primary/ secondary ecological response in the integrated method and the direct/indirect effect in NOWPAP CP reflected the development and different stages of eutrophication well. It is quite reasonable considering that Chl-a concentrations in a bay were sometimes high, but further HAB development or hypoxia could be restricted, since they belong to different stages of eutrophication process. In Jiaozhou Bay, assessment values of Chl-a concentrations and phytoplankton abundance were high, but no further hypoxia or fish kill events were observed. The two assessment models we used were quite similar to the application of ASSETS to Jiaozhou Bay, in which the bay was rated as having "high" (the best) status, in spite of the high rating of nutrient inputs (Xiao et al., 2007). In their assessment using ASSETS, though human nutrient influencing factor was the most serious degree, Chl-a level, DO and HABs were considered to be low and no problem due to the low susceptibility of Jiaozhou Bay. Though there were no susceptibility analyses in either of the methods in our study, we found that Jiaozhou Bay was less sensitive to nutrient inputs. It may be possible to attribute this to the system-specific susceptibility of the bay, as discovered by Xiao et al. (2007). In addition, both methods suggested that individual indicators should be assessed by considering the spatial difference (the spatial heterogeneity of sampling sites) in their methodological design. This may be essential, especially in studies of relatively large areas. Yao and Shen (2004) and Xia et al. (2011) pointed out that eutrophication conditions in different parts of Jiaozhou Bay were quite different because of the hydrodynamic conditions, the location of river mouths, and the aquaculture. The trophic status of the inner Jiaozhou Bay could easily be misrepresented through the use of limited sampling sites, or simply by averaging values, without considering the spatial information of each indicator.
The main difference in the methodological design of the two assessments focused on: (1) the final integration of eutrophic status (the scores (1–5) in the integrated method clearly show environmental managers the status and severity of the problem, so assisting policy decisions); (2) trend analysis. NOWPAP CP shows managers clear increasing or decreasing trends of the problem, which is very important in evaluating the effectiveness of implementing management practice; and (3) spatial coverage and frequency of HAB events. These were both considered in the integrated method, but only frequency was considered in NOWPAP CP. Clear results were obtained in the HAB event assessment in the Jiaozhou Bay case study: the integrated method rated the HAB event as "low" (a score of 0.25) in respect of both spatial and temporal factors, while NOWPAP CP rated it as "high", considering frequency only (a criterion of one event in 3 recent years). The rating of the majority of ecological effects (the most representative one) determined the rating of that category in NOWPAP CP, while the most severe one represented the rating of secondary response in the integrated method. In the Jiaozhou Bay case study, one HAB event (the most severe one) determined the rating of secondary ecological response in the integrated method, while this HAB event indicator was ignored in its category in NOWPAP CP (because the "high" degree of the HAB event was not the representative rating in that category). The weighting in the integrated method was more reasonable, because, in the case of simultaneous "high" ratings and "low" ratings in NOWPAP CP, it is difficult to determine the final rating of that category.
In our comparison of the assessment methods, no latest sampling data were obtained or used in this research. Nevertheless, the results have indicated one specific characteristic of the trophic status of Jiaozhou Bay: obvious nutrient pressure but no severe ecological effects. This discovery verified the phenomenon that coastal systems are different from those in the terrestrial freshwater system. Cloern (2001) has pointed out that system-specific attributes act as a "filter" in coastal systems, determining the sensitivity and response of a system to nutrient inputs. Both methods have indicated that the ecological effects were not too severe under the high pressures of nutrient enrichment, probably owing to systemspecific attributes of Jiaozhou Bay that constrained the ecological response to nutrient enrichment. Several aspects of the system-specific attributes of Jiaozhou Bay can be considered: water depth, hydrodynamic conditions and turbidity, flushing time, marine aquaculture conditions (including fish cage culture and shellfish industry), coastal engineering, and shipping conditions. The way the system-specific attributes constrained the ecological response to nutrient enrichment in Jiaozhou Bay is considered below.
For system-specific attributes of Jiaozhou Bay, hydrodynamic modeling (Liu, 2004) has indicated that the speed of the tidal current in the bay mouth can reach 90 cm/s, and there were more than four eddy currents in the inner Jiaozhou bay. The strong current and relatively shallow water (average 7 m) resulted in a good hydraulic mixing in the inner bay, which may have prevented the system from significant problems with hypoxia. There were few HABs or red tides after the year 2004. Xiao et al. (2007) pointed out that topdown control by shellfish aquaculture has a potentially significant effect in reducing the expression of eutrophication symptoms. This is reasonable in Jiaozhou Bay, considering the large-scale shellfish (R. philippinarum) biomass (Zhou et al., 2006). This is also observed in other systems (Shastri and Diwekar, 2006; Ferreira et al., 2007). The frequent emergence of blooms between 1998 and 2004 and sharp decrease after 2004 might have been due to two other factors: (1) HABs or red tides have been recorded frequently in bays where marine fish cages are densely arranged, such as Haizhou Bay (Zhou, 2008), Sam Sing Bay (Tang and Lai, 2003), Xiangshan Bay, and Daya Bay (Zhao et al., 2003) in China. Urea and amino acids produced by marine fish cage culture could be easily absorbed by phytoplankton and can then cause a red tide (Fan et al., 2003). The peak of red tide events in Jiaozhou Bay coincided with the trend in marine fish cage culture in the bay. Production peaked at around 1 400 t/a from 2000 to 2004 and then decreased to below 1 000 t/a in 2009. Shellfish aquaculture has maintained high annual production of 0.35– 0.4 million t/a (Wang, 2009). Although there is no direct evidence, the decrease in red tides after 2004 may be owing to a decrease in fish cage culture and the maintenance of high-biomass shellfish aquaculture in the bay; (2) turbidity, which affects the occurrence of red tides in nearshore waters, rose after 2004, probably owing to some new coastal engineering; in particular, the construction of the world's longest bridge in the shallow northern part of Jiaozhou Bay. Field investigation into suspended particulate matter (SPM) conducted in Jiaozhou Bay has also supported this premise. Data from August 1997 and 1998 showed that average SPM concentrations in the surface layers were only 2.2–7.9 mg/L according to investigation by Zhang (2000). During August 2005, however, these concentrations increased to 12– 17.4 mg/L, with highest concentrations observed in the shallow, northern nearshore part, where HABs frequently occurred before 2004 (Bi et al., 2007). Under such complex system-specific circumstances, instead of judging trophic status merely on nutrient concentrations, a symptom-based eutrophicationassessment method was needed to avoid biased assessment results.
After application of the two eutrophicationassessment methods, the results indicated that the ecological response of Jiaozhou Bay to nutrient enrichment may be attributed to carefully scaled introduction of filter feeders. This proved to be a costeffective way to mitigate eutrophic conditions and has been implemented in eutrophication management in coastal systems (Shastri and Diwekar, 2006; Ferreira et al., 2007). In Jiaozhou Bay, in addition to the control and reduction of nutrient inputs, we should keep in mind that maintaining a reasonable scale of shellfish aquaculture within the carrying capacity of Jiaozhou Bay may be a useful strategy. Overall, both the integrated method and NOWPAP CP have some uncertainties when they provide an implication on eutrophication assessment, in which no future outlook was considered in the model design. They all belong to a kind of assessment focusing on status. So future outlook will not be evaluated. In other words, the final management plan should be in accordance with the future developing trend of the bays. If nutrient pressure decreases in the future, eutrophication policies could be more conservative; otherwise, they should be more rigorous. In addition, this is the point these two methods should improve and consider future outlook in the future.
5 CONCLUSIONEutrophication assessment is the key point in eutrophication management, because it provides us with pictures of the scope and magnitude of nutrientrelated problems. The application of the integrated method and NOWPAP CP to Jiaozhou Bay resulted in similar assessment results, indicating that nutrient enrichment was serious within the bay but that the ecological effects were acceptable because of the sensitivity of Jiaozhou Bay to nutrients. We suggest: (1) above all, that nutrient input into the bay should be reduced; at present this is the most outstanding problem; and (2) that shellfish aquaculture should be kept at a reasonable and ecologically tolerable scale. We believe the trophic status and environmental conditions will improve in future.
6 DATA AVAILABILITY STATEMENTSome data in this study are from published data, as stated above in the Materials and Methods section. Some data that support the findings of this study are available from Jiaozhou Bay Ecosystem Monitoring Station. Restrictions apply to the availability of these data, which were used under license for the current study, and are not publicly available. Data are, however, available from the authors upon reasonable request and with permission of Jiaozhou Bay Ecosystem Monitoring Station.
7 ACKNOWLEDGEMENTThe authors thank the Jiaozhou Bay Ecosystem Monitoring Station for providing the observation data. We thank Liwen Bianji, Edanz Editing China (www.liwenbianji.cn/ac), for editing the English text of a draft of this manuscript.
Anderson D M, Hoagland P, Kaoru Y, White A W. 2000.Estimated Annual Economic Impacts from Harmful Algal Blooms (HABs) in the United States. Woods Hole Oceanographic Institute Technical Report, WHOI-2000-11.
|
Bi L L, Bai J, Zhao Z S, Li Y G, Yuan Z W. 2007. Characteristics of suspended particles in summer in Jiaozhou Bay. Mar.Environ. Sci., 26(6): 518-522.
(in Chinese with English abstract) |
Boynton W R, Kemp W M, Keefe C W. 1982. A comparative analysis of nutrients and other factors influencing estuarine phytoplankton production. In: Kennedy V S ed.Estuarine Comparisons. Academic Press, New York.p.69-90.
|
Bricker S B, Ferreira J G, Simas T. 2003. An integrated methodology for assessment of estuarine trophic status. Ecol. Model., 169(1): 39-60.
|
Burkholder J M, Noga E J, Hobbs C H, Glasgow Jr H B. 1992. New nphantomo dinoflagellate is the causative agent of major estuarine fish kills. Nature, 358(6385): 407-410.
DOI:10.1038/358407a0 |
Chen Y W. 1987. Analysis of trophic status in Xiamen coastal seas. Mar Environ Sci., 6(3): 14-19.
|
Cloern J E. 2001. Our evolving conceptual model of the coastal eutrophication problem. Mar. Ecol. Prog. Ser., 210: 223-253.
DOI:10.3354/meps210223 |
Council of European Communities (CEC). 2000. Directive 2000/60/EC of the European Parliament and of the Council of 23 October 2000 establishing a framework for community action in the field of water policy. Off. J. Eur.Commun., L327: 1-73.
|
Devlin M, Bricker S, Painting S. 2011. Comparison of five methods for assessing impacts of nutrient enrichment using estuarine case studies. Biogeochemistry, 106(2): 177-205.
DOI:10.1007/s10533-011-9588-9 |
Downing J A, McCauley E. 1992. The nitrogen:phosphorus relationship in lakes. Limnol. Oceanogr., 37(5): 936-945.
DOI:10.4319/lo.1992.37.5.0936 |
Fan C L, Glibert P M, Burkholder J M. 2003. Characterization of the affinity for nitrogen, uptake kinetics, and environmental relationships for Prorocentrum minimum in natural blooms and laboratory cultures. Harmful Algae, 2(4): 283-299.
DOI:10.1016/S1568-9883(03)00047-7 |
Ferreira J G, Hawkins A J S, Bricker S B. 2007. Management of productivity, environmental effects and profitability of shellfish aquaculture-the Farm Aquaculture Resource Management (FARM) model. Aquaculture, 264(1-4): 160-174.
DOI:10.1016/j.aquaculture.2006.12.017 |
Hallegraeff G M. 1993. A review of harmful algal blooms and their apparent global increase. Phycologia, 32(2): 79-99.
DOI:10.2216/i0031-8884-32-2-79.1 |
Han L J. 2013. Nutrient Characteristics and Source Apportionment in Atmospheric Deposition of the Yellow Sea and East China Sea. Ocean University of China, Qingdao. 66p. (in Chinese with English abstract)
|
Han X F, Wang R. 2001. The grazing impact and regulation effects of zooplankton on phytoplankton bloom. Mari.Sci., 25(10): 31-33.
(in Chinese with English abstract) |
Huang X P, Huang L M, Yue W Z. 2003. The characteristics of nutrients and eutrophication in the Pearl River estuary, South China. Mar. Pollut. Bull., 47(1-6): 30-36.
DOI:10.1016/S0025-326X(02)00474-5 |
Kitsiou D, Karydis M. 2011. Coastal marine eutrophication assessment:a review on data analysis. Environ. Int., 37(4): 778-801.
DOI:10.1016/j.envint.2011.02.004 |
Lai J X, Jiang F J, Ke K, Xu M B, Lei F, Chen B. 2014. Nutrients distribution and trophic status assessment in the northern Beibu Gulf, China. Chin. J. Oceanol. Limnol., 32(5): 1128-1144.
DOI:10.1007/s00343-014-3199-y |
Liu Z. 2004. Research on Modelling Water Exchange and Nutrient Budget in Jiaozhou Bay. Ocean University of China, Qingdao. (in Chinese with English abstract)
|
National Oceanic and Atmospheric Administration (NOAA). 1985. National Estuarine Inventory: Data Atlas, volume 1: Physical and Hydrologic Characteristics. U.S. Dept. of Commerce, National Oceanic and Atmospheric Administration, National Ocean Service, Rockville, MD. 103p.
|
Nixon S W. 1995. Coastal marine eutrophication:a definition, social causes, and future concerns. Ophelia, 41(1): 199-219.
DOI:10.1080/00785236.1995.10422044 |
NOWPAP CEARAC. 2009. Procedures for Assessment of Eutrophication Status Including Evaluation of LandBased Sources of Nutrients for the NOWPAP Region.NOWPAP CEARAC, Toyama, Japan. 13p.
|
NOWPAP CEARAC. 2011. Integrated Report on Eutrophication Assessment in Selected Sea Areas in the NOWPAP Region: Evaluation of the NOWPAP Common Procedure. NOWPAP CEARAC, Toyama, Japan. 116p.
|
NSQS. 1997. GB 3097-1997 National Seawater Quality Standard, China.
|
OSPAR Commission. 2003. OSPAR Integrated Report 2003 on the Eutrophication Status of the OSPAR Maritime Area Based Upon the First Application of the Comprehensive Procedure. OSPAR Commission, London, U.K. 59p.
|
Qingdao Ocean and Fishery Administration. 1997-2012.Bulletin of Marine Environmental Quality of Qingdao. Qingdao Ocean and Fishery Administration, Qingdao. (in Chinese)
|
Salmi T, Määttä A, Anttila P, Ruoho-Airola T, Amnell T. 2002.Detecting Trends of Annual Values of Atmospheric Pollutants by the Mann-Kendall Test and Sen's Slope Estimates -The Excel Template Application MAKESENS.Finnish Meteorological Institute, Helsinki. 35p.
|
Shandong and Qingdao Ocean and Fishery Administration. 1997-2012. Bulletin of Marine Environmental Quality of Shandong. Shandong Ocean and Fishery Administration, Jinan. (in Chinese)
|
Shastri Y, Diwekar U. 2006. Sustainable ecosystem management using optimal control theory:Part 1(deterministic systems). J. Theor. Biol., 241(3): 506-521.
DOI:10.1016/j.jtbi.2005.12.014 |
Shen Z L. 2001. Historical changes in nutrient structure and its influences on phytoplantkon composition in Jiaozhou Bay. Estuar. Coast. Shelf Sci., 52(2): 211-224.
DOI:10.1006/ecss.2000.0736 |
Sun S, Sun X X, Zhang G T, Tang H B, Liu Q, Li G M. 2011. Long-term changes in major meteorological and hydrological factors in the Jiaozhou Bay. Oceanol.Limnol. Sin., 42(5): 632-638.
(in Chinese with English abstract) |
Sun S, Sun X X. 2011. Atlas of Long-term Changes in the Jiaozhou Bay Ecosystem. Ocean Press, Beijing. p.60-179.
|
Tang S M, Lai J. 2003. The relationship between fish farming scales and algal blooms at the Sam Sing Bay in Port Shelter, Hong Kong, China. Acta Oceanol. Sin., 25(S2): 202-207.
(in Chinese with English abstract) |
Wang G. 2009. Study on the Pollutant of Point Source and Mariculture Fluxes Flowing into Jiaozhou Bay. Ocean University of China, Qingdao. (in Chinese with English abstract)
|
Wang Y, Zhang Y, Wang Y J, Liu D Y. 2013. Spatial and temporal characteristics of phytoplankton and its relation with the environmental factors in Jiaozhou Bay. J. Saf.Environ., 13(1): 163-170.
(in Chinese with English abstract) |
Wu M L, Wang Y S, Wang Y T, Sun F L, Sun C C, Cheng H, Dong J D. 2016. Seasonal and spatial variations of water quality and trophic status in Daya Bay, South China Sea. Mar. Pollut. Bull., 112(1-2): 341-348.
DOI:10.1016/j.marpolbul.2016.07.042 |
Wu Z X, Yu Z M, Song X X, Yuan Y Q, Cao X H, Liang Y B. 2013. Application of an integrated methodology for eutrophication assessment:a case study in the Bohai Sea. Chin. J. Oceanol. Limnol., 31(5): 1.
|
Wu Z X, Yu Z M, Song X X, Yuan Y Q, Cao X H. 2014. A new system of eutrophication assessment for both water quality and ecological response:a case study in typical areas off Shandong Peninsula. Oceanol. Limnol. Sin., 45(1): 20-31.
(in Chinese with English abstract) |
Xia B, Chen B J, Xin F Y, Lin W G, Xie J, Wang G J, Wang H Y. 2011. Application of the grey clustering method to assessing the eutrophication in Jiaozhou Bay. Prog.Fishery Sci., 32(5): 114-120.
(in Chinese with English abstract) |
Xiao Y J, Ferreira J G, Bricker S B, Nunes J P, Zhu M Y, Zhang X L. 2007. Trophic assessment in Chinese coastal systems-review of methods and application to the Changjiang (Yangtze) estuary and Jiaozhou Bay. Estuar.Coast., 30(6): 901-918.
DOI:10.1007/BF02841384 |
Xu M. 2012. Research on water quality and eutrophication of typical bays:a case study of Qinzhou Bay. Chinese Research Academy of Environmental Sciences, Beijing. p.1-78.
(in Chinese with English abstract)
|
Yang D F, Miao Z Q, Xu H Z, Chen Y, Sun J Y. 2013. Jiaozhou Bay water exchange time. Mar. Environ. Sci., 32(3): 373-380.
(in Chinese with English abstract) |
Yao Y, Shen Z L. 2004. Assessment of seawater eutrophication in the Jiaozhou Bay. Mar. Sci., 28(6): 14-17,22.
(in Chinese with English abstract) |
Yu Z M, Shen Z L, Chen Y Q, et al. 2011. Eutrophication in the Changjiang River Estuary and Adjacent Waters. Science Press, Beijing, China. p.1-549.
(in Chinese with English abstract)
|
Zhang M H. 2000. Distributions and seasonal variations of suspended matter in Jiaozhou Bay seawater. Stud. Mar.Sin., (42): 49-54.
(in Chinese with English abstract) |
Zhang Q L, Zhang X L, Wang X, Sun P. 2009. Assessment of eutrophication in southeast of Liaodong Bay. Coast. Eng., 28(1): 38-43.
(in Chinese with English abstract) |
Zhang X Q, Sun Y L. 2007. Research on the control of total pollutants loads into the Jiaozhou Bay. Mar. Environ. Sci., 26(4): 347-350,359.
(in Chinese with English abstract) |
Zhao D Z, Zhao L, Zhang F S. 2003. Type of formation, distribution and temporal trend of red tides occurred in the China Sea. Mar. Environ. Sci., 22(3): 7-11.
(in Chinese with English abstract) |
Zhao Q. 2010. The nutrient seasonal variation characteristics and comparison of several assessment methods of eutrophication in Qingduizi-Bay. Liaoning Normal University, Liaoning. p.1-31. (in Chinese with English abstract)
|
Zhou D S. 2008. Study on environment factors affecting outbreaks of red tide in Haizhou Bay coastal waters.Suzhou University, Suzhou. p.1-56. (in Chinese with English abstract)
|
Zhou Y, Yang H S, Hu H Y, Liu Y, Mao Y Z, Zhou H, Xu X L, Zhang F S. 2006. Bioremediation potential of the macroalga Gracilaria lemaneiformis (Rhodophyta)integrated into fed fish culture in coastal waters of north China. Aquaculture, 252(2-4): 264-276.
DOI:10.1016/j.aquaculture.2005.06.046 |
Zou J Z, Dong L P, Qin B P. 1983. Preliminary study of eutrophication and algal bloom in Bohai Bay. Mar.Environ. Sci., 2(2): 41-54.
(in Chinese) |