 2019, Vol. 37
Institute of Oceanology, Chinese Academy of Sciences
Article Information
- SONG Yingfei, ZHANG Longjun, LUO Xianxiang
- Spatiotemporal distribution of fish eggs and larvae in the Huanghe (Yellow) River estuary, China in 2005-2016
- Journal of Oceanology and Limnology, 37(5): 1625-1637
- http://dx.doi.org/10.1007/s00343-019-8167-0
Article History
- Received Oct. 9, 2018
- accepted in principle Nov. 14, 2018
- accepted for publication Dec. 3, 2019


Estuaries and adjacent areas are essential fish habitats that provide several functions for a variety of fish species, such as spawning grounds, nurseries, feeding grounds, migration routes, and refuge areas; therefore, these areas are important for fish survival and recruitment throughout the lifecycle (Elliott et al., 2007) and for ensuring high yields of fish. Because of the unique geographical location of these areas, fishery resources in estuaries and adjacent areas are easily affected because of the complex and dynamic environment and considerable influence of human activities. For example, hydrological changes occurred in the Mondego River estuary from 1988– 2012 due to human-induced alterations and weather extremes (Baptista et al., 2015), and these changes led to changes in the structure and function of the fish community, decreased the richness and biodiversity, and changed the dominant species from pelagic, detritivorous fishes with wider salinity ranges to demersal, benthic, piscivorous marine species (Baptista et al., 2015). Human activities, including overfishing, environmental pollution, and construction of the Three Gorges Dam, have resulted in smaller fish size, earlier sexual maturity, and lower trophic levels in the Changjiang (Yangtze) River estuary and adjacent waters (Shan et al., 2010; Han et al., 2016).
The health of a fishery depends largely on the survival condition of fish eggs and larvae (Oeberst et al., 2009; Arula et al., 2016). The larvae and parent fish in the spawning stage are sensitive to environmental changes, including hydrological conditions, such as water temperature, salinity, prey availability, and water pollution (Costa et al., 2007; Santos et al., 2017a). Understanding the distribution of fish eggs and larvae and the associated influencing factors are crucial for implementing fish recruitment and restoration (Santos et al., 2017a, b). In addition, long-term studies are necessary to explore factors influencing the distribution of fish eggs and larvae because as community changes due to environmental variations can be delayed (Poizat et al., 2004). As the fifth biggest estuary in the world, the HRE provides spawning, nursery, and feeding grounds for most species of the Yellow Sea and Bohai Sea. Over 50% of the fishes in the HRE were migratory species from the Yellow Sea and Bohai Sea in the 1980s, and most of these species were commercial species (Chen et al., 2000). However, the fishery resources of the HRE have rapidly decreased, and the fish community structure has greatly changed over the past three decades. The number of fish species decreased from over 60 in the 1980s to 40 in the 2010s, and so did the species abundance (Yang and Wang, 1993; Zhai et al., 2015). Traditional commercially targeted fishes, such as Trichiurus lepturus, Pagrus major, and Clupea pallasii, are locally extinct (Shan et al., 2013). Moreover, a rapid shift has occurred in the dominant species from high-economic-value, high-trophiclevel, and large-sized demersal species with complicated age structures to low-economic-value, low-trophic-level, and small-sized pelagic species with less diverse age structures (Jin et al., 2013; Shan et al., 2013).
Studies of the spatiotemporal distribution of fish eggs and larvae improve our understanding of the processes underlying recruitment in a fishery because this distribution can reflect the spawning mode of parent fish and the influence of the environment on the larval stage of fish (Santos et al., 2017a). Modern surveys on fish eggs and larvae focus primarily on the characteristics of annual seasonal or spatial variations (e.g., Machado et al., 2017; Sloterdijk et al., 2017). This study focuses on decade-level dynamic changes of the ichthyoplankton community structure and its influencing factors. Based on ecological survey data collected in the HRE over the past decade, we analyzed the spatiotemporal distribution of fish eggs and larvae and its relationships to water environmental factors and human activities to explore the main factors responsible for the decrease of fishery resources, in order to accumulate basic data and provide a scientific basis for fish recruitment, restoration, and sustainable development in the HRE and other estuaries.
2 MATERIAL AND METHOD 2.1 Study areaThe HRE is located in Kenli County of Dongying City, Shandong Province between Laizhou Bay and Bohai Bay (Fig. 1), and it is a typical river-dominant estuary (Wu et al., 2017). The Huanghe (Yellow) River carried a large amount of sediments and unloaded them in the estuary areas and forms a fan delta (Saito et al., 2000). The HRE is characterized by a shallow-water shelf in average depth of < 12 m, and the tidal regime near the river mouth is dominated by an irregular semi-diurnal tide in range of 0.6–1.3 m (Wu et al., 2017). The hydrological conditions were stable before the 1980s due to a stable freshwater input. However, the freshwater and sediment discharge dramatically decreased after the 1980s due to the construction of dams in the upper reaches of the Huanghe River and climate change, and these alterations have led to increased salinity and decreased water temperature and total nutrient input in the estuary and adjacent areas (Wang et al., 2007, 2011, 2017). Moreover, due to the annual water-sediment regulation scheme at the end of June to early July starting in 2002, the salinity of the estuary suddenly decreased and nutrients increased by 8- to 30-fold because of the large volume of freshwater input (Wang et al., 2011). This input greatly affected the estuarine ecosystem (Liu et al., 2012).

|
| Fig.1 Fish larva and egg sampling stations in the HRE |
Ichthyoplankton data were obtained from nine surveys carried out annually in May in 2005 and 2009–2016 in the HRE (119°–119.6°E, 37.3°– 38.1°N), and 13 sites were sampled in each cruise (Fig. 1). A single sample was collected from one station. Three stations, Y08 in 2005, Y 05 in 2011 and Y05 in 2012, were not sampled, and 114 samples in total were collected. Sampling was conducted by horizontal-trawlling with a shallow-water plankton net-Ⅰ (mesh mouth size of 0.507 mm), and the speed was 2 nmile/h, in duration of 10 or 15 min. The samples were fixed in 5% formaldehyde in seawater, and then quantitative and qualitative analyses were immediately conducted in laboratory. The sampling, treatment, preservation, and analysis of the ichthyoplankton species were in compliance to the Specification for Oceanographic Survey, Part 6: Marine Biological Survey in China (China's national standard No. GB 17378.3-2007).
Measurements of depth, water temperature, salinity, and chemical oxygen demand (COD), and sampling for phytoplankton and zooplankton were performed simultaneously to fish egg and larval sampling in May 2005, 2009, 2011, 2012, and 2013. The depth, temperature and salinity were measured continuously with a portable 301 CTD (IdronautLabs), and the salinity was measured using the Practical Salinity Scale. Discrete water samples were collected in 5-L Niskin bottles, and the COD was measured within 24 h according to the alkaline COD (Mn) measuring method. The sampling, treatment, preservation, and analysis of water environment parameters were compliant to the Specification for Marine Monitoring: Part 4: Seawater Analysis in China (China's national standard No. GB 17378.3- 2007). Phytoplankton and zooplankton samples were towed vertically from the bottom to the surface with a shallow-water plankton net-Ⅲ (mesh size of 0.077 mm), and a shallow-water plankton net-Ⅱ (mesh size of 0.169 mm), respectively, and then fixed in 5% formaldehyde in seawater. Quantitative and qualitative analyses were conducted immediately in laboratory. The sampling, treatment, preservation, and analysis of phytoplankton and zooplankton were compliant to the Specification for Oceanographic Survey: Part 6: Marine Biological Survey in China (China's national standard No. GB 17378.3-2007).
2.3 Data analysesThe abundance of fish eggs, fish larvae, phytoplankton and zooplankton were calculated as follows:
 (1)
(1)where A is the abundance (ind./m3), N is the individual amount (ind.), V is the filtered water volume (m3), S is the area of the net mouth (m2), L is the trawling distance (m), v is the trawling speed (m/h), and t is the trawling time (h).
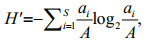
The dominance (Y; Emery, 2007), H′ (Shannon and Weaver, 1949), and coefficient of community similarity (QS) that indicates the level of similarity of species compositions between communities (Wolda, 1981), were applied to analyze the fish egg and larval community and were calculated as follows:
 (2)
(2) (3)
(3) (4)
(4)where ai is the abundance of species i; A is the total abundance; fi is the occurrence frequency of species i; x and y are the species number of the current and the last year, respectively; and z is the species number of the same species in the current and the last year. We identified the dominant species as the one with Y≥0.02 (Xu et al., 2016). Fish species eggs and larvae were calculated together with Eqs.2–4. We counted the eggs and larvae that belonged to the same species separately. Thus, fish eggs and larvae of one species were treated as two species.
A cluster analysis (Cluster) and multi-dimensional scaling (MDS) in Plymouth Routine in Multivariate Ecological Research (PRIMER 5.0) software were applied to analyze the temporal and spatial changes in the fish egg and larval community. A similarity percentage analysis (SIMPER) in PRIMER (5.0) was performed to analyze the dissimilarity of the species composition between assemblages. An analysis of variance (ANOVA) was performed using the Statistical Package for Social Sciences (SPSS 18.0) program to compare the species number, abundance and H′ of the fish eggs and larvae and environmental factors among assemblages. A univariate correlation analysis was performed using SPSS (18.0) to analyze the linear correlations between fish eggs and larvae and environmental factors.
A detrended correspondence analysis (DCA) and redundancy analysis (RDA) were performed using software for multivariate analyses of ecological data (CANOCO 5.0) to analyze the constrained relationships among the number, abundance and H′ of fish species eggs and larvae and environmental factors. All environmental variables were lg(x+1)- transformed before analysis, while the ichthyoplankton data were lg(10x+1)-transformed before the analysis to obtain consecutive distributions.
3 RESULT AND DISCUSSION 3.1 Environmental characteristicsChanges in the water environment factors in the HRE in May 2005, May 2009, and May 2011–2013 are shown in Fig. 2. The average depth of each cruise in the study area ranged from 8.7 to 12.0 m, and significant differences were not observed among the five cruises. The average water temperature ranged from 16.8 to 20.8℃, and it was the highest in May 2009 and lowest in May 2011. The average salinity of each cruise was significantly different from each other and showed a general trend of initial increase and then decrease, and it was the highest in May 2011 and lowest in May 2013. The average COD in May 2005 was 2.98 mg/L, which was above (i.e., inferior) the Grade I (the best) seawater quality benchmark (2 mg/L) of the China's national standard (No. GB 3097-1997); however, the average COD in other cruises was below (i.e., superior) the Grade I seawater quality benchmark. The average number of phytoplankton species varied from 9.9 to 12.8, and significant differences were not observed among the five cruises. The average abundance of phytoplankton ranged from 0.2×10⁶ to 3.2×10⁶ ind./m3, and the values in May 2011 and May 2012 were much higher than those from the other cruises. The average species number of zooplankton ranged from 3.5 to 14.5, while the average abundance of zooplankton ranged from 1.4×10⁴ to 5.7×10⁴ ind./m3, both values were significantly higher in May 2009 compared with the other cruises'. The average biomass of zooplankton ranged from 102.1 to 465.1 mg/m3, and this value was significantly lower in May 2005 than the other cruises.

|
| Fig.2 Changes of the water environment factors in the HRE a. depth; b. water temperature; c. salinity; d. chemical oxygen demand (COD); e. number of phytoplankton species; f. abundance of phytoplankton; g. number of zooplankton species; h. abundance of zooplankton; i. biomass of zooplankton. The minimal, maximal, and median values are indicated by straight lines. The box indicates the 25th and 75th percentiles. The dot indicates the mean value. Different letters indicate a significant difference between cruises (P < 0.05); the same letters indicate no significant difference (P>0.05). |
The quantitative analysis and identification revealed that 12 samples (10.53% of total samples), including Y03 in 2005; Y01 and Y06 in 2009; Y07 in 2013; Y04 in 2015; and Y03, Y04, Y05, Y06, Y07, Y12, and Y13 in 2016, had no fish eggs or larvae. The spatiotemporal distribution of fish eggs and larvae was then analyzed based on these 102 (114–12) samples that presented fish eggs or larvae.
A total of 23 fish egg species and 20 fish larval species were collected during nine cruises in the HRE and adjacent areas, and four of these species were identified to the family level, two were identified to the genus level and 37 were identified to the species level. All the collected fish eggs and larvae belonged to Osteichthyes and eight orders. Twenty-two species belonged to Perciformes, 11 to Clupeiformes, 3 to Scorpaeniformes, 2 to Mugiliformes, 2 to Pleuronectiformes, 1 to Beloniformes, 1 to Syngnathiformes and 1 to Myctophiformes. The thermophily of the collected fish eggs and larvae revealed them to be mainly warm temperate species (Yang and Wang, 1993), and the ecological distribution type was mainly migratory fishes (Chen et al., 2000).
The number of fish species eggs and larvae ranged from 2 to 13 (annual mean 6.0) and 2 to 7 (annual mean 4.1), respectively (Fig. 3). The abundance of fish eggs and larvae ranged from 0.01 ind./m3 to 4.55 ind./m3 (annual mean 0.91) and 0.02 ind./m3 to 0.37 ind./m3 (annual mean 0.13), respectively (Fig. 3). H′ ranged from 0.48 to 1.27 (annual mean 0.86; Fig. 3). Overall, the species number, abundance and H′ of the fish eggs and larvae fluctuated considerably during the study period and showed a peak in 2015 and a low point in 2012. Compared with the species number, abundance and H′ of the fish eggs and larvae in the 1980s (Wang et al., 2010; Supporting Information Table S1), these values were significantly lower during the study period.

|
| Fig.3 Temporal distribution of the number of fish species eggs and larvae, average abundances and H′ in the study area |
The temporal distribution of the fish egg and larval community was subjected to the Cluster analysis based on the Bray-Curtis similarities of the species composition and lg(x+1)-transformed average abundance of fish eggs and larvae in the 102 samples of fish eggs and/or larvae. The results show that the 102 samples could be classified into four assemblages in the Bray-Curtis similarity at 0.53% (P=0.001), and these assemblages are hereafter referred to as 2005, 2009–2011, 2012–2013, and 2014–2015 (Fig. 4a). Although the Bray-Curtis similarity level was low, the average dissimilarity of species composition between the four assemblages was 99.05%, 97.31%, 99.41%, and 98.66%. The samples from 2016 were spread over different groups and had no distinguishing feature. The results of the MDS (Fig. 4b) are consistent with those of the Cluster analysis at the stress value of < 0.2, demonstrating the reliability of the MDS result (Clarke and Warwick, 2001).

|
| Fig.4 Dendrogram resulting from the CLUSTER analysis (a) and MDS ordination (b) based on the Bray-Curtis similarities in the species composition and lg(x+1)-transformed abundance of fish eggs and larvae Groups 2005, 2009-2011, 2012-2011, and 2014-2015 represent the four assemblages that are mainly composed of samples in the corresponding time period. The red line is the 0.53% similarity level. |
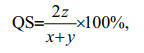
In this case, we conclude that the community composition of fish eggs and larvae changed rapidly from 2005 to 2016 in the study area, and substantial variability occurred every 2–3 years. However, a previous research shows that substantial variability in the fish community structure of the HRE and Laizhou Bay occurred on a decadal scale from 1959 to 2008 (Jin et al., 2013). The faster change rate in the fish community revealed in the present study indicates that the fish community structure becomes recently more unstable, as supported by the low QS and different dominant species compositions among cruises (Table 1). The species composition greatly differed among cruises, and the QS ranged from 0 to 53% except for 2012 and 2013, during which the species composition was the same. The QS values of 2009, 2014, and 2016 were 0, indicating a substantial variability. The dominant species composition also greatly differed, and the major dominant species were entirely different among the cruises except for 2014 and 2015. Overall, the dominant species composition varied annually.
In addition, the dominant species were mainly pelagic species with a low trophic level and small size, such as Harengula zunasi and Clupanodon punctatus, and there were no commercial fishes in the dominant species list except in 2015 and 2016, during which Pagrosomus major, Ilisha elongata and Saurida elongata were collected. Platycephalus indicus, the dominant species in 1982, 1993 and 2003 (Wang et al., 2010), was not on the dominant species list of the study period. Engraulis japonicus, the prey of commercial fishes, which was the first dominant species in the former investigation of fish eggs and larvae in study areas in 1982, 1993, 2003, and 2008 (Wang et al., 2010), was collected in 2014 only as the second dominant species during the study period.
The results indicate that the species number, abundance and H′ of fish eggs and larvae were much lower than those in the 1980s (Wang et al., 2010; Supporting Information Table S1); the community structure recently became unstable; and commercial fishes that previously were dominant in the study area (Wang et al., 2010) were not on the dominant species list during the study period. These results show that the fishery resources of the HRE decreased more intensely over the last decade. Many estuaries worldwide have shown the signs of a decline in fisheries resources. For example, the number of fish species in the Mondego River estuary decreased significantly from 42 to 25 from 1988 to 2012 (Baptista et al., 2015); a total of 11 species of fish eggs and 34 species of larvae were captured in the Changjiang (Yangtze) River estuary of China from 2002 to 2009, whereas only 3 larvae appeared every year, thus indicating a rapid shift of community structure (Jiang et al., 2013).
3.3 Spatial distribution of the fish egg and larval communityFor the fish species eggs and larvae, the average number ranged from 0.50 to 1.75 and 0.44 to 1.38, respectively, and the average abundance ranged from 0.02 to 4.35 ind./m3 and 0.02 to 0.32 ind./m3, respectively (Fig. 5). The H′ value of the fish eggs and larvae calculated together ranged from 0.15 to 1.27 (Fig. 5). Overall, the fish egg and larval species number, abundance and H′ of station Y06-Y13 in the southern sea were slightly higher than that of Y01-Y03 in the northern sea, and these values in station Y04 and Y05 near the river mouth were the lowest.
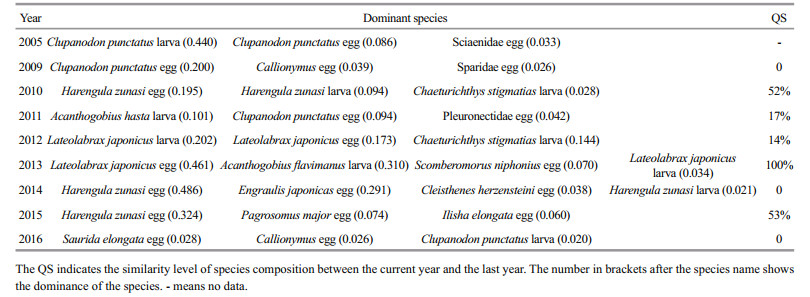
The spatial distribution of fish eggs and larvae were subjected to the Cluster analysis based on the Bray-Curtis similarities of the species composition and the fourth-root-transformed average abundance of fish eggs and larvae at 13 sites. The 13 sites were classified into two significantly different groups, A and B, in the Bray-Curtis similarity of 45% (P=0.013) (Fig. 6a). Y04 and Y05, which are located at the HRE entrance, belonged to group A, and the other 11 stations belonged to group B. The MDS results (Fig. 6b) are consistent with those of the Cluster analysis, and the stress value of < 0.2 demonstrated the reliability of the MDS results (Clarke and Warwick, 2001). The number and H′ of fish species eggs and larvae in group B were significantly higher than those in group A. The abundance of fish eggs and larvae in group B were also higher than those in group A, although the difference was not significant (Table 2).

|
| Fig.5 Spatial distribution of the number of fish species eggs and fish species larvae, average abundance and H′ in the study area |

|
| Fig.6 Dendrogram resulting from the cluster analysis (a) and multi-dimensional scaling (MDS) ordination (b) based on the Bray-Curtis similarities in species composition and fourth-root-transformed abundance of fish eggs and larvae Group A and group B are two assemblages with significant differences (P < 0.05). The red dashed line is the 45% similarity level. |
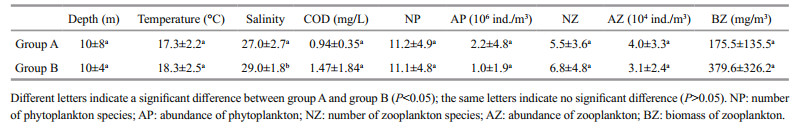
|
The ANOVA results of the water environmental factors between the two groups showed that the salinity in group A was significantly lower than that in group B (P < 0.05); however, no significant differences were found among the other environmental factors (Table 3). Therefore, salinity may be the main factor responsible for the spatial distribution of the fish egg and larval community.
|
The varying abundance of dominant fish eggs and larvae along the salinity gradient in the study areas (Fig. 7) showed that the total abundance and number of fish species eggs and larvae increased as the salinity increased. Most of the dominant species clustered at salinities higher than 26, such as Harengula zunasi eggs and larvae, which clustered at salinities between 26 and 32; Clupanodon punctatus eggs and larvae, which clustered at salinities between 28 and 32; Engraulis japonicas eggs; and Acanthogobius flavimanus larvae. Only a small number of species clustered at salinities less than 26, such as Lateolabrax japonicus eggs and larvae, which clustered at salinities between 22 and 28. These findings indicate that salinity was the primary influencing factor for the spatial distribution of the fish egg and larval community. Different fish species have different tolerances to salinity during the egg fertilization and incubation, yolk sac resorption, swim bladder inflation and larval growth periods (Boeuf and Payan, 2001); therefore, different fish species clustered in areas with different salinities. For example, two different fish communities, the oligohaline community and the euryhaline community, were identified in the upper and lower Chikugo estuary, respectively (Islam et al., 2006); the main species of the lower salinity areas in the upper Canche estuary were freshwater species, whereas those in the higher salinity areas of the estuary were marine migrants and marine adventitious visitors (Selleslagh and Amara, 2008). Moreover, the dominant fish species of the Mondego River estuary changed from species with wider salinity ranges to marine species when the salinity increased (Baptista et al., 2015).

|
| Fig.7 Abundance variability of dominant fish eggs and larvae against the salinity gradient in the study area Circles with different colours represent fish egg abundance of different species, and triangles with different colours represent fish larval abundance. Three species with high abundance and occurrence frequency mainly lived in different salinity areas are enclosed by different coloured boxes: blue ones for Harengula zunasi fish eggs and larvae, magenta for Clupanodon punctatus and black for Lateolabrax japonicas. |
The DCA showed that the maximum gradient length was less than 3 SD, which was suitable for the RDA based on the linear model (Morris, 2015). Forward selection was applied to select significant water environmental factors that could pass the Monte Carlo replacement test (P < 0.05), and they included the phytoplankton species number, zooplankton abundance and temperature. However, the factors did not include salinity because different ichthyoplankton species clustered in areas with different salinity and thus a significant linear correlation was not observed between salinity and the number, abundance and diversity of ichthyoplankton species.
According to the ordination plot of the RDA (Fig. 8), the first two axes, which had eigenvalues of 0.467 and 0.327, explained 97.7% of the cumulative variation of the ichthyoplankton-environment relationships. In the ordination plot from the RDA, the abundance of zooplankton was significantly positively correlated with the first ordination axis, while the number of phytoplankton species was negatively correlated with the first ordination axis. In addition, temperature was significantly negatively correlated with the second ordination axis.

|
| Fig.8 Redundancy analysis (RDA) of the number, abundance, H′ of fish species eggs and larvae and environmental factors in the HRE |
The number and abundance of fish species eggs were significantly positively correlated with water temperature (R=0.266, P=0.038; R=0.330, P=0.009) because the fishes were mainly warm temperate water species in the study area, and these species migrated from the Yellow Sea and Bohai Sea to the HRE to spawn beginning in April when the temperature started to rise. A moderate rise in the water temperature promotes the incubation rate (Régnier et al., 2018) and survival rate (Imsland et al., 2019) of fish eggs. Significant correlations were not observed between the number and abundance of fish species larvae and water temperature because small changes in the ambient temperature had little effect on the survival rate of fish larvae (Imsland et al., 2019). The number and abundance of fish species eggs were significantly positively correlated with the zooplankton abundance (R=0.351, P=0.006; R=0.321, P=0.012), and the number and abundance of fish species larvae were significantly positively correlated the number of phytoplankton species (R=0.199, P=0.048; R=0.329, P=0.010) because phytoplankton and zooplankton are the basic bait of larvae and parent fish, and fish will spawn and nurse in areas and during time periods that have abundant prey (Cushing, 1990; Gordoa and Carreras, 2014; Santarelli et al, 2014).
3.5 Major human activities influencing fishery resourcesOverfishing and intensive fishing methods are the main factors that led to the decline in fishery resources in the estuary (Bascompte et al., 2005; Daskalov et al., 2007). Previous research showed that the catch effort in the HRE had increased by 40-fold over the last 50 years while the fish catch per unit effort had decreased by almost 116-fold (Jin et al., 2013; Shan et al., 2013). Beam trawling, as a traditional fishing method in the HRE, leads to a number of problems, such as heavy seafloor impact (Kaiser and Spencer, 1996) and low species and size selectivity, thereby resulting in the destruction of the benthos and larval fish (Polet et al., 2006; Catchpole et al., 2008). Although beam trawling has been banned in the Bohai Sea since autumn 1988, the fishery resources of the HRE, the Bohai Sea and the Yellow Sea had already been destroyed.
Highly variable salinity can affect resident fish species reproduction, fish migration and schooling (Strydom, 2003; Gillson et al., 2009; Baptista et al., 2015), thereby leading to the decline of fishery resources. As a typical river-dominant estuary, the stabilisation of salinity mainly depends on the freshwater discharge, although it is also affected by nearshore circulation. Certain human activities, such as the large water abstraction and dam construction in the upstream regions, led to decreases in the river flow and even drying up periods beginning in the 1950s (Wang et al., 2006; Zhang et al., 2017). Such changes may have increased the seawater intrusion and, consequently, the salinity (Fan and Huang, 2008). On the other hand, the seawater intrusion may also have favoured the migration of several marine species (Santos et al., 2017b), which might explain why the dominant species of the HRE were mostly species adapted to higher salinity environments. The annual Water-Sediment Regulation Scheme started in 2002 and led to large volumes of freshwater input in a very short time period. This practice disrupted the balance of the physicochemical environment in the estuary and led to abrupt changes in temperature and salinity (Wang et al., 2007, 2011, 2017). These changes had a substantial effect on the fishery resources of the HRE and even the Bohai Sea (Jin, 2004; Jin et al., 2013). Other estuaries worldwide, such as the Yangtze River estuary (Gao et al., 2018) and the Mondego River estuary (Baptista et al., 2015), have also shown that changes in the freshwater discharge can affect the fishery resources.
Therefore, overfishing, dam construction and human-controlled runoff activities were the main anthropogenic drivers that led to the substantial decline in fishery resources in the HRE. Future management and protection for the fishery resources of the estuary should focus on controlling fishing activities and strengthening the regulation of fishing activities during the period of no-fishing in order to promote self-rehabilitation of the fishery resources. In addition, artificial recharge activities, such as the rational allocation of the Huanghe River water resources, should be conducted to protect the lowsalinity area, which is necessary for fish to spawn and nurse.
4 CONCLUSIONAnthropogenic drivers, such as overfishing and human-controlled runoff activities, are responsible for the substantial decline in fishery resources and deepening decline over the past decade in the HRE. The species number, abundance and H′ of fish eggs and larvae were all much lower over the past decade than those in the 1980s; the fish egg and larval community structure was extremely unstable, with substantial variability occurring every 2–3 years; the dominant species were mainly low-commercial-value and small-sized fish; and some economic species have disappeared. The spatiotemporal distribution of the fish egg and larval community was closely related to the physicochemical environment. Salinity was the main factor for the spatial distribution of fish eggs and larvae, and different species with different salt tolerances clustered in areas of different salinity levels. The species number and H′ of the lower salinity stations near the river mouth were significantly lower than those at the higher salinity stations farther from the river mouth. The number and abundance of fish species eggs were significantly positively correlated with water temperature; the number and abundance of fish species eggs were significantly positively correlated with zooplankton abundance; and the number and abundance of fish species larvae were significantly negatively correlated the number of phytoplankton species. Therefore, water temperature and prey availability were the main water environmental factors affecting the abundance and species number of fish eggs and larvae in the HRE. The findings presented in this study can help elucidate the spatiotemporal variation in fishery resources and relevant influencing factors, thereby providing a scientific basis for research on dynamic changes and recruitment in fisheries in other estuaries worldwide.
5 DATA AVAILABILITY STATEMENTThe datasets generated during and/or analyzed during the current study are available from the corresponding author on reasonable request.
6 ACKNOWLEDGEMENTWe are grateful to the staff of the Organization of North China Sea Monitoring Center for the sampling and analysis of fish eggs and larvae and environmental parameters in the Huanghe River estuary and its adjacent areas.
Electronic supplementary materialSupplementary material (Supporting Information Table S1) is available in the online version of this article at https://doi.org/10.1007/s00343-019-8167-0.
Arula T, Raid T, Simm M, Ojaveer H. 2016. Temperaturedriven changes in early life-history stages influence the Gulf of Riga spring spawning herring (Clupea harengus m.) recruitment abundance. Hydrobiologia, 767(1): 125-135.
DOI:10.1007/s10750-015-2486-8 |
Baptista J, Martinho F, Nyitrai D, Pardal M A, Dolbeth M. 2015. Long-term functional changes in an estuarine fish assemblage. Marine Pollution Bulletin, 97(1-2): 125-134.
DOI:10.1016/j.marpolbul.2015.06.025 |
Bascompte J, Melián C J, Sala E, Paine R T. 2005. Interaction strength combinations and the overfishing of a marine food web. Proceedings of the National Academy of Sciences of the United States of America, 102(15): 5443-5447.
DOI:10.1073/pnas.0501562102 |
Boeuf G, Payan P. 2001. How should salinity influence fish growth?. Comparative Biochemistry and Physiology Part C:Toxicology & Pharmacology, 130(4): 411-423.
DOI:10.1016/S1532-0456(01)00268-X |
Catchpole T, Van Keeken O, Gray T, Piet G. 2008. The discard problem-a comparative analysis of two fisheries:the English Nephrops fishery and the Dutch beam trawl fishery. Ocean & Coastal Management, 51(11): 772-778.
DOI:10.1016/j.ocecoaman.2008.06.015 |
Chen D G, Shen W Q, Liu Q, Jiao Y, Zeng X Q, Ren Y P. 2000. The geographical characteristics and fish species diversity in the Laizhou Bay and Yellow River estuary. Journal of Fishery Sciences of China, 7(3): 46-52.
DOI:10.3321/j.issn:1005-8737.2000.03.011 |
Clarke K R, Warwick R M. 2001. Change in Marine Communities: An Approach to Statistical Analysis and Interpretation. 2nd edn. PRIMER-E, Plymouth.
|
Costa M J, Cabral H N, Drake P, Economou A N, Fernandez-Delgado C, Gordo L, Marchand J, Thiel R. 2007.Recruitment and Production of Commercial Species in Estuaries. In: Elliott M, Hemingway K eds. Fishes in Estuaries. John Wiley & Sons, Washington. p.54-123, https://doi.org/10.1002/9780470995228.
|
Cushing D H. 1990. Plankton production and year-class strength in fish populations:an update of the match/mismatch hypothesis. Advances in Marine Biology, 26: 249-293.
DOI:10.1016/S0065-2881(08)60202-3 |
Daskalov G M, Grishin A N, Rodionov S, Mihneva V. 2007. Trophic cascades triggered by overfishing reveal possible mechanisms of ecosystem regime shifts. Proceedings of the National Academy of Sciences of the United States of America, 104(25): 10518-10523.
DOI:10.1073/pnas.0701100104 |
Elliott M, Whitfield A K, Potter I C, Blaber S J M, Cyrus D P, Nordlie F G, Harrison T D. 2007. The guild approach to categorizing estuarine fish assemblages:a global review. Fish and Fisheries, 8(3): 241-268.
DOI:10.1111/j.1467-2679.2007.00253.x |
Emery S M. 2007. Limiting similarity between invaders and dominant species in herbaceous plant communities?. Journal of Ecology, 95(5): 1027-1035.
DOI:10.1111/j.1365-2745.2007.01274.x |
Fan H, Huang H J. 2008. Response of coastal marine ecoenvironment to river fluxes into the sea:a case study of the Huanghe (Yellow) River mouth and adjacent waters. Marine Environmental Research, 65(5): 378-387.
DOI:10.1016/j.marenvres.2008.01.003 |
Gao L, Cheng F, Song Y Q, Jiang W, Feng G P, Luo Y M, Xie S G. 2018. Patterns of larval fish assemblages along the direction of freshwater input within the southern branch of the Yangtze Estuary, China:implications for conservation. Journal of Freshwater Ecology, 33(1): 97-114.
DOI:10.1080/02705060.2018.1426503 |
Gillson J, Scandol J, Suthers I. 2009. Estuarine gillnet fishery catch rates decline during drought in eastern Australia. Fisheries Research, 99(1): 26-37.
DOI:10.1016/j.fishres.2009.04.007 |
Gordoa A, Carreras G. 2014. Determination of temporal spawning patterns and hatching time in response to temperature of Atlantic bluefin tuna (Thunnus thynnus) in the Western Mediterranean. PLoS One, 9(3): e90691.
DOI:10.1371/journal.pone.0090691 |
Han R, Chen Q W, Wang L, Tang X W. 2016. Preliminary investigation on the changes in trophic structure and energy flow in the Yangtze estuary and adjacent coastal ecosystem due to the three gorges reservoir. Ecological Informatics, 36: 152-161.
DOI:10.1016/j.ecoinf.2016.03.002 |
Imsland A K D, Danielsen M, Jonassen T M, Hangstad T A, Falk-Petersen I B. 2019. Effect of incubation temperature on eggs and larvae of lumpfish (Cyclopterus lumpus). Aquaculture, 498: 217-222.
DOI:10.1016/j.aquaculture.2018.08.061 |
Islam M S, Hibino M, Tanaka M. 2006. Distribution and diets of larval and juvenile fishes:influence of salinity gradient and turbidity maximum in a temperate estuary in upper Ariake Bay, Japan. Estuarine, Coastal and Shelf Science, 68(1-2): 62-74.
DOI:10.1016/j.ecss.2006.01.010 |
Jiang M, Shen X Q, Li L, Quan W M. 2013. Annual variability of ichthyoplankton in the Yangtze River estuary of china from august 2002 to 2009. Oceanological and Hydrobiological Studies, 42(1): 59-69.
DOI:10.2478/s13545-013-0060-4 |
Jin X S, Shan X J, Li X S, Wang J, Cui Y, Zuo T. 2013. Longterm changes in the fishery ecosystem structure of Laizhou Bay, China. Science China Earth Sciences, 56(3): 366-374.
|
Jin X S. 2004. Long-term changes in fish community structure in the Bohai Sea, China. Estuarine, Coastal and Shelf Science, 59(1): 163-171.
DOI:10.1016/j.ecss.2003.08.005 |
Kaiser M J, Spencer B E. 1996. The effects of beam-trawl disturbance on infaunal communities in different habitats. Journal of Animal Ecology, 65(3): 348-358.
DOI:10.2307/5881 |
Liu S M, Li L W, Zhang G L, Liu Z, Yu Z G, Ren J L. 2012. Impacts of human activities on nutrient transports in the Huanghe (Yellow River) estuary. Journal of Hydrology, 430-431: 103-110.
DOI:10.1016/j.jhydrol.2012.02.005 |
Machado I, Calliari D, Denicola A, Rodríguez-Graña L. 2017. Coupling suitable prey field to in situ fish larval condition and abundance in a subtropical estuary. Estuarine, Coastal and Shelf Science, 187: 31-42.
DOI:10.1016/j.ecss.2016.12.021 |
Morris C. 2015. Multivariate analysis of ecological data using CANOCO 5, 2nd edition. African Journal of Range & Forage Science, 32(4): 289-290.
DOI:10.2989/10220119.2015.1015053 |
Oeberst R, Klenz B, Gröhsler T, Dickey-Collas M, Nash R D M, Zimmermann C. 2009. When is year-class strength determined in western Baltic herring?. ICES Journal of Marine Science, 66(8): 1667-1672.
DOI:10.1093/icesjms/fsp143 |
Poizat G, Rosecchi E, Chauvelon P, Contournet P, Crivelli A J. 2004. Long-term fish and macro-crustacean community variation in a Mediterranean lagoon. Estuarine, Coastal and Shelf Science, 59(4): 615-624.
DOI:10.1016/j.ecss.2003.11.007 |
Polet H, Depestele J, Stouten H, Vanderperren E. 2006.Moving from beam trawls towards multi-rig ottertrawls-and further. In: Conference on Energy Efficiency in Fisheries. Conference Center Albert Borschette, Brussels.p.32-34.
|
Régnier T, Gibb F M, Wright P J. 2018. Temperature effects on egg development and larval condition in the lesser sandeel, Ammodytes marinus. Journal of Sea Research, 134: 34-41.
DOI:10.1016/j.seares.2018.01.003 |
Saito Y, Wei H L, Zhou Y Q, Nishimura A, Sato Y, Yokota S. 2000. Delta progradation and Chenier formation in the Huanghe (Yellow River) delta, China. Journal of Asian Earth Sciences, 18(4): 489-497.
DOI:10.1016/S1367-9120(99)00080-2 |
Santarelli S, Lesuis S L, Wang X D, Wagner K V, Hartmann J, Labermaier C, Scharf S H, Müller M B, Holsboer F, Schmidt M V. 2014. Evidence supporting the match/mismatch hypothesis of psychiatric disorders. European Neuropsychopharmacology, 24(6): 907-918.
DOI:10.1016/j.euroneuro.2014.02.002 |
Santos R V S, Ramos S, Bonecker A C T. 2017a. Environmental control on larval stages of fish subject to specific salinity range in tropical estuaries. Regional Studies in Marine Science, 13: 42-53.
DOI:10.1016/j.rsma.2017.03.010 |
Santos R V S, Ramos S, Bonecker A C T. 2017b. Can we assess the ecological status of estuaries based on larval fish assemblages?. Marine Pollution Bulletin, 124(1): 367-375.
DOI:10.1016/j.marpolbul.2017.07.043 |
Selleslagh J, Amara R. 2008. Environmental factors structuring fish composition and assemblages in a small macrotidal estuary (eastern English Channel). Estuarine, Coastal and Shelf Science, 79(3): 507-517.
DOI:10.1016/j.ecss.2008.05.006 |
Shan X J, Jin X S, Yuan W. 2010. Fish assemblage structure in the hypoxic zone in the Changjiang (Yangtze River)estuary and its adjacent waters. Chinese Journal of Oceanology and Limnology, 28(3): 459-469.
DOI:10.1007/s00343-010-9102-6 |
Shan X J, Sun P F, Jin X S, Li X S, Dai F Q. 2013. Long-term changes in fish assemblage structure in the Yellow River estuary ecosystem, China. Marine and Coastal Fisheries, 5(1): 65-78.
DOI:10.1080/19425120.2013.768571 |
Shannon C E, Weaver W. 1949. The Mathematical Theory of Communication. University of Illinois Press, Urbana, USA. p.14.
|
Sloterdijk H, Brehmer P, Sadio O, Müller H, Döring J, Ekau W. 2017. Composition and structure of the larval fish community related to environmental parameters in a tropical estuary impacted by climate change. Estuarine, Coastal and Shelf Science, 197: 10-26.
DOI:10.1016/j.ecss.2017.08.003 |
Strydom N A. 2003. Occurrence of larval and early juvenile fishes in the surf zone adjacent to two intermittently open estuaries, South Africa. Environmental Biology of Fishes, 66(4): 349-359.
DOI:10.1023/A:1023949607821 |
Wang A Y, Wan R J, Jin X S. 2010. Decadal variations of ichthyoplankton biodiversity in spring in Laizhou Bay of the Bohai Sea. Progress in Fishery Science, 31(1): 19-24.
(in Chinese with English abstract) DOI:10.3969/j.issn.1000-7075.2010.01.004 |
Wang H J, Wu X, Bi N S, Li S, Yuan P, Wang A M, Syvitski J P M, Saito Y, Yang Z S, Liu S M, Nittrouer J. 2017. Impacts of the dam-orientated water-sediment regulation scheme on the lower reaches and delta of the Yellow River (Huanghe):a review. Global and Planetary Change, 157: 93-113.
DOI:10.1016/j.gloplacha.2017.08.005 |
Wang H J, Yang Z S, Saito Y, Liu J P, Sun X X, Wang Y. 2007. Stepwise decreases of the Huanghe (Yellow River)sediment load (1950-2005):impacts of climate change and human activities. Global and Planetary Change, 57(3-4): 331-354.
DOI:10.1016/j.gloplacha.2007.01.003 |
Wang H J, Yang Z S, Saito Y, Liu J P, Sun X X. 2006. Interannual and seasonal variation of the Huanghe(Yellow River) water discharge over the past 50 years:connections to impacts from ENSO events and dams. Global and Planetary Change, 50(3-4): 212-225.
DOI:10.1016/j.gloplacha.2006.01.005 |
Wang Y C, Liu Z, Gao H W, Ju L, Guo X Y. 2011. Response of salinity distribution around the yellow river mouth to abrupt changes in river discharge. Continental Shelf Research, 31(6): 685-694.
DOI:10.1016/j.csr.2011.01.005 |
Wolda H. 1981. Similarity indices, sample size and diversity. Oecologia, 50(3): 296-302.
DOI:10.1007/BF00344966 |
Wu X, Bi N S, Xu J P, Nittrouer J A, Yang Z S, Saito Y, Wang H J. 2017. Stepwise morphological evolution of the active Yellow River (Huanghe) delta lobe (1976-2013):dominant roles of riverine discharge and sediment grain size. Geomorphology, 292: 115-127.
DOI:10.1016/j.geomorph.2017.04.042 |
Xu J Y, Xu Z L, Gao Q. 2016. Distribution of dominant zooplankton species along a latitudinal gradient in China Sea during spring. Journal of Ocean University of China, 15(3): 502-508.
DOI:10.1007/s11802-016-2871-6 |
Yang J M, Wang C X. 1993. Primary fish survey in the Huanghe River estuary. Chinese Journal of Oceanology and Limnology, 11(4): 368-374.
DOI:10.1007/BF02850642 |
Zhai L, Xu B D, Ji Y P, Ren Y P. 2015. Spatial pattern of fish assemblage and the relationship with environmental factors in Yellow River Estuary and its adjacent waters in summer. Chinese Journal of Applied Ecology, 26(9): 2852-2858.
(in Chinese with English abstract) |
Zhang Q, Zhang Z J, Shi P J, Singh V P, Gu X H. 2018. Evaluation of ecological instream flow considering hydrological alterations in the Yellow River basin, China. Global and Planetary Change, 160: 61-74.
DOI:10.1016/j.gloplacha.2017.11.012 |